


Continuing Care at Highland Springs
Assisted Living, Independent Living & Memory Care · Dallas, TX


Continuing Care at Highland Springs
Assisted Living, Independent Living & Memory Care · Dallas, TX
Continuing Care at Highland Springs accepts Medicaid and Medicare.
Under owner Matthew Neville, Continuing Care at Highland Springs is a small nursing home on Frankford Road in Dallas. It accepts Medicare, Medicaid, and private pay, giving families many ways to fund short-term rehabilitation and ongoing nursing care. With a 97 percent occupancy rate, the 44-bed community operated by Highland Springs, Inc., tends to run nearly full. The average stay is around 127 days. This denotes a mix of rehabilitation occupants and those requiring longer-term skilled nursing care.
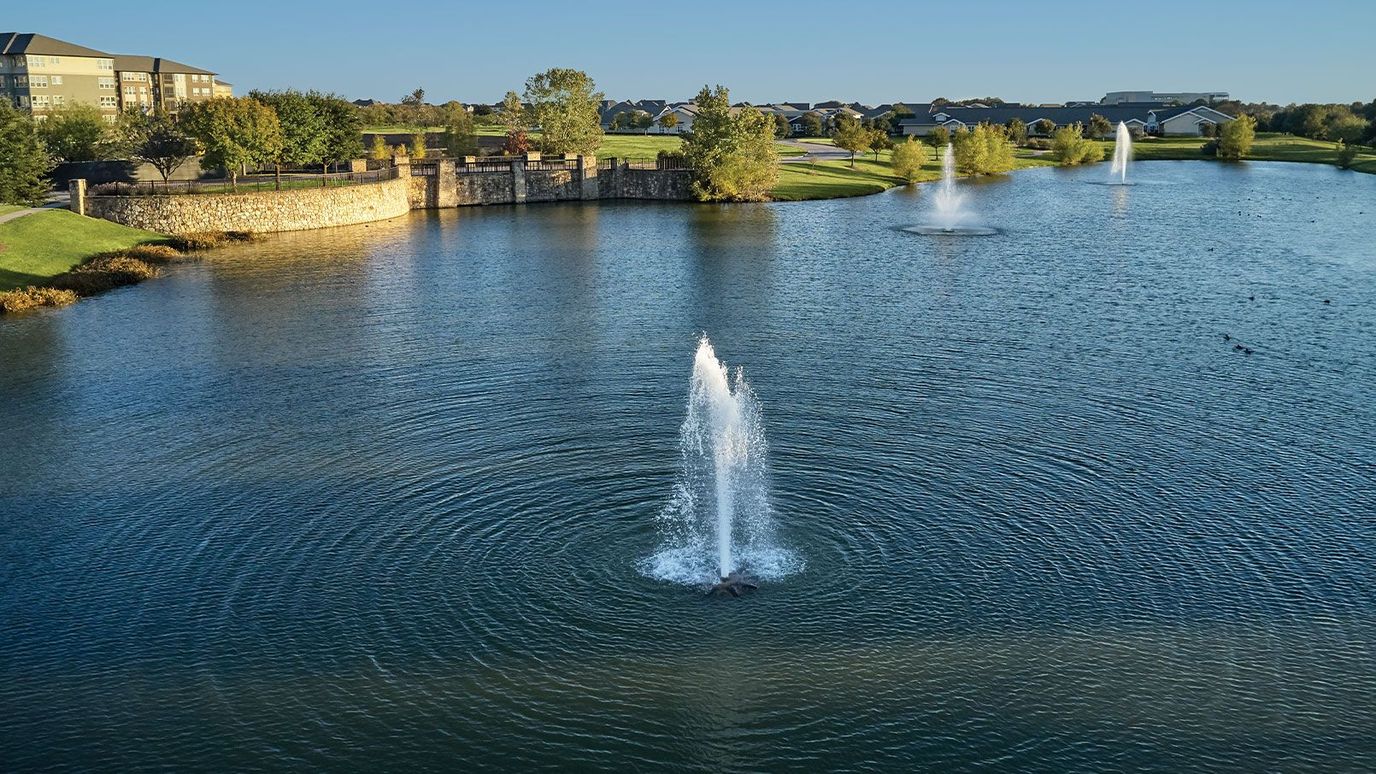
Substantial is daily nursing support, averaging 5 hours 16 minutes of total nursing care per resident day. This includes registered nurses adding roughly 1 hour 3 minutes daily, nurse aides providing 2 hours 29 minutes, and licensed practical nurses or vocational nurses contributing 40 minutes. That level of attentive support is beneficial for people healing from hospital stays or managing complex medical needs. The facility offers rehabilitation services alongside general nursing care, making it well-positioned for post-acute patients needing therapy during recovery. The immediate neighborhood has a Walk Score of 60, so some errands are walkable, though most trips need a brief drive. The location is reasonably accessible for visiting families. Daily amenities span fitness facilities, aquatic spaces, and scenic walking trails, supporting activity and wellness for occupants.
Inspections have centered on building and environmental compliance, specifically fire safety systems, electrical standards, and secured outdoor areas. These are vital infrastructure and safety matters that families can ask about when touring.
88-bed community Rank #710 / 972Bed count — State benchmarkedThis home is ranked 710th out of 972 homes in Texas for bed count. Shows this facility's certified or reported bed count compared to other Texas facilities. Larger communities may offer more amenities, programs, and on-site services for residents and families.Facilities with the same value for a metric share the same rank. Rankings are based only on facilities in Texas that report data for that category. Facilities without available data are excluded from the ranking.Click the rank badge to see the full State ranking.Click here to see the full State ranking.
A larger shared setting that may offer more common spaces and organized community services.
Walk Score: 60 / 100 Rank #291 / 1389Walk Score — State benchmarkedThis home is ranked 291st out of 1389 homes in Texas for walk score. Shows how walkable this facility's neighborhood is compared to the average walk score across Texas facilities. Higher scores benefit residents, families, and staff.Facilities with the same value for a metric share the same rank. Rankings are based only on facilities in Texas that report data for that category. Facilities without available data are excluded from the ranking.Click the rank badge to see the full State ranking.Click here to see the full State ranking.
Moderately walkable. Some errands can be accomplished on foot, with a mix of nearby amenities.
About this community
Facility TypeType B
StatusEnforcement Action Pend
CountyCollin
CMS Certification Number676329
QualificationNursing
Continuing Care at Highland Springs is legally operated by Highland Springs, Inc.
OwnerHighland Springs, Inc
Owner NameHighland Springs, Inc
Rehabilitation Services
Nursing Services
Minimum Age62
Fitness Center
Walking Paths
Specific ProgramsHealth Services, Medical Center
Inspection History
In Texas, the Health and Human Services Commission (HHSC) is the primary regulatory body that conducts unannounced inspections and publishes quality reports for all long-term care homes.
Since 2025 · 1 year of data
11 citations
1 inspection
Inspection Scorecard
 This scorecard compares key inspection, citation, and complaint metrics at this facility against the Texas state average. Metrics rated ≥15% worse than average are highlighted in red; those ≥15% better are highlighted in green.
Since 2025 vs. Texas state average
Overall vs. TX average
4 Worse
Metrics worse than Texas average:
• Total citations (83% above)
• Health citations (100% above)
• Life safety citations (17% above)
• Inspections with citations (100% above) 0 Better No metrics in this bucket.
• Total citations (83% above)
• Health citations (100% above)
• Life safety citations (17% above)
• Inspections with citations (100% above) 0 Better No metrics in this bucket.
Citations
| This Facility | TX Average | vs. TX Avg |
|---|---|---|---|
|
Total citations
| 11 | 6 | This facility has 83% more total citations than a typical Texas assisted living residence (11 vs. TX avg 6).↑ 83% worse |
|
Health citations
| 4 | 2 | This facility has 100% more health citations than a typical Texas assisted living residence (4 vs. TX avg 2).↑ 100% worse |
|
Life safety citations
| 7 | 6 | This facility has 17% more life safety citations than a typical Texas assisted living residence (7 vs. TX avg 6).↑ 17% worse |
Inspections
| This Facility | TX Average | vs. TX Avg |
|---|---|---|---|
|
Inspections with citations
| 2 | 1 | This facility has 100% more inspections with citations than a typical Texas assisted living residence (2 vs. TX avg 1).↑ 100% worse |
What does this home offer?
Pets Allowed
Places of interest near Continuing Care at Highland Springs
![]() 7910 Frankford Road, Dallas, TX 75252
7910 Frankford Road, Dallas, TX 75252
Calculate Travel Distance to Continuing Care at Highland Springs
Add your location
Compare Assisted Living around Dallas
Info below is compiled from the TX Health & Human Services Commission (HHSC), senior community websites & trusted data sources such as Walk Score & BBB.
Communities are listed from highest to lowest based on our ranking methodology.
| The Legacy Midtown Park | AL HOS IL MC NH SNF | Dallas (Vickery Meadow) | 98
Facility
98
TX AVG
79
Rank
#367 / 972 | Yes |
45
Facility
45
TX AVG
41
Rank
#626 / 1389 | 5
Facility
5
TX AVG
21
Rank
#528 / 585 | - | The Legacy Midtown Park, Inc | 1
Facility
1
TX AVG
6
Rank
#152 / 823 | - | 1 | - | Studio / 1 Bed / 2 Bed |
| Continuing Care at Highland Springs | AL IL MC | Dallas (Far North Dallas) | 88
Facility
88
TX AVG
79
Rank
#710 / 972 | Yes |
60
Facility
60
TX AVG
41
Rank
#291 / 1389 | - | - | Highland Springs, Inc | 11
Facility
11
TX AVG
6
Rank
#708 / 823 | - | 4 | 7 | - |
| Presbyterian Village North | AL IL MC NH RC SNF | Dallas (Lake Highlands) | 88
Facility
88
TX AVG
79
Rank
#429 / 972 | No |
61
Facility
61
TX AVG
41
Rank
#267 / 1389 | 19
Facility
19
TX AVG
21
Rank
#229 / 585 | - | - | 17
Facility
17
TX AVG
6
Rank
#1 / 823 | 1.3 | - | - | - |
| C C Young Memorial Home | AL HC HOS IL MC NH PC SNF | Dallas | 55
Facility
55
TX AVG
79
Rank
#140 / 972 | No |
20
Facility
20
TX AVG
41
Rank
#1092 / 1389 | - | - | C. C. Young Memorial Home | 6
Facility
6
TX AVG
6
Rank
#399 / 823 | - | 4 | 2 | - |
| Autumn Leaves | AL | Dallas | -
Facility
-
TX AVG
79
Rank
#174 / 972 | No |
58
Facility
58
TX AVG
41
Rank
#326 / 1389 | 18
Facility
18
TX AVG
21
Rank
#257 / 585 | B- | Lcs-Al LLC | 12
Facility
12
TX AVG
6
Rank
#722 / 823 | - | 1 | 11 | - |
Financial Assistance for
Assisted Living in Texas
Continuing Care at Highland Springs is located in DALLAS, Texas.
Here are the financial assistance programs available to residents in Texas.
Frequently Asked Questions about Continuing Care at Highland Springs
What neighborhood is Continuing Care at Highland Springs in?
Continuing Care at Highland Springs is in the Far North Dallas neighborhood of DALLAS.
Who is the owner of Continuing Care at Highland Springs?
Continuing Care at Highland Springs is legally operated by Highland Springs, Inc.
Is Continuing Care at Highland Springs in a walkable area?
Continuing Care at Highland Springs has a walk score of 60. Moderately walkable. Some errands can be accomplished on foot, with a mix of nearby amenities.
Are pets allowed at Continuing Care at Highland Springs?
Yes, Continuing Care at Highland Springs allows residents to bring their pets.
How many beds does Continuing Care at Highland Springs have?
Continuing Care at Highland Springs has 88 beds.
Has Continuing Care at Highland Springs had any citations?
Continuing Care at Highland Springs has had 11 reported citations since 2025 according to records from Texas Health and Human Services (HHSC).
Are there photos of Continuing Care at Highland Springs?
Yes — there are 7 photos of Continuing Care at Highland Springs in the photo gallery on this page.
Guides for Better Senior Living
Care Cost Calculator: See Prices in Your Area
Assisted Living Explorer
Don’t Wait Too Long: 7 Red Flag Signs Your Parent Needs Assisted Living Now
The True Cost of Assisted Living in 2025 – And How Families Are Paying For It
Understanding Senior Living Costs: Pricing Models, Discounts & Financial Assistance
Updated on
