Autumn Leaves
Nursing Home & Assisted Living · Dallas, TX
CMS overall rating Info CMS (the Centers for Medicare & Medicaid Services) is the federal agency that rates nursing home quality. Its Overall Rating runs from 1 to 5 stars, combining health inspections, staffing, and quality measures, with inspections weighted most heavily.

Autumn Leaves

Nursing Home & Assisted Living · Dallas, TX
CMS overall rating Info CMS (the Centers for Medicare & Medicaid Services) is the federal agency that rates nursing home quality. Its Overall Rating runs from 1 to 5 stars, combining health inspections, staffing, and quality measures, with inspections weighted most heavily.
Calculator: See prices in your area
Autumn Leaves accepts Medicaid, Medicare, and private pay.

Overview of Autumn Leaves

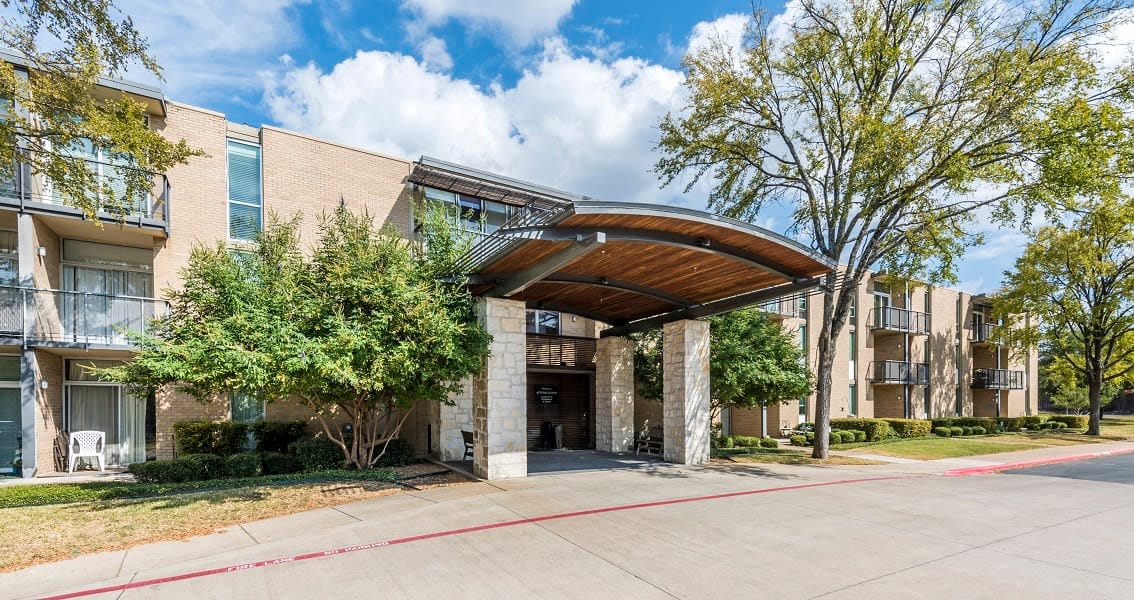
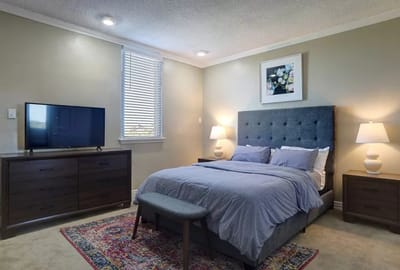
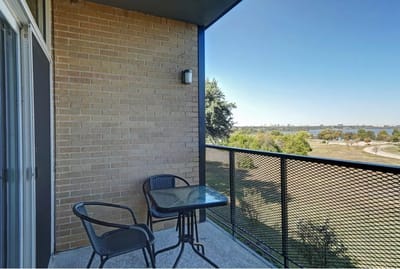
Autumn Leaves in Dallas, Texas is a place where one can enjoy the beauty of nature, the fresh air of brisk days, and the warmth of cozy nights. The community is committed to empowering its residents and providing them with a fulfilling life. They have partnered with Life Care Services to offer affordable retirement options that cater to various levels of care, including independent living, assisted living, senior rehabilitation, and skilled nursing.
At Autumn Leaves, residents can expect a lifestyle-centered experience that encompasses their passions and interests. Whether it’s socializing with friends, engaging in activities, or pursuing hobbies, there’s always something to do. Autumn Leaves is a place where residents can truly embrace each day as it comes.

Quality ratings

Measured by Centers for Medicare & Medicaid Services (CMS)

Overall rating Info The Overall CMS Rating combines results from health inspections, staffing levels and quality measures. Health inspections carry the most weight. Staffing and quality scores can increase or decrease the final rating based on performance compared to state and national standards.
▲ 78.9% Above TX avg. ▲ 78.9% Above TX avg.TX average: 2.8Click the badge to see the full State ranking.Click here to see the full State ranking.
Health Inspection Info Based on the results of the facility's three most recent standard inspections and any complaint investigations. CMS reviews the number, scope, and severity of deficiencies, with more recent findings weighted more heavily.
▲ 80.9% Above TX avg. ▲ 80.9% Above TX avg.TX average: 2.8Click the badge to see the full State ranking.Click here to see the full State ranking.
Staffing Info Measures average nursing staff hours per resident per day, including Registered Nurses (RNs) and total nursing staff. Ratings are adjusted based on the level of care residents require and are compared to state and national benchmarks.
▲ 88.5% Above TX avg. ▲ 88.5% Above TX avg.TX average: 2.1Click the badge to see the full State ranking.Click here to see the full State ranking.
Quality Measures Info Based on clinical and physical health indicators reported to CMS, such as hospital readmissions, falls, pressure ulcers, and improvements in mobility. These measures reflect how well residents' health needs are being managed.
▲ 33.2% Above TX avg. ▲ 33.2% Above TX avg.TX average: 3.8Click the badge to see the full State ranking.Click here to see the full State ranking.

Staffing hours breakdown

Info Daily nursing hours per resident by staff type, reported to CMS. Higher is generally better — compare this facility to state and national averages to see where staffing stands.

Hours per resident per day — compared to Texas state averages

Total nursing care / resident Info This home is ranked 66th out of 296 homes in Texas for nurse hours. Total adjusted nursing hours per resident per day, combining RN, LPN, and aide time. CMS adjusts this for case-mix so facilities can be fairly compared.
4h 3m per day
Rank #66 / 296Nurse hours — State benchmarkedThis home is ranked 66th out of 296 homes in Texas. Shows adjusted nurse hours per resident per day benchmarked to the Texas average, with a ranking across 296 Texas facilities. More hours mean more direct care. The national average is about 3.5 hrs; below 3.0 is a red flag.Rankings are based only on facilities in Texas that report data for that category. Facilities without available data are excluded from the ranking.Click the rank badge to see the full State ranking.Click here to see the full State ranking.
This facility Texas avg (3h 38m per day)
vs Texas avg
+12%

0 of 1 metrics below state avg

Standout metric Weekend Total Nursing is +8% above state avg
Staff typeHours / Day / Residentvs state avg
Weekend Total Nursing Info Combined nursing hours (RN + LPN + Nurse Aide) per resident per day on weekends. Staffing often drops on weekends — this figure reveals whether the facility maintains adequate coverage outside of weekday hours. 3h 14m per day ▲ 8% State avg: 3h 0m per day · National avg: 3h 27m per day

Capacity and availability

This home usually has availability

Lower occupancy than the Texas average: 63.5%
Occupancy rate
51.4% Rank #244 / 304Occupancy rate — State benchmarkedThis home is ranked 244th out of 304 homes in Texas. Shows this facility's occupancy rate versus the Texas average, with its Statewide rank out of 304. Higher occupancy signals strong local demand and financial stability.Rankings are based only on facilities in Texas that report data for that category. Facilities without available data are excluded from the ranking.Click the rank badge to see the full State ranking.Click here to see the full State ranking.
Avg. Length of Stay
89 days
Years in operation
17 years in operation Rank #283 / 583Years in operation — State benchmarkedThis home is ranked 283rd out of 583 homes in Texas. Shows how long this facility has been in operation compared to other Texas facilities. Longer operating histories may benefit residents, families, and staff.Rankings are based only on facilities in Texas that report data for that category. Facilities without available data are excluded from the ranking.Click the rank badge to see the full State ranking.Click here to see the full State ranking.
A community with a solid operating history and experience delivering ongoing care.
Walk Score
Walk Score: 58 / 100 Rank #328 / 1391Walk Score — State benchmarkedThis home is ranked 328th out of 1391 homes in Texas. Shows how walkable this facility's neighborhood is compared to the average Walk Score across Texas facilities. Higher scores benefit residents, families, and staff.Rankings are based only on facilities in Texas that report data for that category. Facilities without available data are excluded from the ranking.Click the rank badge to see the full State ranking.Click here to see the full State ranking.
Moderately walkable. Some errands can be accomplished on foot, with a mix of nearby amenities.
BBB Rating
BBB Rating: B- (Not Accredited)
An independent rating from the Better Business Bureau based on factors such as complaint history, transparency, and business practices.
How BBB ratings work

About this community

License Details

Facility TypeType B
StatusClosed
County1010 Emerald Isle Dr
QualificationNursing

Ownership & Operating Entity

Autumn Leaves is legally operated by Lcs-Al Llc.

OwnerLCS-AL LLC

Memory & Specialized Care

1 service
No Alzheimer's certification

Contact Autumn Leaves

Inspection History

In Texas, the Health and Human Services Commission (HHSC) is the primary regulatory body that conducts unannounced inspections and publishes quality reports for all long-term care homes.

Since 2024 · 2 years of data 12 citations 2 inspections

Inspection Scorecard Info This scorecard compares key inspection, citation, and complaint metrics at this facility against the Texas state average. Metrics rated ≥15% worse than average are highlighted in red; those ≥15% better are highlighted in green.

Since 2024 vs. Texas state average
Overall vs. TX average 4 Worse Metrics worse than Texas average:
• Total citations (100% above)
• Life safety citations (83% above)
• Citations per year (100% above)
• Inspections with citations (100% above)
1 Better Metrics better than Texas average:
• Health citations (50% below)
Latest Inspection June 13, 2024 Other An inspection that falls outside standard annual surveys and formal complaint investigations. May include administrative compliance checks, documentation reviews, focused surveys on specific concerns, or revisit surveys to verify prior corrections.

Citations Info Citations are formal regulatory issues recorded during state inspections.

This FacilityTX Averagevs. TX Avg
Total citations Info Formal regulatory issues recorded by inspectors across all inspection types. 126 This facility has 100% more total citations than a typical Texas nursing home (12 vs. TX avg 6).↑ 100% worse
Health citations Info Citations related to resident care, clinical practices, and day-to-day operations. 12 This facility has 50% fewer health citations than a typical Texas nursing home (1 vs. TX avg 2).↓ 50% better
Life safety citations Info Citations related to building safety — fire prevention, emergency egress, and similar. 116 This facility has 83% more life safety citations than a typical Texas nursing home (11 vs. TX avg 6).↑ 83% worse
Citations per year Info Average citations per year since 2024. 63 This facility has 100% more citations per year than a typical Texas nursing home (6 vs. TX avg 3).↑ 100% worse

Inspections Info State inspections evaluate whether the facility meets health and safety standards.

This FacilityTX Averagevs. TX Avg
Inspections with citations Info Inspections that resulted in at least one regulatory citation. 21 This facility has 100% more inspections with citations than a typical Texas nursing home (2 vs. TX avg 1).↑ 100% worse

Inspection Reports Summary Info An editor-reviewed summary of the themes and findings across this facility's recent inspection reports.

  • June 12-13, 2024 inspection found 12 deficiencies including food safety violations and multiple failures to meet Life Safety Code requirements for fire alarms, sprinklers, emergency power, and smoke barriers.
  • All cited violations from the June 2024 inspections were corrected within one to two months after the survey.
  • Deficiencies focused heavily on fire safety system maintenance, emergency lighting testing, and environmental cleanliness, indicating recurring issues with facility infrastructure compliance.

Staffing Data

Reporting period: July 1 – September 30, 2025 (Q3 2025). Source: CMS Payroll-Based Journal report.

Total staff 29
Employees 27
Contractors 2
Staff to resident ratio 1.07 : 1
27% fewer staff per resident than Texas average
Texas average ratio: 1.48 : 1 Texas average ratio: 1.48 : 1See full Texas ranking
Avg staff/day 13
Average shift 8.4 hours
0% compared with Texas average
Texas average: 8.1 hours Texas average shift: 8.1 hoursSee full Texas ranking
Total staff hours (quarter) 3,260

Nursing staff breakdown

Q3 2025 · Jul 1 – Sep 30 More info This data comes from the CMS Payroll-Based Journal report covering July 1 – September 30, 2025.
Registered Nurse

Manages medical care and health needs.

RN Staff Info All 3 RN Staff are full-time employees. No contractors work on this role. 3
Average shift length Info Average shift length. Calculated as total hours divided by days worked and average staff per day. 8.8 hours
Licensed Practical Nurse

Assists with medical care and medications.

LPN Staff Info 6 total: 5 full-time employees and 1 contractor. 6
Average shift length Info Average shift length. Calculated as total hours divided by days worked and average staff per day. 10.3 hours
Certified Nursing Assistant

Helps with daily care and mobility.

CNA Staff Info All 11 CNA Staff are full-time employees. No contractors work on this role. 11
Average shift length Info Average shift length. Calculated as total hours divided by days worked and average staff per day. 8.6 hours

Contractor staffing

Q3 2025 · Jul 1 – Sep 30 More info This data comes from the CMS Payroll-Based Journal report covering July 1 – September 30, 2025.

Total hours from contractors

0.7%

22 contractor hours this quarter

Licensed Practical Nurse: 1 Medical Director: 1

Staff by category

Q3 2025 · Jul 1 – Sep 30 More info This data comes from the CMS Payroll-Based Journal report covering July 1 – September 30, 2025.
Certified Nursing Assistant110111,38630100%8.6
Licensed Practical Nurse51677530100%10.3
Respiratory Therapy Technician3032341653%6.1
Registered Nurse3032202067%8.8
Nurse Practitioner1011762273%8
Dental Services Staff1011711963%9
Administrator1011441860%8
Speech Language Pathologist1011131550%7.5
Clinical Nurse Specialist10132413%8
Medical Director01110620%1.7
11 Certified Nursing Assistant
% of Days 100%
6 Licensed Practical Nurse
% of Days 100%
3 Respiratory Therapy Technician
% of Days 53%
3 Registered Nurse
% of Days 67%
1 Nurse Practitioner
% of Days 73%
1 Dental Services Staff
% of Days 63%
1 Administrator
% of Days 60%
1 Speech Language Pathologist
% of Days 50%
1 Clinical Nurse Specialist
% of Days 13%
1 Medical Director
% of Days 20%

Penalties and fines

Federal penalties imposed by CMS for regulatory violations, including civil money penalties (fines) and denials of payment for new Medicare/Medicaid admissions.

Source: CMS Penalties Database

No penalties in the past 3 years

No civil money penalties or payment denials were reported in the last 3 years.

Breakdown by payment type

Medicare

35% of new residents, usually for short-term rehab.

Typical stay 1 months

Private pay

60% of new residents, often for short stays.

Typical stay 6 - 7 months

Medicaid

5% of new residents, often for long-term daily care.

Typical stay 1 - 2 years

Facility Characteristics

Source: CMS Long-Term Care Facility Characteristics (Data as of Jan 2026)

Total residents 27
Medicare
5
18.5% of residents
Medicaid
9
33.3% of residents
Private pay or other
13
48.1% of residents
Programs & Services
Residents Group

Residents meet regularly to discuss policies, care quality, and activities

Nurse Aide Training

State-approved Nurse Aide Training and Competency Evaluation Program on-site

CCRC

Part of a Continuing Care Retirement Community offering multiple care levels

Active Resident Council

Organized group of residents that meets regularly to discuss facility policies, quality of life, and activities.

Finances and operations

Based on CMS SNF Cost Report for fiscal year ending in 12/2023.

For-profit
LLC
Net patient revenue Info Net patient revenue — what the home actually collects for resident care, after contractual allowances, bad debt and discounts are subtracted from its gross charges (CMS cost report, Worksheet G-3). It covers resident care only; money the home earns from other sources is shown separately as "Other income."
$3.4M
Net patient income Info Net patient income: net patient revenue minus the home's total operating expenses. A positive figure means it earns more from resident care than it spends to deliver it; a negative figure means the opposite. It excludes non-operating "other income."
-$4.5M
For-profit LLC
Net patient revenue Info Net patient revenue — what the home actually collects for resident care, after contractual allowances, bad debt and discounts are subtracted from its gross charges (CMS cost report, Worksheet G-3). It covers resident care only; money the home earns from other sources is shown separately as "Other income."
$3.4M Rank #261 / 304Revenue — State benchmarkedThis home is ranked 261st out of 304 homes in Texas. Shows this facility's annual revenue compared to the Texas average. Higher revenue generally means more resources for staffing and capital — read alongside Payroll %.Rankings are based only on facilities in Texas that report data for that category. Facilities without available data are excluded from the ranking.Click the rank badge to see the full State ranking.Click here to see the full State ranking.
Net patient income Info Net patient income: net patient revenue minus the home's total operating expenses. A positive figure means it earns more from resident care than it spends to deliver it; a negative figure means the opposite. It excludes non-operating "other income."
-$4.5M
Other income Info Money the home earns outside of resident care — such as investments, grants, rentals and other non-operating sources (CMS cost report, Worksheet G-3). It is tracked separately from net patient revenue: it is not part of that figure, and it is not included in net patient income.
$1.3M
Payroll costs Info Staff salaries plus wage-related costs — benefits such as payroll taxes, health insurance and retirement — from the home's own accounting records (CMS cost report, Worksheet A). Contract or agency labor is counted separately, under other operating costs. Rank #238 / 304Payroll — State benchmarkedThis home is ranked 238th out of 304 homes in Texas. Shows total annual staff payroll benchmarked to the Texas average. Higher payroll investment relative to peers often signals better staffing and less reliance on cheaper contract labor.Rankings are based only on facilities in Texas that report data for that category. Facilities without available data are excluded from the ranking.Click the rank badge to see the full State ranking.Click here to see the full State ranking.
$3.4M 100.5% of net patient revenue Info Payroll as a share of revenue: staff salaries and wage-related benefits divided by net patient revenue. A higher figure means more of each revenue dollar goes to staff pay. Rank #65 / 304Payroll % — State benchmarkedThis home is ranked 65th out of 304 homes in Texas. Shows payroll as a percentage of revenue versus the Texas average. Well-run Texas facilities typically land around 51–63% — the top third Statewide. Below 25% may signal understaffing or heavy agency use — read with Staffing ratings.Rankings are based only on facilities in Texas that report data for that category. Facilities without available data are excluded from the ranking.Click the rank badge to see the full State ranking.Click here to see the full State ranking.
Other operating costs Info Everything it costs to run the home apart from payroll — food, utilities, supplies, maintenance, contract labor and administration. Calculated as total operating expense minus payroll (staff salaries and wage-related benefits).
$4.5M
Total costs Info The home's total operating expense for the year — all the costs of running it, salaries included (CMS cost report, Worksheet G-3).
$7.9M

Who this home usually serves

TYPE OF STAY

Primarily short stays

Residents typically stay for brief periods, with frequent admissions and discharges throughout the year.

Most new residents arrive under private pay (60% of admissions), and a typical private pay stay runs around 6 - 7 months.

Admissions
146 total

Coverage residents most often arrive under.

Medicare 35%
Private pay 60%
Medicaid 5%
Discharges
142 total

Coverage residents most often leave under.

Medicare 32%
Private pay 63%
Medicaid 4%

Places of interest near Autumn Leaves

Address 6.2 miles from city center Info Estimated distance in miles from Dallas's city center to Autumn Leaves's address, calculated via Google Maps. — 4.66 miles to nearest hospital (Texas Health Presbyterian Hospital Dallas)

Calculate Travel Distance to Autumn Leaves

Add your location

Address

Compare Nursing Homes around Dallas

The information below is reported by the Texas Health and Human Services Commission.

5 facilities compared · CMS & TX Dept. of Health data

The Legacy Midtown Park
NH
AL
HC
IL
MC
Dallas (Vickery Meadow)
98
Facility 98
TX AVG 80
Rank #376 / 988
87.5%
Facility 87.5%
TX AVG 63.5%
Rank #31 / 304
+38%
5.42
Facility 5.42
TX AVG 3.63
Rank #14 / 296
+1%+49%
$27.5k
Facility $27.5k
TX AVG $81.8k
Rank #168 / 301
4
Facility 4
TX AVG 25.9
Rank #2 / 299
1.3
Facility 1.3
TX AVG 3.7
Rank #2 / 299
-48-
45
Facility 45
TX AVG 41
Rank #628 / 1391
The Legacy Midtown Park Inc
$16.1M
Facility $16.1M
TX AVG $8.4M
Rank #9 / 304
$15.0M
Facility $15.0M
TX AVG $3.5M
Rank #9 / 304
93%
Facility 93%
TX AVG 47%
Rank #214 / 304
676489
Autumn Leaves
NH
AL
Dallas
124
Facility 124
TX AVG 80
Rank #178 / 988
51.4%
Facility 51.4%
TX AVG 63.5%
Rank #244 / 304
-19%
4.05
Facility 4.05
TX AVG 3.63
Rank #66 / 296
+35%+12%
$0
Facility $0
TX AVG $81.8k
Rank #1 / 301
---29B-
58
Facility 58
TX AVG 41
Rank #328 / 1391
Lcs Al Operator Mm LLC
$3.4M
Facility $3.4M
TX AVG $8.4M
Rank #261 / 304
$3.4M
Facility $3.4M
TX AVG $3.5M
Rank #238 / 304
100.5%
Facility 100.5%
TX AVG 47%
Rank #65 / 304
675830
Presbyterian Village North
NH
AL
IL
MC
RC
Dallas (Lake Highlands)
88
Facility 88
TX AVG 80
Rank #441 / 988
31.1%
Facility 31.1%
TX AVG 63.5%
Rank #282 / 304
-51%
4.80
Facility 4.80
TX AVG 3.63
Rank #26 / 296
+20%+32%
$36.5k
Facility $36.5k
TX AVG $81.8k
Rank #189 / 301
18
Facility 18
TX AVG 25.9
Rank #103 / 299
2.3
Facility 2.3
TX AVG 3.7
Rank #48 / 299
269-
61
Facility 61
TX AVG 41
Rank #269 / 1391
Dustin Allen
$11.4M
Facility $11.4M
TX AVG $8.4M
Rank #5 / 304
$20.1M
Facility $20.1M
TX AVG $3.5M
Rank #4 / 304
176.3%
Facility 176.3%
TX AVG 47%
Rank #229 / 304
676135
Christian Care Communities and Services – Mesquite
NH
AL
IL
MC
RC
Mesquite
180
Facility 180
TX AVG 80
Rank #26 / 988
40.3%
Facility 40.3%
TX AVG 63.5%
Rank #273 / 304
-36%
3.66
Facility 3.66
TX AVG 3.63
Rank #111 / 296
+32%+1%
$28.9k
Facility $28.9k
TX AVG $81.8k
Rank #170 / 301
16
Facility 16
TX AVG 25.9
Rank #76 / 299
1.6
Facility 1.6
TX AVG 3.7
Rank #7 / 299
4100-
31
Facility 31
TX AVG 41
Rank #914 / 1391
Ccc Mesquite Management LLC
$8.4M
Facility $8.4M
TX AVG $8.4M
Rank #24 / 304
$11.6M
Facility $11.6M
TX AVG $3.5M
Rank #13 / 304
137.7%
Facility 137.7%
TX AVG 47%
Rank #61 / 304
455617
Walnut Place Dallas
NH
AL
Dallas (Vickery Meadow)
100
Facility 100
TX AVG 80
Rank #363 / 988
46.1%
Facility 46.1%
TX AVG 63.5%
Rank #258 / 304
-27%
3.91
Facility 3.91
TX AVG 3.63
Rank #81 / 296
-32%+8%
$20.5k
Facility $20.5k
TX AVG $81.8k
Rank #137 / 301
21
Facility 21
TX AVG 25.9
Rank #152 / 299
3.5
Facility 3.5
TX AVG 3.7
Rank #178 / 299
262-
54
Facility 54
TX AVG 41
Rank #409 / 1391
Lcs Wp Operator Mm LLC
$13.2M
Facility $13.2M
TX AVG $8.4M
Rank #46 / 304
$9.2M
Facility $9.2M
TX AVG $3.5M
Rank #21 / 304
69.4%
Facility 69.4%
TX AVG 47%
Rank #54 / 304
675765

Financial Assistance for
Nursing Home in Texas

Autumn Leaves is located in Dallas, Texas.
Here are the financial assistance programs available to residents in Texas.

Get Financial aid guidance

Community Care for the Aged and Disabled (CCAD)

TX Medicaid CCAD

Age 65+ or disabled
General Texas resident, Medicaid-eligible, care need (not always nursing home level).
Income Limits (2025) ~$2,829/month 300% FBR, individual
Asset Limits $2,000 (individual), $3,000 (couple).
TX

Large state; rural access challenges.

Benefits
Personal care (5-7 hours/day) Respite (240 hours/year) Adult day care (~$60/day) Home aides

Texas Community Care Services

TX CCS

Age 60+
General Texas resident, at risk of decline.
Income Limits ~$2,000/month individual, varies
Asset Limits $5,000 individual
TX

Limited funding; high demand in urban areas.

Benefits
In-home care (3-5 hours/week) Respite (up to 10 days/year) Transportation (~5 trips/month)

Area Agency on Aging (AAA) Services

Texas AAA Services

Age 60+
General TX resident; no income/asset limits.
Income Limits (2025) None; donations encouraged.
Asset Limits Not assessed.
TX

28 AAAs; includes Meals on Wheels in some areas.

Benefits
Meals (~$5-$7/meal) Transportation Homemaker services (~4 hours/week) Respite (~5 days/year) Legal aid

Medicare Savings Program (MSP)

Texas Medicare Savings Program

Age 65+ or disabled
General TX resident, Medicare Part A/B.
Income Limits (2025) ~$2,510/month (QMB), ~$3,380/month (SLMB), ~$3,598/month (QI)—individual.
Asset Limits $9,430 (individual), $14,130 (couple).
TX

Includes Extra Help for Part D; no waitlist.

Benefits
Covers Part B premiums ($174.70/month) Deductibles ($240/year) Copays (~20%)

Family Caregiver Support Program (FCSP)

Texas Family Caregiver Support Program

Age
General Caregivers of 60+ needing care or 55+ caregivers of others; TX resident; 2+ ADLs.
Income Limits (2025) No strict cap; prioritizes low-income ~$24,980/year
Asset Limits Not assessed.
TX

High rural demand; includes grandparent caregivers.

Benefits
Respite (4-6 hours/week or 5 days/year) Adult day care ($60/day) Training Supplies (~$500/year)

VA Aid and Attendance (A&A) and Housebound Benefits

Texas VA Aid and Attendance/Housebound

Age 65+ or disabled veteran/spouse
General TX resident, wartime service, ADL help (A&A) or homebound.
Income Limits (2025) Net income < ~$1,984/month (veteran with dependent, A&A); pension offsets income.
Asset Limits ~$155,356 net worth
TX

High veteran population; supports rural/urban needs.

Benefits
Cash (~$1,433-$2,642/month veteran, ~$951-$1,318 spouse) for care costs

Property Tax Exemption for Seniors

Texas Senior Property Tax Exemption

Age 65+
General TX resident, homeowner (homestead).
Income Limits (2025) None; tax-based eligibility.
Asset Limits Not assessed.
TX

$25,000+ exemption; optional freeze in some counties; saves ~$500-$1,000/year.

Benefits
Tax exemption or freeze (~$500-$1,000/year savings)

Senior Farmers’ Market Nutrition Program (SFMNP)

Texas SFMNP

Age 60+
General TX resident, low-income.
Income Limits (2025) ~$2,322/month 185% FPL
Asset Limits Not assessed.
TX

Vouchers (~$50/season); serves ~20,000 via 28 AAAs.

Benefits
Vouchers (~$50/season) for produce at farmers’ markets

Frequently Asked Questions about Autumn Leaves

Who is the owner of Autumn Leaves?

Autumn Leaves is legally operated by Lcs-Al Llc.

Is Autumn Leaves in a walkable area?

Autumn Leaves has a walk score of 58. Moderately walkable. Some errands can be accomplished on foot, with a mix of nearby amenities.

What is the occupancy rate at Autumn Leaves?

Autumn Leaves's occupancy is 51.4%.

Does Autumn Leaves operate as a for-profit or non-profit?

Autumn Leaves is registered as a for-profit in TX.

Has Autumn Leaves had any recent citations?

Autumn Leaves has had 12 recently reported citations.

Are there photos of Autumn Leaves?

Yes — there are 6 photos of Autumn Leaves in the photo gallery on this page.

What is the address of Autumn Leaves?

Autumn Leaves is located at 1010 Emerald Isle Dr, Dallas, TX 75218.

Guides for Better Senior Living

Care Cost Calculator: See Prices in Your Area

Nursing Home Data Explorer

Don’t Wait Too Long: 7 Red Flag Signs Your Parent Needs Assisted Living Now

The True Cost of Assisted Living in 2025 – And How Families Are Paying For It

Understanding Senior Living Costs: Pricing Models, Discounts & Financial Assistance