Cooper River Post Acute
Nursing Home · Mount Pleasant, SC
CMS overall rating Info The Overall CMS Rating is scored from 1 to 5 stars and combines results from health inspections, staffing levels, and quality measures. Health inspections carry the most weight. Staffing and quality scores can increase or decrease the final rating based on performance compared to state and national standards.

Cooper River Post Acute

Nursing Home · Mount Pleasant, SC
CMS overall rating Info The Overall CMS Rating is scored from 1 to 5 stars and combines results from health inspections, staffing levels, and quality measures. Health inspections carry the most weight. Staffing and quality scores can increase or decrease the final rating based on performance compared to state and national standards.
Calculator: See prices in your area
Cooper River Post Acute accepts Medicare, Medicaid, and private pay.

Overview of Cooper River Post Acute

Cooper River Post Acute is a patient-centered short-term rehabilitation and skilled nursing facility in Mount Pleasant, SC. It has been serving the community for over 40 years and offers a range of rehabilitation services. The facility features a certified in-house therapy team and a variety of engaging daily activities.

Quality ratings

Measured by Centers for Medicare & Medicaid Services (CMS)

Overall rating Info The Overall CMS Rating combines results from health inspections, staffing levels and quality measures. Health inspections carry the most weight. Staffing and quality scores can increase or decrease the final rating based on performance compared to state and national standards.
▼ 65.9% Below SC avg. ▼ 65.9% Below SC avg.Click the badge to see the full State ranking.Click here to see the full State ranking.
Health Inspection Info Based on the results of the facility's three most recent standard inspections and any complaint investigations. CMS reviews the number, scope, and severity of deficiencies, with more recent findings weighted more heavily.
▼ 63.6% Below SC avg. ▼ 63.6% Below SC avg.Click the badge to see the full State ranking.Click here to see the full State ranking.
Staffing Info Measures average nursing staff hours per resident per day, including Registered Nurses (RNs) and total nursing staff. Ratings are adjusted based on the level of care residents require and are compared to state and national benchmarks.
▼ 32.2% Below SC avg. ▼ 32.2% Below SC avg.Click the badge to see the full State ranking.Click here to see the full State ranking.

Staffing hours breakdown

Info Daily nursing hours per resident by staff type, reported to CMS. Higher is generally better — compare this facility to state and national averages to see where staffing stands.

Hours per resident per day — compared to South Carolina state averages

Total nursing care / resident Info This home is ranked 95th out of 112 homes in South Carolina. Total adjusted nursing hours per resident per day, combining RN, LPN, and aide time. CMS adjusts this for case-mix so facilities can be fairly compared.
3h 11m per day
Rank #95 / 112Nurse hours — State benchmarkedThis home is ranked 95th out of 112 homes in South Carolina. Shows adjusted nurse hours per resident per day benchmarked to the South Carolina average, with a ranking across 112 South Carolina SNFs. More hours mean more direct care. The national average is about 3.5 hrs; below 3.0 is a red flag.Click the rank badge to see the full State ranking.Click here to see the full State ranking.
This facility South Carolina avg (4h 5m per day)
vs South Carolina avg
-22%
Staff typeHours / Day / Residentvs state avg
Weekend Total Nursing Info Combined nursing hours (RN + LPN + Nurse Aide) per resident per day on weekends. Staffing often drops on weekends — this figure reveals whether the facility maintains adequate coverage outside of weekday hours. 2h 44m per day

Capacity and availability

This home usually has limited availability

Occupancy between 85% and 95% suggests balanced demand.

Higher occupancy than the South Carolina average: 82.1%
Occupancy rate 91% Rank #26 / 121Occupancy rate — State benchmarkedThis home is ranked 26th out of 121 homes in South Carolina. Shows this facility's occupancy rate versus the South Carolina average, with its Statewide rank out of 121. Higher occupancy signals strong local demand and financial stability.Click the rank badge to see the full State ranking.Click here to see the full State ranking.
Avg. Length of Stay 131 days
Occupancy rate
91% Rank #26 / 121Occupancy rate — State benchmarkedThis home is ranked 26th out of 121 homes in South Carolina. Shows this facility's occupancy rate versus the South Carolina average, with its Statewide rank out of 121. Higher occupancy signals strong local demand and financial stability.Click the rank badge to see the full State ranking.Click here to see the full State ranking.
Avg. Length of Stay
131 days
Bed community size
176-bed community Rank #8 / 312Bed count — State benchmarkedThis home is ranked 8th out of 312 homes in South Carolina. Shows this facility's certified or reported bed count compared to other South Carolina SNFs. Larger communities may offer more amenities, programs, and on-site services for residents and families.Click the rank badge to see the full State ranking.Click here to see the full State ranking.
A large-scale community that may provide a wide range of amenities, services, and structured programs.

About this community

License Details

Facility TypeHl- Nursing Home
StatusActive
ExpirationOctober 31, 2026
CountyCharleston
License NumberNCF-1065
Business TypeLimited Liability

Ownership & Operating Entity

Cooper River Post Acute is legally operated by Mtpleasant Snf Llc, and administrated by Tanner Litchfield.

Owner NameMtpleasant Snf LLC

Type Of Units

Institutional Nursing Home
176 units
Total beds
176 units

Therapy & Rehabilitation

2 services
Rehabilitation Services
Short-Term Rehab

Contact Information

Amenities & Lifestyle

Beauty Salon
Housekeeping Services
Person-Centered Activities

Contact Cooper River Post Acute

Inspection History

In South Carolina, the Department of Public Health, Bureau of Healthcare Quality conducts unannounced inspections to ensure care providers meet all health and safety codes.

Read the full inspection reports for this facility, including detailed findings and corrective actions.

Show Inspection Reports

Health Inspection History

Inspections since 2023
Total health inspections 6

South Carolina average 3.9


Last Health inspection on Apr 2025

Total health citations
47 Rank #113 / 113Health citations — State benchmarkedThis home is ranked 113th out of 113 homes in South Carolina. Shows this facility's total health deficiency citations benchmarked to the South Carolina State average, with a ranking across all 113 SC SNFs. Lower citation counts earn a better rank.Click the rank badge to see the full State ranking.Click here to see the full State ranking.

South Carolina average 13.7

Citations per inspection
7.83 Rank #112 / 113Citations per inspection — State benchmarkedThis home is ranked 112th out of 113 homes in South Carolina. Shows average deficiency citations per CMS inspection for this facility versus the South Carolina mean across 113 SNFs with citation data. Lower is better.Click the rank badge to see the full State ranking.Click here to see the full State ranking.

South Carolina average 3.44


Health citations are formal notices following inspections when they fail to comply with safety and care standards.

31 of 47 citations resulted from standard inspections; 5 of 47 resulted from complaint investigations; and 11 of 47 came from combined inspections (standard and complaint).

Breakdown of citation severity (last 3 years)
Critical health citations
4
300% worse than South Carolina average

South Carolina average: 1


Serious health citations
0
100% better than South Carolina average

South Carolina average: 0.3

4 critical citations South Carolina average: 1

0 serious citations South Carolina average: 0.3

42 moderate citations South Carolina average: 12.3

1 minor citation South Carolina average: 0.1
Citations history (last 3 years)
Infection Control moderate citation Apr 10, 2025
Corrected

Infection Control moderate citation Apr 10, 2025
Corrected

Nutrition moderate citation Apr 10, 2025
Corrected

Pharmacy moderate citation Apr 10, 2025
Corrected

Staffing Data

Reporting period: October 1 – December 31, 2025 (Q4 2025). Source: CMS Payroll-Based Journal report.

Total staff 291
Employees 145
Contractors 146
Staff to resident ratio 1.93:1
5% better than South Carolina average
South Carolina average ratio: 1.84:1 South Carolina average ratio: 1.84:1See full South Carolina ranking
Avg staff/day 67
Average shift 8.7 hours
10% better than South Carolina average
South Carolina average: 7.9 hours South Carolina average shift: 7.9 hoursSee full South Carolina ranking
Total staff hours (quarter) 53,924

Nursing staff breakdown

Q4 2025 · Oct 1 – Dec 31 More info This data comes from the CMS Payroll-Based Journal report covering October 1 – December 31, 2025.
Registered Nurse

Manages medical care and health needs.

RN Staff 40
Average shift length Info Average shift length. Calculated as total hours divided by days worked and average staff per day. 10.5 hours

This role is partially covered by contractors.

Licensed Practical Nurse

Assists with medical care and medications.

LPN Staff 49
Average shift length Info Average shift length. Calculated as total hours divided by days worked and average staff per day. 9.5 hours

This role is partially covered by contractors.

Certified Nursing Assistant

Helps with daily care and mobility.

CNA Staff 167
Average shift length Info Average shift length. Calculated as total hours divided by days worked and average staff per day. 9.2 hours

This role is partially covered by contractors.

Contractor staffing

Q4 2025 · Oct 1 – Dec 31 More info This data comes from the CMS Payroll-Based Journal report covering October 1 – December 31, 2025.

Total hours from contractors

7.8%

4,231 contractor hours this quarter

Certified Nursing Assistant: 98 Registered Nurse: 32 Licensed Practical Nurse: 16

Staff by category

Q4 2025 · Oct 1 – Dec 31 More info This data comes from the CMS Payroll-Based Journal report covering October 1 – December 31, 2025.
Certified Nursing Assistant699816726,18492100%9.2
Licensed Practical Nurse33164913,29392100%9.5
Registered Nurse832403,82492100%10.5
Physical Therapy Aide4041,5336975%6.6
Respiratory Therapy Technician4041,3436975%6.9
Speech Language Pathologist4041,2387076%6.5
RN Director of Nursing3031,0276672%7.9
Dental Services Staff2021,0246470%8
Qualified Social Worker4049326773%6.8
Physical Therapy Assistant3038316874%7.2
Clinical Nurse Specialist6067637784%5.7
Other Dietary Services Staff2025817683%7.1
Administrator1015126470%8
Dietitian1015126470%8
Nurse Practitioner1013284145%8
167 Certified Nursing Assistant
% of Days 100%
49 Licensed Practical Nurse
% of Days 100%
40 Registered Nurse
% of Days 100%
4 Physical Therapy Aide
% of Days 75%
4 Respiratory Therapy Technician
% of Days 75%
4 Speech Language Pathologist
% of Days 76%
3 RN Director of Nursing
% of Days 72%
2 Dental Services Staff
% of Days 70%
4 Qualified Social Worker
% of Days 73%
3 Physical Therapy Assistant
% of Days 74%
6 Clinical Nurse Specialist
% of Days 84%
2 Other Dietary Services Staff
% of Days 83%
1 Administrator
% of Days 70%
1 Dietitian
% of Days 70%
1 Nurse Practitioner
% of Days 45%

Penalties and fines

Includes penalties issued in 2023-2025

Federal penalties imposed by CMS for regulatory violations, including civil money penalties (fines) and denials of payment for new Medicare/Medicaid admissions.

Source: CMS Penalties Database (Data as of Jan 2026)

Total fines amount $85K Rank #105 / 114Federal fines — State benchmarkedThis home is ranked 105th out of 114 homes in South Carolina. Shows this facility's cumulative CMS federal fine dollars versus the South Carolina average among facilities with fines, and where it ranks among 114 skilled nursing facilities in the pool. Lower total dollars mean a better rank.Click the rank badge to see the full State ranking.Click here to see the full State ranking.
152% higher than South Carolina average

South Carolina average: $34K

Number of fines 5
105% more fines than South Carolina average

South Carolina average: 2.4

Payment Denials Info Serious action where Medicare and/or Medicaid temporarily stops payments for new residents until issues are fixed. 0
100% fewer payment denials than South Carolina average

South Carolina average: 0.1

Fines amount comparison
This facility $85K
South Carolina average $34K
Penalty History

Penalties are imposed by CMS for violations of federal nursing home regulations.

5 penalties in the past 3 years

Multiple penalties were reported in the last 3 years.

Civil Money Penalty Info Fines imposed for noncompliance, which can be assessed per day or per instance of violation. Apr 10, 2025
$8K
Civil Money Penalty Info Fines imposed for noncompliance, which can be assessed per day or per instance of violation. Apr 18, 2024
$49K
Civil Money Penalty Info Fines imposed for noncompliance, which can be assessed per day or per instance of violation. Jan 5, 2024
$4K
Civil Money Penalty Info Fines imposed for noncompliance, which can be assessed per day or per instance of violation. Jan 5, 2024
$13K

Last updated: Jan 2026

Quality of care over time

These measures show how residents usually do over time at this home, based on health outcomes and preventive care.

High-risk clinical events score Info A composite score based on pressure ulcers, falls with injury, weight loss, walking ability decline, and activities of daily living decline. 13.7
56% worse than South Carolina average

South Carolina average: 8.7

Functional decline score Info A composite score based on activities of daily living decline, walking ability decline, and incontinence. 24.0
55% worse than South Carolina average

South Carolina average: 15.5

Long-stay resident measures
Need for Help with Daily Activities Increased Info Percent of long-stay residents whose need for help with daily activities has increased 20.8%
59% worse than South Carolina average

South Carolina average: 13.1%

Walking Ability Worsened Info Percent of long-stay residents whose ability to move independently worsened 28.8%
77% worse than South Carolina average

South Carolina average: 16.2%

Low Risk Residents with Bowel/Bladder Incontinence Info Percent of low risk long-stay residents who lose control of their bowels or bladder 22.6%
33% worse than South Carolina average

South Carolina average: 17.0%

Falls with Major Injury Info Percent of long-stay residents experiencing one or more falls with major injury 2.5%
16% better than South Carolina average

South Carolina average: 3.0%

High Risk Residents with Pressure Ulcers Info Percent of long-stay high risk residents with pressure ulcers 7.7%
26% worse than South Carolina average

South Carolina average: 6.1%

Urinary Tract Infection Info Percent of long-stay residents with a urinary tract infection 2.2%
33% worse than South Carolina average

South Carolina average: 1.6%

Lost Too Much Weight Info Percent of long-stay residents who lose too much weight 8.6%
39% worse than South Carolina average

South Carolina average: 6.2%

Depressive Symptoms Info Percent of long-stay residents who have depressive symptoms 4.4%
60% worse than South Carolina average

South Carolina average: 2.8%

Pneumococcal Vaccine Info Percent of long-stay residents assessed and appropriately given the pneumococcal vaccine 62.9%
30% worse than South Carolina average

South Carolina average: 90.5%

Influenza Vaccine Info Percent of long-stay residents assessed and appropriately given the seasonal influenza vaccine 65.6%
28% worse than South Carolina average

South Carolina average: 90.6%

Short-stay resident measures
Pneumococcal Vaccine Info Percent of short-stay residents assessed and appropriately given the pneumococcal vaccine 76.0%
In line with South Carolina average

South Carolina average: 79.5%

Antipsychotic medication increase Info Percent of short-stay residents who newly received an antipsychotic medication 3.8%
126% worse than South Carolina average

South Carolina average: 1.7%

Influenza Vaccine Info Percent of short-stay residents assessed and appropriately given the seasonal influenza vaccine 87.0%
11% better than South Carolina average

South Carolina average: 78.0%

Breakdown by payment type

Medicare

20% of new residents, usually for short-term rehab.

Typical stay 1 - 2 months

Private pay

67% of new residents, often for short stays.

Typical stay 1 - 2 months

Medicaid

13% of new residents, often for long-term daily care.

Typical stay 2 years

Facility Characteristics

Source: CMS Long-Term Care Facility Characteristics (Data as of Jan 2026)

Total residents 151
Medicare
17
11.3% of residents
Medicaid
94
62.3% of residents
Private pay or other
40
26.5% of residents
Programs & Services
Residents Group

Residents meet regularly to discuss policies, care quality, and activities

Active Resident Council

Organized group of residents that meets regularly to discuss facility policies, quality of life, and activities.

Finances and operations

Privately-owned community
Home revenue
$23.2M
Operating loss
-$291.1K
Privately-owned community
Home revenue
$23.2M Rank #16 / 116Revenue — State benchmarkedThis home is ranked 16th out of 116 homes in South Carolina. Shows this facility's annual revenue compared to the South Carolina SNF average. Higher revenue generally means more resources for staffing and capital — read alongside Payroll %.Click the rank badge to see the full State ranking.Click here to see the full State ranking.
Operating loss
-$291.1K
Payroll costs Info The portion of the home's budget spent on staff, including nurses, caregivers, and other employees who support care and operations. Rank #13 / 116Payroll — State benchmarkedThis home is ranked 13th out of 116 homes in South Carolina. Shows total annual staff payroll benchmarked to the South Carolina average. Higher payroll investment relative to peers often signals better staffing and less reliance on cheaper contract labor.Click the rank badge to see the full State ranking.Click here to see the full State ranking.
$11.0M
47.4% of revenue Rank #60 / 116Payroll % — State benchmarkedThis home is ranked 60th out of 116 homes in South Carolina. Shows payroll as a percentage of revenue versus the South Carolina average. Well-run South Carolina SNFs typically land around 53–64% — the top third Statewide. Below 25% may signal understaffing or heavy agency use — read with Staffing ratings.Click the rank badge to see the full State ranking.Click here to see the full State ranking.
Other operating costs Info All remaining costs needed to run the home, such as food, utilities, building maintenance, supplies and administrative expenses.
$12.5M
Total costs $23.5M

Who this home usually serves

TYPE OF STAY

Primarily short stays

Residents typically stay for brief periods, with frequent admissions and discharges throughout the year.

Places of interest near Cooper River Post Acute

Address 6370.1 miles from city center Info Estimated distance in miles from Mount Pleasant's city center to Cooper River Post Acute's address, calculated via Google Maps.

Calculate Travel Distance to Cooper River Post Acute

Add your location

Address

Financial Assistance for
Nursing Home in South Carolina

Cooper River Post Acute is located in MOUNT PLEASANT, South Carolina.
Here are the financial assistance programs available to residents in South Carolina.

Get Financial aid guidance

Community Long Term Care (CLTC)

SC Medicaid CLTC

Age 65+ or disabled
General South Carolina resident, Medicaid-eligible, nursing home-level care need.
Income Limits (2025) ~$2,829/month 300% FBR, individual
Asset Limits $2,000 (individual), $3,000 (couple).
SC

High rural demand; waitlists possible.

Benefits
Personal care (5-7 hours/day) Respite (240 hours/year) Adult day care ($60/day) Home modifications ($1,500 avg.)

South Carolina Respite Care Program

SC NFCSP Respite

Age Caregiver of someone 60+ (or with dementia)
General South Carolina resident.
Income Limits No strict limit; prioritizes low-income.
Asset Limits Not applicable.
SC

Limited slots; rural/urban balance.

Benefits
In-home respite (4-6 hours/day) Adult day care (~$60/day) Short-term facility care (up to 5 days)

Medicare Savings Program (MSP)

South Carolina Medicare Savings Program

Age 65+ or disabled
General SC resident, Medicare Part A/B.
Income Limits (2025) ~$2,510/month (QMB), ~$3,380/month (SLMB), ~$3,598/month (QI)—individual.
Asset Limits $9,430 (individual), $14,130 (couple).
SC

Three tiers; includes Extra Help for Part D; no waitlist.

Benefits
Covers Part B premiums ($174.70/month) Deductibles ($240/year) Copays (~20%)

VA Aid and Attendance (A&A) and Housebound Benefits

South Carolina VA Aid and Attendance/Housebound

Age 65+ or disabled veteran/spouse
General SC resident, wartime service, need for ADL help (A&A) or homebound.
Income Limits (2025) Net income < ~$1,984/month (veteran with dependent, A&A); pension offsets income.
Asset Limits ~$155,356 net worth limit
SC

High veteran population; supports rural/urban care needs.

Benefits
Cash (~$1,433-$2,642/month veteran, ~$951-$1,318 spouse) for care costs (e.g., in-home, assisted living)

Senior Farmers’ Market Nutrition Program (SFMNP)

South Carolina SFMNP

Age 60+
General SC resident, low-income.
Income Limits (2025) ~$2,322/month individual, 185% FPL
Asset Limits Not assessed.
SC

Vouchers (~$50/season); serves ~20,000 annually via 10 AAAs.

Benefits
Vouchers (~$50/season) for fresh produce at approved markets

Homestead Exemption Program

South Carolina Homestead Exemption

Age 65+ (or disabled/blind)
General SC resident 1+ year, homeowner.
Income Limits (2025) None; tax-based eligibility.
Asset Limits Not assessed; home-focused.
SC

Saves ~$500-$1,000/year avg.; applies to primary residence.

Benefits
Property tax exemption (~$50,000 value, ~$500-$1,000/year savings)

Elderly Simplified Application Project (ESAP)

South Carolina ESAP (SNAP for Seniors)

Age 60+
General SC resident, no earned income, not on SCCAP.
Income Limits (2025) ~$1,732/month 133% FPL, individual
Asset Limits $4,250 individual, higher than standard SNAP
SC

Simplified process; serves ~50,000 seniors annually.

Benefits
EBT card for food (~$100-$300/month based on income)

Compare Nursing Home around Mount Pleasant

The information below is reported by the South Carolina Department of Public Health, Bureau of Healthcare Quality.

5 facilities compared · CMS & SC Dept. of Health data

Filter by care type
Laurels of Mt Pleasant
NH

Nursing Home Licensed facility providing 24/7 skilled nursing care for residents with complex, ongoing medical needs. Staffed by RNs, LPNs, and CNAs. Inspected and star-rated annually by CMS. Accepts Medicare (short-term rehab) and Medicaid (long-term care).

AL

Assisted Living A licensed, long-term care setting for seniors or individuals with disabilities who need help with daily activities — like bathing, dressing, and medication management — but not 24-hour skilled nursing. Offers housing, meals, and around-the-clock support while aiming to maximize resident independence.

Mt Pleasant112 74.6% -2%3.78 -7%-12%$072.3-87- 34 Tami Bolies$20.2M$6.7M33.4%235385
Medilodge of Mt Pleasant
NH

Nursing Home Licensed facility providing 24/7 skilled nursing care for residents with complex, ongoing medical needs. Staffed by RNs, LPNs, and CNAs. Inspected and star-rated annually by CMS. Accepts Medicare (short-term rehab) and Medicaid (long-term care).

AL

Assisted Living A licensed, long-term care setting for seniors or individuals with disabilities who need help with daily activities — like bathing, dressing, and medication management — but not 24-hour skilled nursing. Offers housing, meals, and around-the-clock support while aiming to maximize resident independence.

Mt Pleasant132 47.0% -38%3.83 +17%-11%$0163.2177A+ 28 -$9.9M$4.4M44.2%235490
Oak Harbor Healthcare
NH

Nursing Home Licensed facility providing 24/7 skilled nursing care for residents with complex, ongoing medical needs. Staffed by RNs, LPNs, and CNAs. Inspected and star-rated annually by CMS. Accepts Medicare (short-term rehab) and Medicaid (long-term care).

AL

Assisted Living A licensed, long-term care setting for seniors or individuals with disabilities who need help with daily activities — like bathing, dressing, and medication management — but not 24-hour skilled nursing. Offers housing, meals, and around-the-clock support while aiming to maximize resident independence.

Mount Pleasant132 91.7% +12%3.81 -28%-5%$7.9k132.61121--Braden Wiscombe$17.6M$7.7M43.9%425110
Cooper River Post Acute
NH

Nursing Home Licensed facility providing 24/7 skilled nursing care for residents with complex, ongoing medical needs. Staffed by RNs, LPNs, and CNAs. Inspected and star-rated annually by CMS. Accepts Medicare (short-term rehab) and Medicaid (long-term care).

AL

Assisted Living A licensed, long-term care setting for seniors or individuals with disabilities who need help with daily activities — like bathing, dressing, and medication management — but not 24-hour skilled nursing. Offers housing, meals, and around-the-clock support while aiming to maximize resident independence.

Mount Pleasant176 91.0% +11%3.18 -+47%-21%$84.7k477.84151--Palmetto Master Tenant, LLC$23.2M$11.0M47.4%425146
South Bay At Mount Pleasant -
NH

Nursing Home Licensed facility providing 24/7 skilled nursing care for residents with complex, ongoing medical needs. Staffed by RNs, LPNs, and CNAs. Inspected and star-rated annually by CMS. Accepts Medicare (short-term rehab) and Medicaid (long-term care).

AL

Assisted Living A licensed, long-term care setting for seniors or individuals with disabilities who need help with daily activities — like bathing, dressing, and medication management — but not 24-hour skilled nursing. Offers housing, meals, and around-the-clock support while aiming to maximize resident independence.

Mount Pleasant150 56.2% -32%------------ 17 #N/A$25.4M$9.6M37.9%425417

Frequently Asked Questions about Cooper River Post Acute

Who is the owner of Cooper River Post Acute?

The legal owner and operator of Cooper River Post Acute is Mtpleasant Snf Llc.

What is the license number of Cooper River Post Acute?

According to SC state health department records, Cooper River Post Acute's license number is NCF-1065.

When does Cooper River Post Acute's license expire?

According to SC state health department records, Cooper River Post Acute's license expires on October 31, 2026.

What is the best email address for Cooper River Post Acute?

The team at Cooper River Post Acute can be reached at [email protected].

Who is the administrator of Cooper River Post Acute?

Tanner Litchfield is the administrator of Cooper River Post Acute.

How many beds does Cooper River Post Acute have?

Cooper River Post Acute has 176 beds.

What is the address of Cooper River Post Acute?

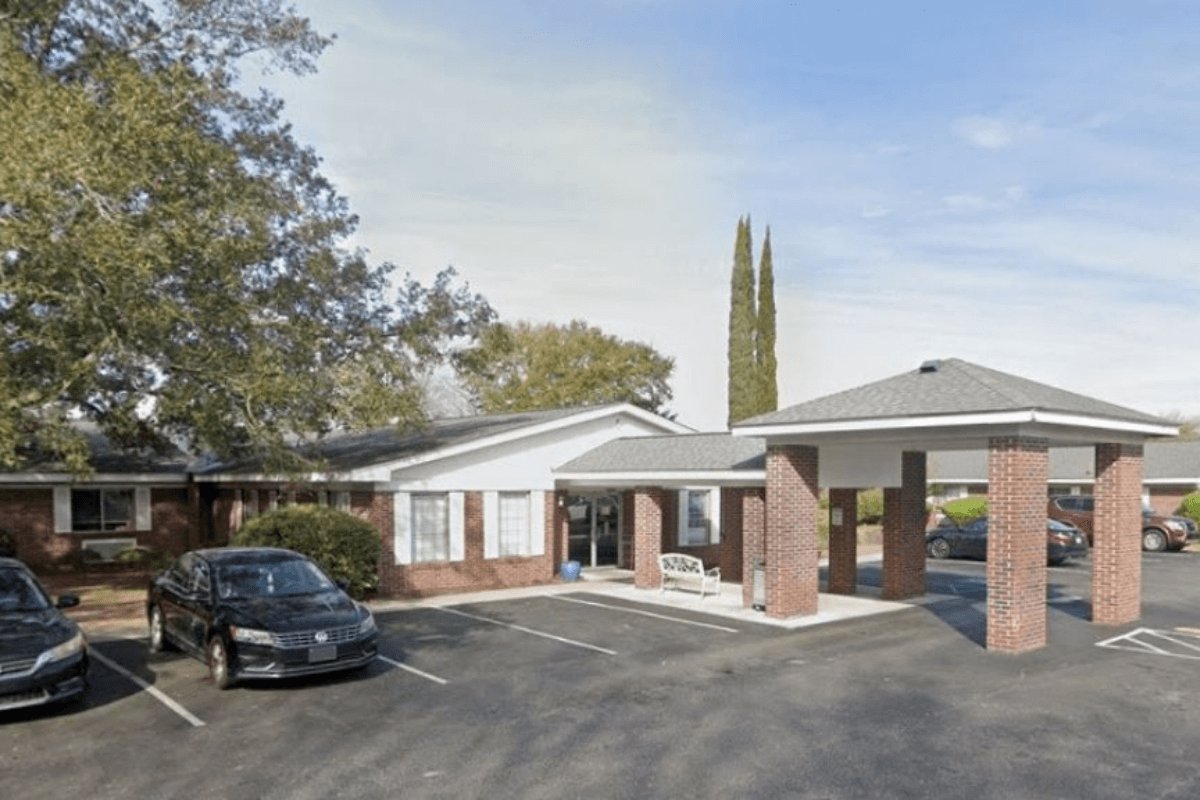
Cooper River Post Acute is located at 1049 ANNA KNAPP BLVD.

Guides for Better Senior Living

Care Cost Calculator: See Prices in Your Area

Nursing Home Data Explorer

Don’t Wait Too Long: 7 Red Flag Signs Your Parent Needs Assisted Living Now

The True Cost of Assisted Living in 2025 – And How Families Are Paying For It

Understanding Senior Living Costs: Pricing Models, Discounts & Financial Assistance

Explore Open Rooms
1 Contact details
2 What type of senior care service are you looking for?
3 What budget do you have in mind for senior care?
4 How soon do you need to find care?
5 Additional details

Thank you for your interest!

Our team will be in touch shortly to help with next steps.