Crestview Nursing & Residential Living
Nursing Home, Assisted Living, Residential Care & Skilled Nursing · Seneca, KS
CMS overall rating Info CMS (the Centers for Medicare & Medicaid Services) is the federal agency that rates nursing home quality. Its Overall Rating runs from 1 to 5 stars, combining health inspections, staffing, and quality measures, with inspections weighted most heavily.

Crestview Nursing & Residential Living

Nursing Home, Assisted Living, Residential Care & Skilled Nursing · Seneca, KS
CMS overall rating Info CMS (the Centers for Medicare & Medicaid Services) is the federal agency that rates nursing home quality. Its Overall Rating runs from 1 to 5 stars, combining health inspections, staffing, and quality measures, with inspections weighted most heavily.
Calculator: See prices in your area
Crestview Nursing & Residential Living accepts Medicare, Medicaid, and private pay.

Overview of Crestview Nursing & Residential Living

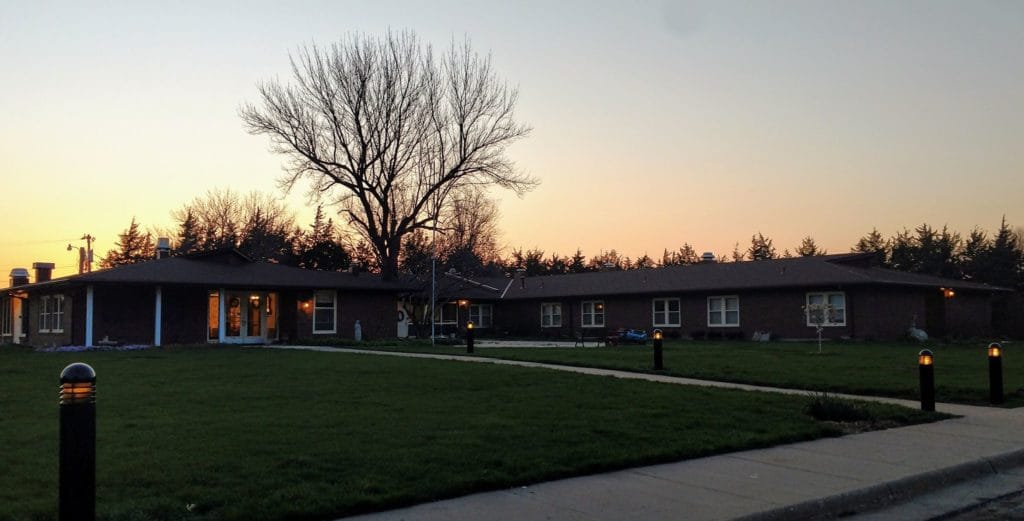
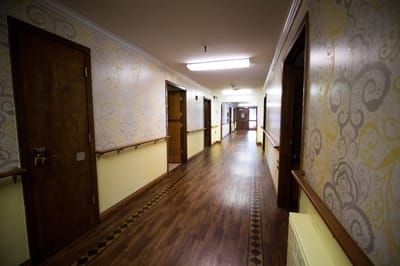
Crestview LLC owns and operates Crestview Nursing & Residential Living, a 34-bed skilled nursing home located in Seneca, Kansas. The financial team handles billing through standard setups, accepting private pay alongside Medicare and Medicaid options. Earning a Walk Score of 58, the community is located in an area where some routine errands can be handled on foot, though family members and visitors will generally need a car for regional transit.

The building operates a 34-bed footprint, serving as a smaller residential option where the average length of stay tracks at 360 days. This timeline shows a consistent operational focus on long-term residential placements alongside temporary post-hospital therapy. To monitor daily clinical needs, the 24-hour nursing team provides an average of 4 hours and 45 minutes of direct care per resident each day, divided into 3 hours and 1 minute from nurse aides, 27 minutes from registered nurses, and 27 minutes from licensed practical nurses.

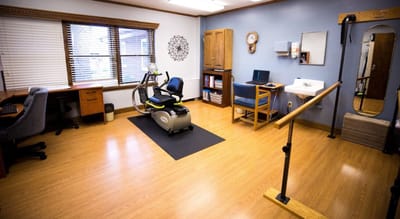
This floor staff administers personalized care plans, medication management, and on-site physical therapy, while recent state reviews confirm the facility resolved earlier documentation concerns to achieve full regulatory compliance.

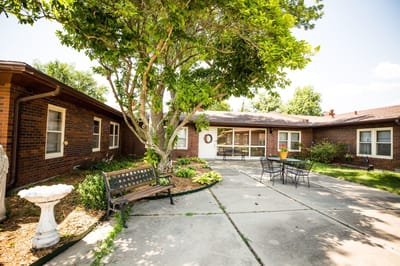
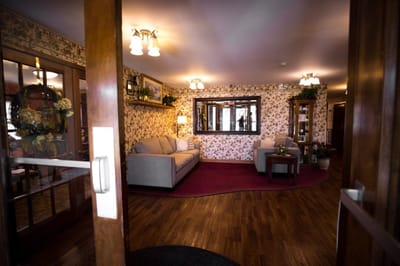
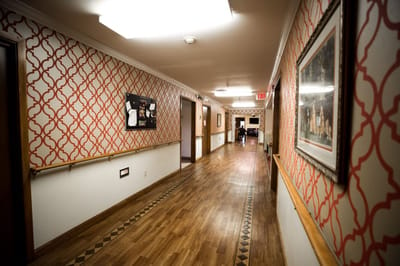
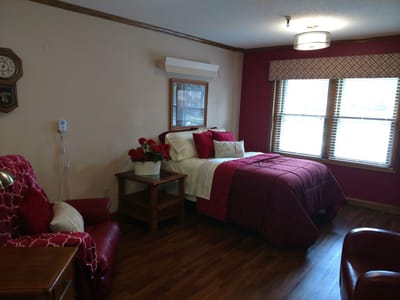
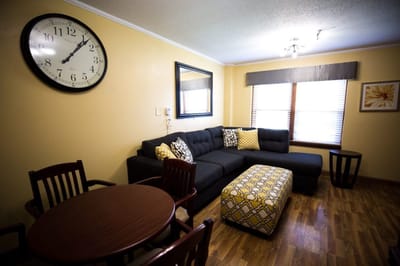
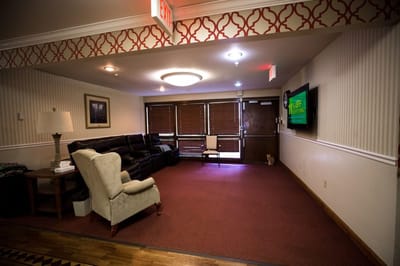
Families can reach out to the main office to book a walkthrough of the private room layouts, look over the courtyard, and see the private dining and entertaining spaces. The front desk staff answers inquiries regarding room availability, the 24-hour flexible menu, and free transportation arrangements for local shopping and medical appointments.

Quality ratings

Measured by Centers for Medicare & Medicaid Services (CMS)

Overall rating Info The Overall CMS Rating combines results from health inspections, staffing levels and quality measures. Health inspections carry the most weight. Staffing and quality scores can increase or decrease the final rating based on performance compared to state and national standards.
Health Inspection Info Based on the results of the facility's three most recent standard inspections and any complaint investigations. CMS reviews the number, scope, and severity of deficiencies, with more recent findings weighted more heavily.
Staffing Info Measures average nursing staff hours per resident per day, including Registered Nurses (RNs) and total nursing staff. Ratings are adjusted based on the level of care residents require and are compared to state and national benchmarks.
Quality Measures Info Based on clinical and physical health indicators reported to CMS, such as hospital readmissions, falls, pressure ulcers, and improvements in mobility. These measures reflect how well residents' health needs are being managed.

Staffing hours breakdown

Info Daily nursing hours per resident by staff type, reported to CMS. Higher is generally better — compare this facility to state and national averages to see where staffing stands.

Hours per resident per day — compared to state averages

Total nursing care / resident Info Total adjusted nursing hours per resident per day, combining RN, LPN, and aide time. CMS adjusts this for case-mix so facilities can be fairly compared.
4h 45m per day
vs avg

3 of 6 metrics below state avg

Standout metric LPN / LVN is +52% above state avg
Staff typeHours / Day / Residentvs state avg
Registered Nurse (RN) Info RNs hold the highest nursing license and can assess residents, interpret test results, and direct care plans. More RN hours per day often signals stronger clinical oversight and faster response to health changes. 27m per day ▼ 37% State avg: 43m per day · National avg: 41m per day
LPN / LVN Info Licensed Practical Nurses (LPNs) or Licensed Vocational Nurses (LVNs) deliver routine hands-on care — medication administration, wound dressing, and monitoring vital signs. They work under RN supervision and make up a large share of daily bedside care. 1h 1m per day ▲ 52% State avg: 40m per day · National avg: 52m per day
Nurse Aide Info Certified Nurse Aides (CNAs) provide the most direct day-to-day assistance: bathing, dressing, feeding, and mobility. Nurse aide hours are typically the largest staffing category and directly affect residents' quality of life. 3h 1m per day ▲ 12% State avg: 2h 41m per day · National avg: 2h 20m per day
Weekend Total Nursing Info Combined nursing hours (RN + LPN + Nurse Aide) per resident per day on weekends. Staffing often drops on weekends — this figure reveals whether the facility maintains adequate coverage outside of weekday hours. 4h 4m per day ▲ 14% State avg: 3h 35m per day · National avg: 3h 26m per day
Physical Therapist Info Hours per resident per day provided by licensed Physical Therapists (PTs) or PT Assistants. PT services help residents recover mobility after injury or illness and are especially important for post-acute (short-stay) rehabilitation. 0m per day ▼ 94% State avg: 2m per day · National avg: 4m per day
Weekend RN Info Registered nurse hours specifically on weekends. Facilities sometimes reduce RN presence on Saturdays and Sundays — a low weekend RN figure compared to weekday hours can indicate reduced clinical oversight when most administrative staff are absent. 27m per day ▼ 10% State avg: 30m per day · National avg: 28m per day

Capacity and availability

Avg. Length of Stay Info Average number of days residents stay at this facility, based on CMS cost report data. Shorter stays often reflect post-acute or rehab care; longer stays reflect long-term care.
360 days
Bed community size
34-bed community Rank #217 / 224Bed count — State benchmarkedThis home is ranked 217th out of 224 homes in Kansas. Shows this facility's certified or reported bed count compared to other Kansas facilities. Larger communities may offer more amenities, programs, and on-site services for residents and families.Rankings are based only on facilities in Kansas that report data for that category. Facilities without available data are excluded from the ranking.Click the rank badge to see the full State ranking.Click here to see the full State ranking.
A moderately sized community that may balance personal attention with shared amenities and social activities.
Walk Score
Walk Score: 58 / 100 Rank #111 / 363Walk Score — State benchmarkedThis home is ranked 111th out of 363 homes in Kansas. Shows how walkable this facility's neighborhood is compared to the average Walk Score across Kansas facilities. Higher scores benefit residents, families, and staff.Rankings are based only on facilities in Kansas that report data for that category. Facilities without available data are excluded from the ranking.Click the rank badge to see the full State ranking.Click here to see the full State ranking.
Moderately walkable. Some errands can be accomplished on foot, with a mix of nearby amenities.

About this community

License Details

Facility TypeNursing Facility | Residential Health Care Facility
StatusActive
CountyNemaha
License Number175426
CMS Certification Number175426

Ownership & Operating Entity

Crestview Nursing & Residential Living is administered by Sara Sourk.

Owner NameCrestview LLC

Safety & Compliance

Safety FeaturesNurses Emergency Call Lights in each Room/Bathroom, Keypad Entry for 24-Hour Security.

Therapy & Rehabilitation

1 service
Rehabilitation Services

Staffing & Medical

1 service
24-Hour Staffing

Additional Policies & Features

Pets Allowed
HousekeepingYes
Linen ServiceYes

Amenities & Lifestyle

Nurse In The Building 24 Hours
Month To Month Rental
Lower Cost Than The Nursing Home
Private Room & Bathroom
Home-Like Atmosphere
Medication Management & Administration
Personalized Plan Of Care
24-Hour Meals
Outdoor Courtyard
Private Entertaining Living Room
Free Transportation To Beauty Salon
Doctor Appointments And In-Town Shopping
Specific ProgramsResidential Living, Long-Term & Short-Term Care, Onsite Therapy, Beauty Salon/Barber Shop, Weekly Housekeeping & Linen Service, Free Cable and WiFi
Religious ServicesOnsite Chapel with Various Religious Services

Contact Crestview Nursing & Residential Living

Inspection History

In Kansas, the Department for Aging and Disability Services, Survey and Certification Commission performs the unannounced inspections required for facility licensing and federal certification.

Since 2012 · 14 years of data 101 deficiencies

Inspection Scorecard Info This scorecard compares key inspection, deficiency, and complaint metrics at this facility against the Kansas state average. Metrics rated ≥15% worse than average are highlighted in red; those ≥15% better are highlighted in green.

Since 2012 vs. Kansas state average
Overall vs. KS average 2 Worse Metrics worse than Kansas average:
• Total deficiencies (1% above)
• Deficiencies per year (1% above)
0 Better No metrics in this bucket.
Latest Inspection December 18, 2025

Deficiencies Info Deficiencies are formal regulatory issues recorded during state inspections.

This FacilityKS Averagevs. KS Avg
Total deficiencies Info Formal regulatory issues recorded by inspectors across all inspection types. 101100 This facility has 1% more total deficiencies than a typical Kansas assisted living residence (101 vs. KS avg 100).↑ 1% worse
Deficiencies per year Info Average deficiencies per year since 2012. 7.27.1 This facility has 1% more deficiencies per year than a typical Kansas assisted living residence (7.2 vs. KS avg 7.1).↑ 1% worse

Inspection Reports Summary Info An editor-reviewed summary of the themes and findings across this facility's recent inspection reports.

  • The most recent inspection on November 25, 2025, found no deficiencies and confirmed the facility was in compliance with all regulations. Earlier inspections showed some deficiencies primarily related to completing Functional Capacity Screens after changes in resident conditions and updating care plans to address specific health needs, as well as issues with vaccination documentation and safe mechanical lift transfers. Complaint investigations in the past identified lapses in resident supervision, including substantiated cases of elopement risk, but more recent reports do not list enforcement actions or fines. The facility has addressed prior deficiencies through plans of correction and subsequent revisits confirmed corrections were made. Inspection results indicate improvement over time, with the most recent surveys showing compliance and resolution of earlier cited issues.

Health Inspection History

Inspections since 2021
Total health inspections 2

State average N/A


Last Health inspection on Oct 2024

Total health citations
6

State average N/A

Citations per inspection
3

State average N/A


Health citations are formal notices following inspections when they fail to comply with safety and care standards.

All 6 citations resulted from standard inspections.

Breakdown of citation severity (last 5 years)
Critical health citations
0
In line with State average

State average: N/A


Serious health citations
1
In line with State average

State average: N/A

0 critical citations State average: N/A

1 serious citation State average: N/A

5 moderate citations State average: N/A

0 minor citations State average: N/A
Citations history (last 5 years)
Infection Control moderate citation Oct 24, 2024
Corrected

Quality of Care serious citation Oct 24, 2024
Corrected

Care Planning moderate citation Oct 24, 2024
Corrected

Infection Control moderate citation Nov 04, 2021
Corrected

Staffing Data

Reporting period: October 1 – December 31, 2025 (Q4 2025). Source: CMS Payroll-Based Journal report.

Total staff 70
Employees 57
Contractors 13
Staff to resident ratio 3.04 : 1
0% compared with State average

State average ratio: 0 : 0

Avg staff/day 19
Average shift 6.8 hours
0% compared with State average

State average: 0 hours

Total staff hours (quarter) 11,851

Nursing staff breakdown

Q4 2025 · Oct 1 – Dec 31 More info This data comes from the CMS Payroll-Based Journal report covering October 1 – December 31, 2025.
Registered Nurse

Manages medical care and health needs.

RN Staff Info All 5 RN Staff are full-time employees. No contractors work on this role. 5
Average shift length Info Average shift length. Calculated as total hours divided by days worked and average staff per day. 5.1 hours
Licensed Practical Nurse

Assists with medical care and medications.

LPN Staff Info All 5 LPN Staff are full-time employees. No contractors work on this role. 5
Average shift length Info Average shift length. Calculated as total hours divided by days worked and average staff per day. 7.8 hours
Certified Nursing Assistant

Helps with daily care and mobility.

CNA Staff Info All 38 CNA Staff are full-time employees. No contractors work on this role. 38
Average shift length Info Average shift length. Calculated as total hours divided by days worked and average staff per day. 6.5 hours

Contractor staffing

Q4 2025 · Oct 1 – Dec 31 More info This data comes from the CMS Payroll-Based Journal report covering October 1 – December 31, 2025.

Total hours from contractors

0.7%

89 contractor hours this quarter

Other Physician: 4 Speech Language Pathologist: 2 Respiratory Therapy Technician: 2 Occupational Therapy Assistant: 1 Occupational Therapy Aide: 1 Medical Director: 1 Physical Therapy Assistant: 1 Qualified Social Worker: 1

Staff by category

Q4 2025 · Oct 1 – Dec 31 More info This data comes from the CMS Payroll-Based Journal report covering October 1 – December 31, 2025.
Certified Nursing Assistant380386,27792100%6.5
Licensed Practical Nurse5051,92392100%7.8
Nurse Practitioner1015918592%7
Speech Language Pathologist1235256166%6.6
Administrator1015126470%8
Dietitian1014787582%6.4
Registered Nurse5054106267%5.1
Mental Health Service Worker1013805964%6.4
Medication Aide/Technician1013633841%9.6
RN Director of Nursing2023044347%5.8
Occupational Therapy Assistant0113744%9.2
Occupational Therapy Aide0111733%5.5
Dental Services Staff1011333%4.3
Other Physician04471112%0.7
Respiratory Therapy Technician022589%0.6
Qualified Social Worker011389%0.4
Medical Director011333%1.1
Physical Therapy Assistant011255%0.5
38 Certified Nursing Assistant
% of Days 100%
5 Licensed Practical Nurse
% of Days 100%
1 Nurse Practitioner
% of Days 92%
3 Speech Language Pathologist
% of Days 66%
1 Administrator
% of Days 70%
1 Dietitian
% of Days 82%
5 Registered Nurse
% of Days 67%
1 Mental Health Service Worker
% of Days 64%
1 Medication Aide/Technician
% of Days 41%
2 RN Director of Nursing
% of Days 47%
1 Occupational Therapy Assistant
% of Days 4%
1 Occupational Therapy Aide
% of Days 3%
1 Dental Services Staff
% of Days 3%
4 Other Physician
% of Days 12%
2 Respiratory Therapy Technician
% of Days 9%
1 Qualified Social Worker
% of Days 9%
1 Medical Director
% of Days 3%
1 Physical Therapy Assistant
% of Days 5%

Penalties and fines

Federal penalties imposed by CMS for regulatory violations, including civil money penalties (fines) and denials of payment for new Medicare/Medicaid admissions.

Source: CMS Penalties Database

No penalties in the past 3 years

No civil money penalties or payment denials were reported in the last 3 years.

Quality of care over time

These measures show how residents usually do over time at this home, based on health outcomes and preventive care.

High-risk clinical events score Info A composite score based on pressure ulcers, falls with injury, weight loss, walking ability decline, and activities of daily living decline. 8.7
17% better than State average

State average: 10.5

Functional decline score Info A composite score based on activities of daily living decline, walking ability decline, and incontinence. 14.9
28% better than State average

State average: 20.7

Long-stay resident measures
Average State avg: 3.0 Info CMS star rating based on long-stay quality measure performance. 5 stars = significantly above average, 1 star = significantly below average.
Need for Help with Daily Activities Increased Info Percent of long-stay residents whose need for help with daily activities has increased 18.5%
In line with State average

State average: 19.0%

Walking Ability Worsened Info Percent of long-stay residents whose ability to move independently worsened 12.3%
37% better than State average

State average: 19.4%

Low Risk Residents with Bowel/Bladder Incontinence Info Percent of low risk long-stay residents who lose control of their bowels or bladder 13.9%
42% better than State average

State average: 23.8%

Falls with Major Injury Info Percent of long-stay residents experiencing one or more falls with major injury 6.7%
53% worse than State average

State average: 4.4%

High Risk Residents with Pressure Ulcers Info Percent of long-stay high risk residents with pressure ulcers 1.2%
74% better than State average

State average: 4.6%

Urinary Tract Infection Info Percent of long-stay residents with a urinary tract infection 8.3%
166% worse than State average

State average: 3.1%

Lost Too Much Weight Info Percent of long-stay residents who lose too much weight 4.9%
In line with State average

State average: 5.1%

Depressive Symptoms Info Percent of long-stay residents who have depressive symptoms 0.0%
100% better than State average

State average: 5.2%

Antipsychotic Use Info Percent of long-stay residents who received an antipsychotic medication 10.6%
37% better than State average

State average: 16.9%

Pneumococcal Vaccine Info Percent of long-stay residents assessed and appropriately given the pneumococcal vaccine 100.0%
9% better than State average

State average: 91.9%

Influenza Vaccine Info Percent of long-stay residents assessed and appropriately given the seasonal influenza vaccine 100.0%
5% better than State average

State average: 95.5%

Hospitalizations per 1,000 days Info Number of hospitalizations per 1,000 long-stay resident days. 2.88
57% worse than State average

State average: 1.84

ED visits per 1,000 days Info Number of outpatient emergency department visits per 1,000 long-stay resident days. 3.48
61% worse than State average

State average: 2.16

Short-stay resident measures
Average State avg: 2.6 Info CMS star rating based on short-stay quality measure performance. 5 stars = much above average, 1 star = much below average.
Pneumococcal Vaccine Info Percent of short-stay residents assessed and appropriately given the pneumococcal vaccine 100.0%
32% better than State average

State average: 75.6%

Antipsychotic medication increase Info Percent of short-stay residents who newly received an antipsychotic medication 0.0%
100% better than State average

State average: 2.2%

Falls with major injury Info Percentage of SNF residents who experience falls with major injury during their stay. 4.0%
419% worse than State average

State average: 0.8%

Ability to care for self at discharge Info Percentage of residents at or above expected ability to care for themselves at discharge. 23.8%
56% worse than State average

State average: 53.7%

Successful return to home or community Info Rate of successful return to home or community from a skilled nursing facility. 39.7%
21% worse than State average

State average: 50.6%

Breakdown by payment type

Medicare

46% of new residents, usually for short-term rehab.

Typical stay 1 - 2 months

Private pay

33% of new residents, often for short stays.

Typical stay 2 years

Medicaid

21% of new residents, often for long-term daily care.

Typical stay 1 - 2 years

Facility Characteristics

Source: CMS Long-Term Care Facility Characteristics (Data as of Jan 2026)

Total residents 23
Medicare
1
4.3% of residents
Medicaid
7
30.4% of residents
Private pay or other
15
65.2% of residents
Programs & Services
Residents Group

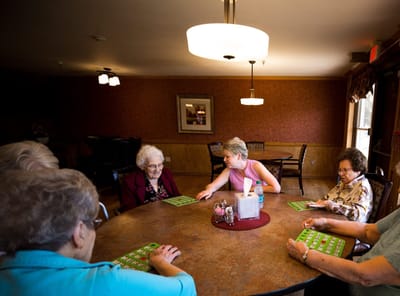
Residents meet regularly to discuss policies, care quality, and activities

Active Resident Council

Organized group of residents that meets regularly to discuss facility policies, quality of life, and activities.

Finances and operations

Based on CMS SNF Cost Report for fiscal year ending in 12/2023.
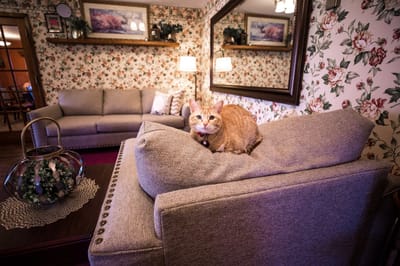
For-profit
Corporation
Net patient revenue Info Net patient revenue — what the home actually collects for resident care, after contractual allowances, bad debt and discounts are subtracted from its gross charges (CMS cost report, Worksheet G-3). It covers resident care only; money the home earns from other sources is shown separately as "Other income."
$2.2M
Net patient income Info Net patient income: net patient revenue minus the home's total operating expenses. A positive figure means it earns more from resident care than it spends to deliver it; a negative figure means the opposite. It excludes non-operating "other income."
-$89.2K
For-profit Corporation
Net patient revenue Info Net patient revenue — what the home actually collects for resident care, after contractual allowances, bad debt and discounts are subtracted from its gross charges (CMS cost report, Worksheet G-3). It covers resident care only; money the home earns from other sources is shown separately as "Other income."
$2.2M
Net patient income Info Net patient income: net patient revenue minus the home's total operating expenses. A positive figure means it earns more from resident care than it spends to deliver it; a negative figure means the opposite. It excludes non-operating "other income."
-$89.2K
Other income Info Money the home earns outside of resident care — such as investments, grants, rentals and other non-operating sources (CMS cost report, Worksheet G-3). It is tracked separately from net patient revenue: it is not part of that figure, and it is not included in net patient income.
$27.3K
Payroll costs Info Staff salaries plus wage-related costs — benefits such as payroll taxes, health insurance and retirement — from the home's own accounting records (CMS cost report, Worksheet A). Contract or agency labor is counted separately, under other operating costs.
$1.5M 67.7% of net patient revenue Info Payroll as a share of revenue: staff salaries and wage-related benefits divided by net patient revenue. A higher figure means more of each revenue dollar goes to staff pay.
Other operating costs Info Everything it costs to run the home apart from payroll — food, utilities, supplies, maintenance, contract labor and administration. Calculated as total operating expense minus payroll (staff salaries and wage-related benefits).
$784.1K
Total costs Info The home's total operating expense for the year — all the costs of running it, salaries included (CMS cost report, Worksheet G-3).
$2.2M

Who this home usually serves

TYPE OF STAY

Mostly short-term rehab stays

Most residents typically stay for a few weeks or months before returning home or moving on.

New residents most often arrive under Medicare (46% of admissions), and a typical Medicare stay runs around 1 - 2 months.

Admissions
24 total

Coverage residents most often arrive under.

Medicare 46%
Private pay 33%
Medicaid 21%
Discharges
25 total

Coverage residents most often leave under.

Medicare 48%
Private pay 26%
Medicaid 26%

Places of interest near Crestview Nursing & Residential Living

Address 0.0 miles from city center Info Estimated distance in miles from Seneca's city center to Crestview Nursing & Residential Living's address, calculated via Google Maps.

Calculate Travel Distance to Crestview Nursing & Residential Living

Add your location

Address

Compare Nursing Homes around the area

The information below is reported by the Kansas Department for Aging and Disability Services.

Ascension Living Via Christi Village McLean
NH
AL
IL
MC
SNF
Wichita (Indian Hills) -95 - 47 Studio / 1 Bed
Brookdale Rosehill
NH
AL
SNF
Shawnee -92 A+ 54 Studio / 1 Bed
Claridge Court
NH
IL
SNF
Prairie Village (Prairie Hills) -45 A+ 64 -
Crestview Nursing & Residential Living
NH
AL
RESC
SNF
Seneca -34 - 58 -
Homestead of Osawatomie
NH
AL
Osawatomie -40 - 13 Suite

Frequently Asked Questions about Crestview Nursing & Residential Living

Who is the owner of Crestview Nursing & Residential Living?

Crestview Nursing & Residential Living is legally operated by Crestview LLC, and administered by Sara Sourk.

Is Crestview Nursing & Residential Living in a walkable area?

Crestview Nursing & Residential Living has a walk score of 58. Moderately walkable. Some errands can be accomplished on foot, with a mix of nearby amenities.

What is the license number of Crestview Nursing & Residential Living?

According to KS state health department records, Crestview Nursing & Residential Living's license number is 175426.

What is the occupancy rate at Crestview Nursing & Residential Living?

Crestview Nursing & Residential Living's occupancy is 65.1%.

Does Crestview Nursing & Residential Living operate as a for-profit or non-profit?

Crestview Nursing & Residential Living is registered as a for-profit in KS.

Who is the administrator of Crestview Nursing & Residential Living?

Sara Sourk is the administrator of Crestview Nursing & Residential Living.

How many beds does Crestview Nursing & Residential Living have?

Crestview Nursing & Residential Living has 34 beds.

Guides for Better Senior Living

Care Cost Calculator: See Prices in Your Area

Nursing Home Data Explorer

Don’t Wait Too Long: 7 Red Flag Signs Your Parent Needs Assisted Living Now

The True Cost of Assisted Living in 2025 – And How Families Are Paying For It

Understanding Senior Living Costs: Pricing Models, Discounts & Financial Assistance