Evansville Protestant Home
Nursing Home · Evansville, IN
CMS overall rating Info The Overall CMS Rating is scored from 1 to 5 stars and combines results from health inspections, staffing levels, and quality measures. Health inspections carry the most weight. Staffing and quality scores can increase or decrease the final rating based on performance compared to state and national standards.

Evansville Protestant Home

Nursing Home · Evansville, IN
CMS overall rating Info The Overall CMS Rating is scored from 1 to 5 stars and combines results from health inspections, staffing levels, and quality measures. Health inspections carry the most weight. Staffing and quality scores can increase or decrease the final rating based on performance compared to state and national standards.
Calculator: See prices in your area
Evansville Protestant Home accepts Medicare, Medicaid, and private pay.

Overview of Evansville Protestant Home

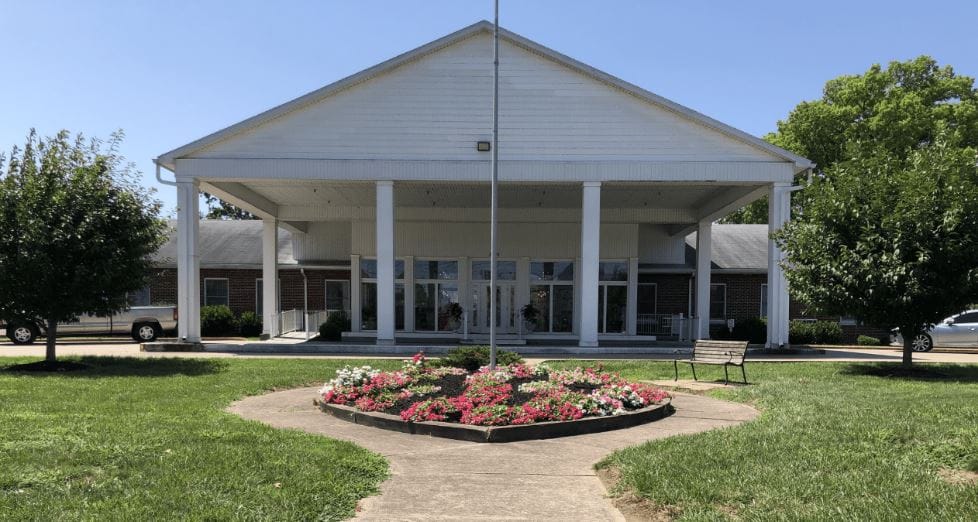
Evansville Protestant Home is a retirement community that offers rehabilitation services. The community offers an inviting atmosphere with fine hospitality. The senior living home community houses a team of dedicated staff who are compassionately ready to attend to any need one may have. Residents are encouraged and motivated to live their life to the fullest in a nurturing home-like setting. Evansville ensures that residents are relaxed and rejuvenated.
Evansville services include 24-hour nursing care, stimulating activities, engaging social activities and programs; with services that include speech, occupational, and physical therapy, rehabilitation, medication management, and ADLs. 

(812) 423-3201

Quality ratings

Measured by Centers for Medicare & Medicaid Services (CMS)

Overall rating Info The Overall CMS Rating combines results from health inspections, staffing levels and quality measures. Health inspections carry the most weight. Staffing and quality scores can increase or decrease the final rating based on performance compared to state and national standards.
▼ 33.6% Below IN avg. ▼ 33.6% Below IN avg.Click the badge to see the full State ranking.Click here to see the full State ranking.
Health Inspection Info Based on the results of the facility's three most recent standard inspections and any complaint investigations. CMS reviews the number, scope, and severity of deficiencies, with more recent findings weighted more heavily.
▼ 26.7% Below IN avg. ▼ 26.7% Below IN avg.Click the badge to see the full State ranking.Click here to see the full State ranking.
Staffing Info Measures average nursing staff hours per resident per day, including Registered Nurses (RNs) and total nursing staff. Ratings are adjusted based on the level of care residents require and are compared to state and national benchmarks.
▲ 56.9% Above IN avg. ▲ 56.9% Above IN avg.Click the badge to see the full State ranking.Click here to see the full State ranking.
Quality Measures Info Based on clinical and physical health indicators reported to CMS, such as hospital readmissions, falls, pressure ulcers, and improvements in mobility. These measures reflect how well residents' health needs are being managed.
▼ 25.9% Below IN avg. ▼ 25.9% Below IN avg.Click the badge to see the full State ranking.Click here to see the full State ranking.

Staffing hours breakdown

Info Daily nursing hours per resident by staff type, reported to CMS. Higher is generally better — compare this facility to state and national averages to see where staffing stands.

Hours per resident per day — compared to Indiana state averages

Total nursing care / resident Info This home is ranked 12th out of 287 homes in Indiana. Total adjusted nursing hours per resident per day, combining RN, LPN, and aide time. CMS adjusts this for case-mix so facilities can be fairly compared.
5h 5m per day
Rank #12 / 287Nurse hours — State benchmarkedThis home is ranked 12th out of 287 homes in Indiana. Shows adjusted nurse hours per resident per day benchmarked to the Indiana average, with a ranking across 287 Indiana SNFs. More hours mean more direct care. The national average is about 3.5 hrs; below 3.0 is a red flag.Click the rank badge to see the full State ranking.Click here to see the full State ranking.
This facility Indiana avg (3h 32m per day)
vs Indiana avg
+44%

0 of 6 metrics below state avg

Standout metric LPN / LVN is +61% above state avg
Staff type Hours / Day / Resident vs state avg
Registered Nurse (RN) Info RNs hold the highest nursing license and can assess residents, interpret test results, and direct care plans. More RN hours per day often signals stronger clinical oversight and faster response to health changes. 1h 0m per day ▲ 50% State avg: 40m per day · National avg: 41m per day
LPN / LVN Info Licensed Practical Nurses (LPNs) or Licensed Vocational Nurses (LVNs) deliver routine hands-on care — medication administration, wound dressing, and monitoring vital signs. They work under RN supervision and make up a large share of daily bedside care. 1h 14m per day ▲ 61% State avg: 46m per day · National avg: 52m per day
Nurse Aide Info Certified Nurse Aides (CNAs) provide the most direct day-to-day assistance: bathing, dressing, feeding, and mobility. Nurse aide hours are typically the largest staffing category and directly affect residents' quality of life. 2h 56m per day ▲ 29% State avg: 2h 16m per day · National avg: 2h 20m per day
Total Nursing (Weekend) Info Combined nursing hours (RN + LPN + Nurse Aide) per resident per day on weekends. Staffing often drops on weekends — this figure reveals whether the facility maintains adequate coverage outside of weekday hours. 3h 55m per day ▲ 21% State avg: 3h 14m per day · National avg: 3h 26m per day
Physical Therapist Info Hours per resident per day provided by licensed Physical Therapists (PTs) or PT Assistants. PT services help residents recover mobility after injury or illness and are especially important for post-acute (short-stay) rehabilitation. 5m per day ▲ 25% State avg: 4m per day · National avg: 4m per day
RN (Weekend) Info Registered nurse hours specifically on weekends. Facilities sometimes reduce RN presence on Saturdays and Sundays — a low weekend RN figure compared to weekday hours can indicate reduced clinical oversight when most administrative staff are absent. 31m per day ▲ 15% State avg: 27m per day · National avg: 28m per day

Types of Care at Evansville Protestant Home

Nursing Home

Capacity and availability

Avg. Length of Stay
153 days
Bed community size
231-bed community Rank #16 / 291Bed count — State benchmarkedThis home is ranked 16th out of 291 homes in Indiana. Shows this facility's certified or reported bed count compared to other Indiana SNFs. Larger communities may offer more amenities, programs, and on-site services for residents and families.Click the rank badge to see the full State ranking.Click here to see the full State ranking.
A large-scale community that may provide a wide range of amenities, services, and structured programs.
Walk Score
Walk Score: 56 / 100 Rank #107 / 291Walk Score — State benchmarkedThis home is ranked 107th out of 291 homes in Indiana. Shows how walkable this facility's neighborhood is compared to the average Walk Score across Indiana SNFs. Higher scores benefit residents, families, and staff.Click the rank badge to see the full State ranking.Click here to see the full State ranking.
Moderately walkable. Some errands can be accomplished on foot, with a mix of nearby amenities.
BBB Rating
BBB Rating: A+ (Not Accredited)
An independent rating from the Better Business Bureau based on factors such as complaint history, transparency, and business practices.
How BBB ratings work

About this community

Occupancy

Occupancy rate
17%
Rank #289 / 291Occupancy rate — State benchmarkedThis home is ranked 289th out of 291 homes in Indiana. Shows this facility's occupancy rate versus the Indiana average, with its Statewide rank out of 291. Higher occupancy signals strong local demand and financial stability.Click the rank badge to see the full State ranking.Click here to see the full State ranking.
Lower than the Indiana average: 68.1%
Occupied beds
40 / 231
Average residents per home in Indiana 70 per day

License Details

Facility TypeMixed Facility (nursing + Residential Care)
IssuanceJanuary 1, 2025
ExpirationDecember 31, 2025
License Number25-001125-1
CMS Certification Number155768

Ownership & Operating Entity

Evansville Protestant Home is legally operated by Henry County Memorial Hospital, and administrated by Anna Perry.

Profit StatusOther

Type Of Units

SNF (Skilled Nursing)
23 units
SNF/NF (Combined)
26 units
NCC (Nursing Care Centers)
38 units
Residential
144 units
Total beds
231 units

Staffing

Key information about the people who lead and staff this community.

Leadership

Director of NursingTAMMY CARROLL
ContactMs. Lisa Doom, Social Services Director

Therapy & Rehabilitation

1 service
Rehabilitation Services

Contact Information

Fax(812) 475-2062

Contact Evansville Protestant Home

Inspection History

In Indiana, the Department of Health, Division of Long Term Care is the primary regulatory body that performs onsite inspections and quality of care reviews for all licensed facilities.

Since 2022 · 4 years of data 31 deficiencies 1 complaint 13 inspections

Inspection Scorecard Info This scorecard compares key inspection, citation, and complaint metrics at this facility against the Indiana state average. Metrics rated ≥15% worse than average are highlighted in red; those ≥15% better are highlighted in green.

Since 2022 vs. Indiana state average
Overall vs. IN average 2 Worse Metrics worse than Indiana average:
• Deficiencies per inspection (26% above)
• Inspection deficiency rate (24% above)
8 Better Metrics better than Indiana average:
• Total deficiencies (14% below)
• Deficiencies per year (13% below)
• Total visits (32% below)
• Inspections with deficiencies (14% below)
• Inspections (54% below)
• Total complaints (80% below)
• Complaints per year (77% below)
• Complaint visits (25% below)
Latest Inspection June 13, 2025 Re Inspection

Deficiencies Info Deficiencies are formal regulatory issues recorded during state inspections.

This Facility IN Average vs. IN Avg
Total deficiencies Info Formal regulatory issues recorded by inspectors across all inspection types. 31 36 This facility has 14% fewer total deficiencies than a typical Indiana nursing home (31 vs. IN avg 36).↓ 14% better
Deficiencies per year Info Average deficiencies per year since 2022. 7.8 9 This facility has 13% fewer deficiencies per year than a typical Indiana nursing home (7.8 vs. IN avg 9).↓ 13% better
Deficiencies per inspection Info Average deficiencies per inspection. 2.4 1.9 This facility has 26% more deficiencies per inspection than a typical Indiana nursing home (2.4 vs. IN avg 1.9).↑ 26% worse

Inspections Info State inspections evaluate whether the facility meets health and safety standards.

This Facility IN Average vs. IN Avg
Total visits Info Combined count of all on-site visits — routine inspections, complaint visits, follow-ups, and other focused visits. 13 19 This facility has 32% fewer total visits than a typical Indiana nursing home (13 vs. IN avg 19).↓ 32% better
Inspections with deficiencies Info Inspections that resulted in at least one regulatory deficiency. 6 7 This facility has 14% fewer inspections with deficiencies than a typical Indiana nursing home (6 vs. IN avg 7).↓ 14% better
Inspection deficiency rate Info Percentage of inspections that resulted in at least one deficiency. 46% 37% This facility has 9 percentage points higher inspection deficiency rate than a typical Indiana nursing home (46% vs. IN avg 37%).↑ 9% worse
Inspections Info Routine, scheduled inspections conducted by state regulators. 6 13 This facility has 54% fewer inspections than a typical Indiana nursing home (6 vs. IN avg 13).↓ 54% better

Complaints & Investigations Info Complaints are formal concerns filed by residents, families, or staff. Investigations are on-site follow-ups.

This Facility IN Average vs. IN Avg
Total complaints Info Formal expressions of concern made by residents, families, or staff. 1 5 This facility has 80% fewer total complaints than a typical Indiana nursing home (1 vs. IN avg 5).↓ 80% better
Complaints per year Info Average complaints per year since 2022. 0.3 1.3 This facility has 77% fewer complaints per year than a typical Indiana nursing home (0.3 vs. IN avg 1.3).↓ 77% better
Complaint visits Info On-site visits triggered by formal complaints. Formal complaints can result in multiple visits. 6 8 This facility has 25% fewer complaint visits than a typical Indiana nursing home (6 vs. IN avg 8).↓ 25% better

Inspection Reports Summary Info An editor-reviewed summary of the themes and findings across this facility's recent inspection reports.

The most recent inspection on June 13, 2025, found the facility generally in compliance with Life Safety Code requirements but cited one deficiency related to the clear width of exit and exit access doors. Earlier inspections showed a pattern of deficiencies primarily involving Life Safety Code issues such as exit door widths and emergency preparedness, as well as care-related concerns including medication management, infection control, and care planning. Complaint investigations were mostly unsubstantiated or found no deficiencies, except for one substantiated complaint that did not result in cited deficiencies. No fines, immediate jeopardy findings, or license actions were listed in the available reports. The facility’s inspection history shows some improvement in Life Safety Code compliance over time, although care-related deficiencies appeared in the middle of the timeline before being addressed in follow-up visits.

Read the full inspection reports for this facility, including detailed findings and corrective actions.

Show Inspection Reports

Health Inspection History

Inspections Since 2022
Total health inspections 3

Indiana average 6


Last Health inspection on Apr 2025

Total health citations
19 Rank #117 / 288Health citations — State benchmarkedThis home is ranked 117th out of 288 homes in Indiana. Shows this facility's total health deficiency citations benchmarked to the Indiana State average, with a ranking across all 288 IN SNFs. Lower citation counts earn a better rank.Click the rank badge to see the full State ranking.Click here to see the full State ranking.

Indiana average 25

Citations per inspection
6.33 Rank #242 / 288Citations per inspection — State benchmarkedThis home is ranked 242nd out of 288 homes in Indiana. Shows average deficiency citations per CMS inspection for this facility versus the Indiana mean across 288 SNFs with citation data. Lower is better.Click the rank badge to see the full State ranking.Click here to see the full State ranking.

Indiana average 4.12


Health citations are formal notices following inspections when they fail to comply with safety and care standards.

18 of 19 citations resulted from standard inspections; and 1 of 19 came from combined inspections (standard and complaint).

Breakdown of citation severity (last 4 years)
Critical Health citations
0
100% better than Indiana average

Indiana average: 0.2


Serious Health citations
1 Rank #1 / 108Serious citations (G–I) — State benchmarkedThis home is ranked 1st out of 108 homes in Indiana. Shows G–I scope serious health citations for this facility versus other Indiana SNFs. Lower counts rank better.Click the rank badge to see the full State ranking.Click here to see the full State ranking.
67% worse than Indiana average

Indiana average: 0.6

0 critical citations Indiana average: 0.2

1 serious citation Indiana average: 0.6

17 moderate citations Indiana average: 23.8

1 minor citation Indiana average: 0.4
Citations history (last 4 years)
Infection Control moderate citation Apr 01, 2025
Corrected

Nursing Services moderate citation Apr 01, 2025
Corrected

Nutrition moderate citation Apr 01, 2025
Corrected

Nutrition moderate citation Apr 01, 2025
Corrected

Staffing Data

Reporting period: April 1 – June 30, 2025 (Q2 2025). Source: CMS Payroll-Based Journal report.

Total staff 154
Employees 76
Contractors 78
Staff to resident ratio 2.96:1
2961438% better than Indiana average
Indiana average ratio: 0.00:1 Indiana average ratio: 0.00:1See full Indiana ranking
Avg staff/day 32
Average shift 7.1 hours
8% worse than Indiana average
Indiana average: 7.7 hours Indiana average shift: 7.7 hoursSee full Indiana ranking
Total staff hours (quarter) 20,754

Nursing staff breakdown

Q2 2025 · Apr 1 – Jun 30 More info This data comes from the CMS Payroll-Based Journal report covering April 1 – June 30, 2025.
Registered Nurse

Manages medical care and health needs.

Total count 17
Average shift length Info Average shift length. Calculated as total hours divided by days worked and average staff per day. 8 hours

This role is partially covered by contractors.

Licensed Practical Nurse

Assists with medical care and medications.

Total count 27
Average shift length Info Average shift length. Calculated as total hours divided by days worked and average staff per day. 7.9 hours

This role is partially covered by contractors.

Certified Nursing Assistant

Helps with daily care and mobility.

Total count 62
Average shift length Info Average shift length. Calculated as total hours divided by days worked and average staff per day. 7.5 hours

This role is partially covered by contractors.

Contractor staffing

Q2 2025 · Apr 1 – Jun 30 More info This data comes from the CMS Payroll-Based Journal report covering April 1 – June 30, 2025.

Total hours from contractors

10.4%

2,163 contractor hours this quarter

Certified Nursing Assistant: 38 Licensed Practical Nurse: 18 Registered Nurse: 11 Medication Aide/Technician: 9 Mental Health Service Worker: 1 Medical Director: 1

Staff by category

Q2 2025 · Apr 1 – Jun 30 More info This data comes from the CMS Payroll-Based Journal report covering April 1 – June 30, 2025.
Certified Nursing Assistant 24 38 62 7,936 91 100% 7.5
Licensed Practical Nurse 9 18 27 3,397 91 100% 7.9
Registered Nurse 6 11 17 1,708 91 100% 8
Clinical Nurse Specialist 4 0 4 1,538 68 75% 8.1
Medication Aide/Technician 4 9 13 952 82 90% 7
Nurse Aide in Training 4 0 4 820 74 81% 6.2
Dietitian 3 0 3 727 76 84% 7.2
Dental Services Staff 2 0 2 655 60 66% 7.2
Mental Health Service Worker 1 1 2 613 74 81% 7.3
Nurse Practitioner 1 0 1 523 59 65% 8.9
Administrator 1 0 1 464 63 69% 7.4
Speech Language Pathologist 4 0 4 383 81 89% 3.8
Respiratory Therapy Technician 4 0 4 338 72 79% 4
Physical Therapy Assistant 4 0 4 265 74 81% 3.4
Physical Therapy Aide 2 0 2 252 59 65% 4.3
Qualified Social Worker 2 0 2 142 61 67% 2.3
Medical Director 0 1 1 28 11 12% 2.5
Qualified Activities Professional 1 0 1 15 4 4% 3.7
62 Certified Nursing Assistant
% of Days 100%
27 Licensed Practical Nurse
% of Days 100%
17 Registered Nurse
% of Days 100%
4 Clinical Nurse Specialist
% of Days 75%
13 Medication Aide/Technician
% of Days 90%
4 Nurse Aide in Training
% of Days 81%
3 Dietitian
% of Days 84%
2 Dental Services Staff
% of Days 66%
2 Mental Health Service Worker
% of Days 81%
1 Nurse Practitioner
% of Days 65%
1 Administrator
% of Days 69%
4 Speech Language Pathologist
% of Days 89%
4 Respiratory Therapy Technician
% of Days 79%
4 Physical Therapy Assistant
% of Days 81%
2 Physical Therapy Aide
% of Days 65%
2 Qualified Social Worker
% of Days 67%
1 Medical Director
% of Days 12%
1 Qualified Activities Professional
% of Days 4%

Penalties and fines

Federal penalties imposed by CMS for regulatory violations, including civil money penalties (fines) and denials of payment for new Medicare/Medicaid admissions.

Source: CMS Penalties Database

No penalties in the past 3 years

No civil money penalties or payment denials were reported in the last 3 years.

Quality of care over time

These measures show how residents usually do over time at this home, based on health outcomes and preventive care.

High-risk clinical events score Info A composite score based on pressure ulcers, falls with injury, weight loss, walking ability decline, and activities of daily living decline. 13.1
64% worse than Indiana average

Indiana average: 8.0

Functional decline score Info A composite score based on activities of daily living decline, walking ability decline, and incontinence. 26.4
55% worse than Indiana average

Indiana average: 17.1

Long-stay resident measures
Below average Indiana avg: 4.1 Info CMS star rating based on long-stay quality measure performance. 5 stars = significantly above average, 1 star = significantly below average.
Need for Help with Daily Activities Increased Info Percent of long-stay residents whose need for help with daily activities has increased 25.8%
114% worse than Indiana average

Indiana average: 12.0%

Walking Ability Worsened Info Percent of long-stay residents whose ability to move independently worsened 23.2%
62% worse than Indiana average

Indiana average: 14.4%

Low Risk Residents with Bowel/Bladder Incontinence Info Percent of low risk long-stay residents who lose control of their bowels or bladder 30.2%
23% worse than Indiana average

Indiana average: 24.6%

Falls with Major Injury Info Percent of long-stay residents experiencing one or more falls with major injury 3.7%
In line with Indiana average

Indiana average: 3.9%

High Risk Residents with Pressure Ulcers Info Percent of long-stay high risk residents with pressure ulcers 7.1%
62% worse than Indiana average

Indiana average: 4.4%

Urinary Tract Infection Info Percent of long-stay residents with a urinary tract infection 8.5%
602% worse than Indiana average

Indiana average: 1.2%

Lost Too Much Weight Info Percent of long-stay residents who lose too much weight 5.8%
In line with Indiana average

Indiana average: 5.7%

Depressive Symptoms Info Percent of long-stay residents who have depressive symptoms 7.8%
68% better than Indiana average

Indiana average: 24.1%

Antipsychotic Use Info Percent of long-stay residents who received an antipsychotic medication 13.0%
In line with Indiana average

Indiana average: 12.4%

Pneumococcal Vaccine Info Percent of long-stay residents assessed and appropriately given the pneumococcal vaccine 92.6%
In line with Indiana average

Indiana average: 93.7%

Influenza Vaccine Info Percent of long-stay residents assessed and appropriately given the seasonal influenza vaccine 100.0%
5% better than Indiana average

Indiana average: 95.4%

Hospitalizations per 1,000 days Info Number of hospitalizations per 1,000 long-stay resident days. 2.05
28% worse than Indiana average

Indiana average: 1.60

ED visits per 1,000 days Info Number of outpatient emergency department visits per 1,000 long-stay resident days. 1.70
15% worse than Indiana average

Indiana average: 1.48

Short-stay resident measures
Average Indiana avg: 2.9 Info CMS star rating based on short-stay quality measure performance. 5 stars = much above average, 1 star = much below average.
Pneumococcal Vaccine Info Percent of short-stay residents assessed and appropriately given the pneumococcal vaccine 72.9%
11% worse than Indiana average

Indiana average: 81.7%

Antipsychotic medication increase Info Percent of short-stay residents who newly received an antipsychotic medication 0.9%
34% better than Indiana average

Indiana average: 1.4%

Influenza Vaccine Info Percent of short-stay residents assessed and appropriately given the seasonal influenza vaccine 60.0%
24% worse than Indiana average

Indiana average: 79.0%

Re-hospitalized after SNF stay Info Percentage of short-stay residents who were re-hospitalized after their nursing home admission. 34.2%
53% worse than Indiana average

Indiana average: 22.4%

Emergency department visits Info Percentage of short-stay residents who had an outpatient emergency department visit. 12.1%
15% worse than Indiana average

Indiana average: 10.5%

Falls with major injury Info Percentage of SNF residents who experience falls with major injury during their stay. 0.0%
100% better than Indiana average

Indiana average: 0.8%

Ability to care for self at discharge Info Percentage of residents at or above expected ability to care for themselves at discharge. 51.1%
5% worse than Indiana average

Indiana average: 53.7%

Successful return to home or community Info Rate of successful return to home or community from a skilled nursing facility. 61.1%
21% better than Indiana average

Indiana average: 50.6%

Breakdown by payment type

Medicare

77% of new residents, usually for short-term rehab.

Typical stay 1 - 2 months

Private pay

19% of new residents, often for short stays.

Typical stay 4 years

Medicaid

4% of new residents, often for long-term daily care.

Typical stay 5 years

Facility Characteristics

Source: CMS Long-Term Care Facility Characteristics (Data as of Jan 2026)

Total residents 52
Medicare
12
23.1% of residents
Medicaid
12
23.1% of residents
Private pay or other
28
53.8% of residents
Programs & Services
Residents Group

Residents meet regularly to discuss policies, care quality, and activities

Family Member Group

Family members meet regularly to discuss policies, care quality, and activities

CCRC

Part of a Continuing Care Retirement Community offering multiple care levels

Active Family Council

Organized group of family members that meets regularly to discuss facility policies, resident care, and activities.

Active Resident Council

Organized group of residents that meets regularly to discuss facility policies, quality of life, and activities.

Finances and operations

Voluntary non-profit community
Operated by a church.
Home revenue
$7.7M
Operating deficit
-$93.3K
Voluntary non-profit community Operated by a church.
Home revenue
$7.7M Rank #214 / 290Revenue — State benchmarkedThis home is ranked 214th out of 290 homes in Indiana. Shows this facility's annual revenue compared to the Indiana SNF average. Higher revenue generally means more resources for staffing and capital — read alongside Payroll %.Click the rank badge to see the full State ranking.Click here to see the full State ranking.
Operating deficit
-$93.3K
Payroll costs Info The portion of the home's budget spent on staff, including nurses, caregivers, and other employees who support care and operations. Rank #128 / 290Payroll — State benchmarkedThis home is ranked 128th out of 290 homes in Indiana. Shows total annual staff payroll benchmarked to the Indiana average. Higher payroll investment relative to peers often signals better staffing and less reliance on cheaper contract labor.Click the rank badge to see the full State ranking.Click here to see the full State ranking.
$5.6M
73.3% of revenue Rank #14 / 290Payroll % — State benchmarkedThis home is ranked 14th out of 290 homes in Indiana. Shows payroll as a percentage of revenue versus the Indiana average. Well-run Indiana SNFs typically land around 54–68% — the top third Statewide. Below 25% may signal understaffing or heavy agency use — read with Staffing ratings.Click the rank badge to see the full State ranking.Click here to see the full State ranking.
Other operating costs Info All remaining costs needed to run the home, such as food, utilities, building maintenance, supplies and administrative expenses.
-$2.8M
Total costs $2.9M

Who this home usually serves

TYPE OF STAY

Mostly short-term rehab stays

Most residents typically stay for a few weeks or months before returning home or moving on.

Places of interest near Evansville Protestant Home

Address 4.1 miles from city center Info Estimated distance in miles from Evansville's city center to Evansville Protestant Home's address, calculated via Google Maps. — 0.25 miles to nearest hospital (St. Vincent Evansville Heart Institute)

Calculate Travel Distance to Evansville Protestant Home

Add your location

Address

Financial Assistance for
Nursing Home in Indiana

Evansville Protestant Home is located in Evansville, Indiana.
Here are the financial assistance programs available to residents in Indiana.

Get Financial aid guidance

Aged and Disabled Waiver

Indiana Medicaid A&D Waiver

Age 65+ or disabled
General Indiana resident, Medicaid-eligible, nursing home-level care need.
Income Limits (2025) ~$2,829/month 300% FBR, individual
Asset Limits $2,000 (individual), $3,000 (couple).
IN

Requires level-of-care determination.

Benefits
Personal care (5-7 hours/day) Respite (240 hours/year) Adult day care (~$60/day) Home health services

CHOICE Program

Indiana CHOICE

Age 60+
General Indiana resident, at risk of nursing home.
Income Limits ~$2,000/month varies
Asset Limits $10,000 individual
IN

Limited funding; regional variation.

Benefits
In-home care (3-5 hours/week) Respite (up to 10 days/year) Transportation (~5 trips/month)

Residential Care Assistance Program (RCAP)

Indiana Residential Care Assistance Program

Age 65+
General or blind, or disabled, Indiana resident, in approved facility, low-income or SSI recipient.
Income Limits (2025) ~$1,004/month including SSI
Asset Limits $2,000 (individual), $3,000 (couple).
IN

~50 facilities statewide; per diem rate set by FSSA.

Benefits
Room/board Laundry Minimal care coordination (~$20-$50/day subsidy)

Medicare Savings Program (MSP)

Indiana Medicare Savings Program

Age 65+ or disabled
General Indiana resident, Medicare Part A/B.
Income Limits (2025) ~$2,510/month (QMB), ~$3,380/month (SLMB), ~$3,598/month (QI)—individual.
Asset Limits $9,430 (individual), $14,130 (couple).
IN

Three tiers; no waitlist.

Benefits
Covers Part B premiums ($174.70/month) Deductibles ($240/year) Copays (~20%)

National Family Caregiver Support Program (NFCSP) Respite

Indiana NFCSP Respite Care

Age
General Caregivers of 60+ needing care or 55+ caregivers of others; Indiana resident; functional needs (2+ ADLs).
Income Limits (2025) Prioritizes ~$24,980/year (individual); no strict cap.
Asset Limits Not assessed; need-based.
IN

16 AAAs; prioritizes low-income, rural caregivers.

Benefits
Respite (4-6 hours/week or 5 days/year) Adult day care ($60/day) Caregiver training

VA Aid and Attendance (A&A) and Housebound Benefits

Indiana VA Aid and Attendance/Housebound

Age 65+ or disabled veteran/spouse
General Indiana resident, wartime service, need for ADL help (A&A) or homebound.
Income Limits (2025) Net income < ~$1,984/month (veteran with dependent, A&A); pension offsets income.
Asset Limits ~$155,356 net worth limit
IN

High veteran demand statewide.

Benefits
Cash (~$1,433-$2,642/month veteran, ~$951-$1,318 spouse) for care costs (e.g., in-home, assisted living)

Compare Nursing Home around Evansville

2 facilities compared · CMS & IN Dept. of Health data

Filter by care type
North River Health Campus
NH

Nursing Home Licensed facility providing 24/7 skilled nursing care for residents with complex, ongoing medical needs. Staffed by RNs, LPNs, and CNAs. Inspected and star-rated annually by CMS. Accepts Medicare (short-term rehab) and Medicaid (long-term care).

AL

Assisted Living A licensed, long-term care setting for seniors or individuals with disabilities who need help with daily activities — like bathing, dressing, and medication management — but not 24-hour skilled nursing. Offers housing, meals, and around-the-clock support while aiming to maximize resident independence.

IL

Independent Living Lifestyle-focused communities for older adults offering dining, activities, and transportation with minimal personal care. Best for active, independent seniors who want community without medical support.

MC

Memory Care Secured, specialized care for people living with Alzheimer's or dementia. Staff trained in cognitive impairment, with higher staff-to-resident ratios and an environment designed to reduce confusion and wandering risk.

Evansville (East Baseline Road) 95 82.1% +18% 3.66 +67% +7% $3.3k 10 3.3 - 47 A+ 11 Thomas Cook $12.0M $6.4M 53.4% 155854
Evansville Protestant Home
NH

Nursing Home Licensed facility providing 24/7 skilled nursing care for residents with complex, ongoing medical needs. Staffed by RNs, LPNs, and CNAs. Inspected and star-rated annually by CMS. Accepts Medicare (short-term rehab) and Medicaid (long-term care).

Evansville 231 33.8% -51% 5.09 +16% +48% $0 19 6.3 1 39 A+ 56 Evansville Protestant Home Inc $7.7M $5.6M 73.3% 155768

Frequently Asked Questions about Evansville Protestant Home

Who is the Director of Nursing at Evansville Protestant Home?

Tammy Carroll is the Director of Nursing at Evansville Protestant Home.

Who is the owner of Evansville Protestant Home?

The legal owner and operator of Evansville Protestant Home is Henry County Memorial Hospital.

Is Evansville Protestant Home in a walkable area?

Evansville Protestant Home has a walk score of 56. Moderately walkable. Some errands can be accomplished on foot, with a mix of nearby amenities.

What is the license number of Evansville Protestant Home?

According to IN state health department records, Evansville Protestant Home's license number is 25-001125-1.

When does Evansville Protestant Home's license expire?

According to IN state health department records, Evansville Protestant Home's license expires on December 31, 2025.

What is the occupancy rate at Evansville Protestant Home?

Evansville Protestant Home's occupancy is 17%.

Who is the administrator of Evansville Protestant Home?

Anna Perry is the administrator of Evansville Protestant Home.

Guides for Better Senior Living

Care Cost Calculator: See Prices in Your Area

Nursing Home Data Explorer

Don’t Wait Too Long: 7 Red Flag Signs Your Parent Needs Assisted Living Now

The True Cost of Assisted Living in 2025 – And How Families Are Paying For It

Understanding Senior Living Costs: Pricing Models, Discounts & Financial Assistance

Explore Open Rooms
1 Contact details
2 What type of senior care service are you looking for?
3 What budget do you have in mind for senior care?
4 How soon do you need to find care?
5 Additional details

Thank you for your interest!

Our team will be in touch shortly to help with next steps.