


Evergreen Valley Assisted Living
Evergreen Valley Assisted Living
Evergreen Valley Assisted Living accepts Medicaid.
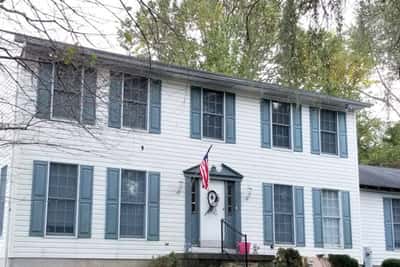
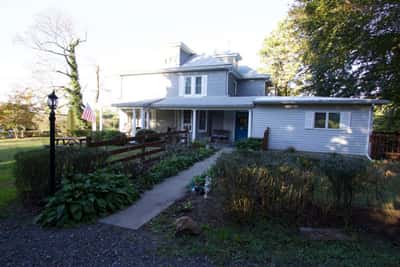
Experience an idyllic retirement experience in a Victorian setting at Evergreen Valley Assisted Living, an exceptional senior living community in Hamilton, MD that offers assisted living to residents who wish to maintain their independence. Residents are free to choose from an array of carefully designed private and semi-private accommodations that foster independence, comfort and security. Individualized care plans are overseen by a registered nurse, making sure residents receive the care and support that aligns with their needs, along with dedicated caregivers that provide support with residents’ daily routines.
A variety of regularly conducted activities and entertainment opportunities are available to make sure residents have plenty of options for recreation, learning, or entertainment. Committed to making sure residents stay healthy, the community also provides three nutritious and delicious meals. With convenient access to respite care, physical therapy, and a wide array of fitness programs, residents are guaranteed to maintain their strength and capabilities to continue living the lifestyle they want.
12-bed community Rank #288 / 685Bed count — State benchmarkedThis home is ranked 288th out of 685 homes in Maryland for bed count. Shows this facility's certified or reported bed count compared to other Maryland facilities. Larger communities may offer more amenities, programs, and on-site services for residents and families.Facilities with the same value for a metric share the same rank. Rankings are based only on facilities in Maryland that report data for that category. Facilities without available data are excluded from the ranking.Click the rank badge to see the full State ranking.Click here to see the full State ranking.
A smaller, more intimate setting that may offer a quieter environment and closer staff-resident interactions.
31 years in operation Rank #39 / 210Years in operation — State benchmarkedThis home is ranked 39th out of 210 homes in Maryland for years in operation. Shows how long this facility has been in operation compared to other Maryland facilities. Longer operating histories may benefit residents, families, and staff.Facilities with the same value for a metric share the same rank. Rankings are based only on facilities in Maryland that report data for that category. Facilities without available data are excluded from the ranking.Click the rank badge to see the full State ranking.Click here to see the full State ranking.
A longer operating history, which may indicate experience navigating regulations and delivering ongoing care.
Walk Score: 88 / 100 Rank #39 / 985Walk Score — State benchmarkedThis home is ranked 39th out of 985 homes in Maryland for walk score. Shows how walkable this facility's neighborhood is compared to the average walk score across Maryland facilities. Higher scores benefit residents, families, and staff.Facilities with the same value for a metric share the same rank. Rankings are based only on facilities in Maryland that report data for that category. Facilities without available data are excluded from the ranking.Click the rank badge to see the full State ranking.Click here to see the full State ranking.
Very walkable. Most errands can be accomplished on foot, and many essentials are within a short walk.
About this community
Facility TypeAssisted Living
CountyBaltimore City
Private Room
$83 - $83 per day
Semi-Private Room
$67 - $67 per day
Hospice Affiliations
Mild Alzheimer's Level
Moderate Alzheimer's Level
No severe Alzheimer's level
Demographics
Resident demographic information for this facility.
Gender
- Female 50%
- Male 50%
Age Distribution
- 65-74 50%
- 75-84 33.3%
- ≤64 16.7%
Ethnicity
- White 75%
- African American 25%
Infection Prevention & Vaccination
How this facility protects residents through staff vaccination policies and immunization practices.
Influenza Gold Star
Awarded by the Maryland Health Care Commission (MHCC) to healthcare facilities that achieve a high influenza vaccination rate.
Mandatory Vaccination Policy
The facility requires certain vaccinations for staff as part of its infection prevention measures.
Mandatory COVID Policy
The facility requires COVID-19 vaccination for staff.
What does this home offer?
No pets allowed
Housing Options: Private Rooms / Semi-Private Rooms
Building Type: Two-story

3 Nutritious Meals per Day

Free Parking Available

Engaging Activities

Medication Management
Places of interest near Evergreen Valley Assisted Living
![]() 5.5 miles from city center
5.5 miles from city center
![]() Estimated distance in miles from Baltimore's city center to Evergreen Valley Assisted Living's address, calculated via Google Maps.
Estimated distance in miles from Baltimore's city center to Evergreen Valley Assisted Living's address, calculated via Google Maps.
Calculate Travel Distance to Evergreen Valley Assisted Living
Add your location
Compare Assisted Living around Baltimore
Info below is compiled from the MD Dept. of Health (OHCQ), senior community websites & trusted data sources such as Walk Score & BBB.
Communities are listed from highest to lowest based on our ranking methodology.
| Pickersgill Retirement Community | AL IL NH SNF | Baltimore (Chestnut Hill) | 138
Facility
138
MD AVG
42
Rank
#55 / 685 | No |
45
Facility
45
MD AVG
43
Rank
#475 / 985 | - | - | A+ |
24% Male Residents — State Benchmarked 24% of residents are male, compared to the Maryland average of 31%. This facility caters to a majority female resident pool (76% female), consistent with the broader assisted living trend where women significantly outnumber men. |
76% Female Residents — State Benchmarked 76% of residents are female, compared to the Maryland average of 69%. Women comprise the large majority, consistent with national assisted living demographics where women live longer and enter care facilities at higher rates. |
95% White Residents — State Benchmarked 95% of residents are reported as White, compared to the Maryland average of 81%. A higher White share than is typical for assisted living in Maryland in this dataset — compare with peer facilities for local context. |
1% African American Residents — State Benchmarked 1% of residents are reported as African American or Black, compared to the Maryland average of 13%. A lower African American share than is typical in Maryland; local markets still vary widely. |
4% Other Ethnicity Residents — State Benchmarked 4% of residents fall into categories other than White or African American (combined), compared to the Maryland average of 6%. This column aggregates Hispanic, Asian, multiracial, and any other labeled groups that are not classified as White or African American. Reported subgroups in this total: Asian (4%). |
3% Residents Age 65–74 — State Benchmarked 3% of residents are 65–74, compared to the Maryland average of 13%. Fewer younger seniors suggests the resident population skews older, likely requiring higher acuity care and more hands-on support. |
27% Residents Age 75–84 — State Benchmarked 27% of residents are 75–84, compared to the Maryland average of 31%. This is the second most common age bracket in assisted living, representing residents with moderate care needs. |
55% Residents Age 85–94 — State Benchmarked 55% of residents are 85–94, compared to the Maryland average of 44%. A high concentration of very elderly residents signals a higher-acuity facility with experience caring for advanced age-related needs. |
15% Residents Age 95+ — State Benchmarked 15% of residents are 95 or older, compared to the Maryland average of 16%. In line with the statewide profile for the oldest resident bracket. |
| Morningside House At Satyr Hill | AL HOS MC RC | Parkville (Woodcroft) | 125
Facility
125
MD AVG
42
Rank
#68 / 685 | Yes |
72
Facility
72
MD AVG
43
Rank
#160 / 985 | Private Rooms / Semi-Private Rooms | 28
Facility
28
MD AVG
21
Rank
#53 / 210 | A+ |
34% Male Residents — State Benchmarked 34% of residents are male, compared to the Maryland average of 31%. This facility caters to a majority female resident pool (66% female), consistent with the broader assisted living trend where women significantly outnumber men. |
66% Female Residents — State Benchmarked 66% of residents are female, compared to the Maryland average of 69%. Women comprise the large majority, consistent with national assisted living demographics where women live longer and enter care facilities at higher rates. |
98% White Residents — State Benchmarked 98% of residents are reported as White, compared to the Maryland average of 81%. A higher White share than is typical for assisted living in Maryland in this dataset — compare with peer facilities for local context. |
2% African American Residents — State Benchmarked 2% of residents are reported as African American or Black, compared to the Maryland average of 13%. A lower African American share than is typical in Maryland; local markets still vary widely. |
0% Other Ethnicity Residents — State Benchmarked 0% of residents fall into categories other than White or African American (combined), compared to the Maryland average of 6%. This column aggregates Hispanic, Asian, multiracial, and any other labeled groups that are not classified as White or African American. |
13% Residents Age 65–74 — State Benchmarked 13% of residents are 65–74, compared to the Maryland average of 13%. In line with the statewide profile for this youngest senior bracket in assisted living. |
40% Residents Age 75–84 — State Benchmarked 40% of residents are 75–84, compared to the Maryland average of 31%. A high concentration in this mid-range bracket, where residents typically need moderate support with daily activities. |
29% Residents Age 85–94 — State Benchmarked 29% of residents are 85–94, compared to the Maryland average of 44%. The population here skews younger than the statewide norm, which may indicate a more active, lower-acuity community. |
16% Residents Age 95+ — State Benchmarked 16% of residents are 95 or older, compared to the Maryland average of 16%. In line with the statewide profile for the oldest resident bracket. |
| Morningside House of Friendship | AL HOS MC RC | Hanover | 103
Facility
103
MD AVG
42
Rank
#103 / 685 | Yes |
36
Facility
36
MD AVG
43
Rank
#563 / 985 | Studio / 1 Bed / 2 Bed | 33
Facility
33
MD AVG
21
Rank
#25 / 210 | - |
23% Male Residents — State Benchmarked 23% of residents are male, compared to the Maryland average of 31%. This facility caters to a majority female resident pool (77% female), consistent with the broader assisted living trend where women significantly outnumber men. |
77% Female Residents — State Benchmarked 77% of residents are female, compared to the Maryland average of 69%. Women comprise the large majority, consistent with national assisted living demographics where women live longer and enter care facilities at higher rates. |
86% White Residents — State Benchmarked 86% of residents are reported as White, compared to the Maryland average of 81%. Close to the average for this category among assisted living facilities in Maryland with reported race/ethnicity data. |
13% African American Residents — State Benchmarked 13% of residents are reported as African American or Black, compared to the Maryland average of 13%. In line with the Maryland average for African American residents among facilities reporting this breakdown. |
1% Other Ethnicity Residents — State Benchmarked 1% of residents fall into categories other than White or African American (combined), compared to the Maryland average of 6%. This column aggregates Hispanic, Asian, multiracial, and any other labeled groups that are not classified as White or African American. Reported subgroups in this total: Asian (1%). |
8% Residents Age 65–74 — State Benchmarked 8% of residents are 65–74, compared to the Maryland average of 13%. Fewer younger seniors suggests the resident population skews older, likely requiring higher acuity care and more hands-on support. |
35% Residents Age 75–84 — State Benchmarked 35% of residents are 75–84, compared to the Maryland average of 31%. This is the second most common age bracket in assisted living, representing residents with moderate care needs. |
41% Residents Age 85–94 — State Benchmarked 41% of residents are 85–94, compared to the Maryland average of 44%. This is typically the most common age bracket in assisted living — this facility is in line with the statewide norm. |
16% Residents Age 95+ — State Benchmarked 16% of residents are 95 or older, compared to the Maryland average of 16%. In line with the statewide profile for the oldest resident bracket. |
| Brightview Mays Chapel Ridge | AL IL MC | Timonium (Dixon Hill) | 89
Facility
89
MD AVG
42
Rank
#150 / 685 | Yes |
52
Facility
52
MD AVG
43
Rank
#402 / 985 | Studio / 1 Bed / 2 Bed | 50
Facility
50
MD AVG
21
Rank
#1 / 210 | A+ |
13% Male Residents — State Benchmarked 13% of residents are male, compared to the Maryland average of 31%. This facility caters to a majority female resident pool (87% female), consistent with the broader assisted living trend where women significantly outnumber men. |
87% Female Residents — State Benchmarked 87% of residents are female, compared to the Maryland average of 69%. Women comprise the large majority, consistent with national assisted living demographics where women live longer and enter care facilities at higher rates. |
99% White Residents — State Benchmarked 99% of residents are reported as White, compared to the Maryland average of 81%. A higher White share than is typical for assisted living in Maryland in this dataset — compare with peer facilities for local context. |
0% African American Residents — State Benchmarked 0% of residents are reported as African American or Black, compared to the Maryland average of 13%. A lower African American share than is typical in Maryland; local markets still vary widely. |
1% Other Ethnicity Residents — State Benchmarked 1% of residents fall into categories other than White or African American (combined), compared to the Maryland average of 6%. This column aggregates Hispanic, Asian, multiracial, and any other labeled groups that are not classified as White or African American. Reported subgroups in this total: Asian (1%). |
3% Residents Age 65–74 — State Benchmarked 3% of residents are 65–74, compared to the Maryland average of 13%. Fewer younger seniors suggests the resident population skews older, likely requiring higher acuity care and more hands-on support. |
30% Residents Age 75–84 — State Benchmarked 30% of residents are 75–84, compared to the Maryland average of 31%. This is the second most common age bracket in assisted living, representing residents with moderate care needs. |
48% Residents Age 85–94 — State Benchmarked 48% of residents are 85–94, compared to the Maryland average of 44%. This is typically the most common age bracket in assisted living — this facility is in line with the statewide norm. |
18% Residents Age 95+ — State Benchmarked 18% of residents are 95 or older, compared to the Maryland average of 16%. In line with the statewide profile for the oldest resident bracket. |
| Evergreen Valley Assisted Living | AL | Baltimore (Glenham-Belford) | 12
Facility
12
MD AVG
42
Rank
#288 / 685 | No |
88
Facility
88
MD AVG
43
Rank
#39 / 985 | Private Rooms / Semi-Private Rooms | 31
Facility
31
MD AVG
21
Rank
#39 / 210 | - |
50% Male Residents — State Benchmarked 50% of residents are male, compared to the Maryland average of 31%. An unusually high male share for assisted living, where most facilities skew heavily female. |
50% Female Residents — State Benchmarked 50% of residents are female, compared to the Maryland average of 69%. Closer to an even gender split than most assisted living facilities, which typically have 65–75% female residents. |
75% White Residents — State Benchmarked 75% of residents are reported as White, compared to the Maryland average of 81%. Close to the average for this category among assisted living facilities in Maryland with reported race/ethnicity data. |
25% African American Residents — State Benchmarked 25% of residents are reported as African American or Black, compared to the Maryland average of 13%. A higher African American share than the typical Maryland average — useful context when comparing cultural fit and community composition. |
0% Other Ethnicity Residents — State Benchmarked 0% of residents fall into categories other than White or African American (combined), compared to the Maryland average of 6%. This column aggregates Hispanic, Asian, multiracial, and any other labeled groups that are not classified as White or African American. |
50% Residents Age 65–74 — State Benchmarked 50% of residents are 65–74, compared to the Maryland average of 13%. A higher share of younger seniors often signals a more independent, active resident community with lower acuity care needs. |
33% Residents Age 75–84 — State Benchmarked 33% of residents are 75–84, compared to the Maryland average of 31%. This is the second most common age bracket in assisted living, representing residents with moderate care needs. | - | - |
Financial Assistance for
Assisted Living in Maryland
Evergreen Valley Assisted Living is located in Baltimore, Maryland.
Here are the financial assistance programs available to residents in Maryland.
Frequently Asked Questions about Evergreen Valley Assisted Living
What neighborhood is Evergreen Valley Assisted Living in?
Evergreen Valley Assisted Living is in the Glenham-Belford neighborhood of Baltimore.
Is Evergreen Valley Assisted Living in a walkable area?
Evergreen Valley Assisted Living has a walk score of 88. Very walkable. Most errands can be accomplished on foot, and many essentials are within a short walk.
How long has Evergreen Valley Assisted Living been in business?
Evergreen Valley Assisted Living has been operating for approximately 31 years, based on available licensing and registration records.
Are pets allowed at Evergreen Valley Assisted Living?
No, Evergreen Valley Assisted Living has a no-pet policy.
How many beds does Evergreen Valley Assisted Living have?
Evergreen Valley Assisted Living has 12 beds.
What is the address of Evergreen Valley Assisted Living?
Evergreen Valley Assisted Living is located at 3009 Evergreen Ave, Baltimore, MD 21214.
What is the phone number of Evergreen Valley Assisted Living?
(410) 252-3430 will put you in contact with the team at Evergreen Valley Assisted Living.
Guides for Better Senior Living
Care Cost Calculator: See Prices in Your Area
Assisted Living Explorer
Don’t Wait Too Long: 7 Red Flag Signs Your Parent Needs Assisted Living Now
The True Cost of Assisted Living in 2025 – And How Families Are Paying For It
Understanding Senior Living Costs: Pricing Models, Discounts & Financial Assistance
Updated on
