


Total staff
113
Employees
92
Contractors
21
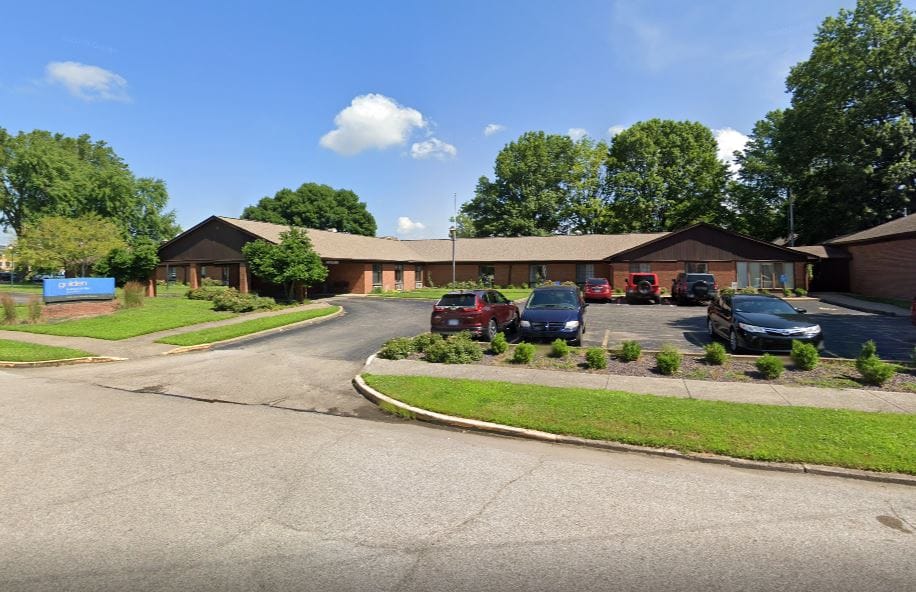
Owned by Ggnsc Evansville Brentwood LLC, Golden Living Center – Brentwood is a skilled nursing home on East Chandler Avenue in Evansville. It sits in a really walkable neighborhood with a Walk Score of 71, so most daily errands and nearby services are walkable. This can be convenient for visiting family members.
The home caters to 114 residents and has an 81 percent occupancy rate. Occupants stay 182 days on average, and they’re a mix of people healing from acute illness or surgery and those in longer-term nursing care. Medicare, Medicaid, and private pay are welcome, offering families multiple pathways to fund short-term rehabilitation and ongoing care. Daily nursing care averages 3 hours 29 minutes per resident, anchored by registered nurses and nursing aides on staff. This level of attentive support underpins Golden Living Center – Brentwood’s approach to resident care.
For families thinking of choosing Golden Living Center – Brentwood, touring in person can provide a fuller sense of its daily rhythm, room options, and care approach.
| Staff type | Hours / Day / Resident | vs state avg |
|---|---|---|
|
Registered Nurse (RN)
| 49m per day | ▲ 23% State avg: 40m per day · National avg: 41m per day |
|
LPN / LVN
| 27m per day | ▼ 42% State avg: 46m per day · National avg: 52m per day |
|
Nurse Aide
| 2h 10m per day | ▼ 4% State avg: 2h 16m per day · National avg: 2h 21m per day |
|
Weekend Total Nursing
| 3h 1m per day | ▼ 7% State avg: 3h 14m per day · National avg: 3h 26m per day |
|
Physical Therapist
| 3m per day | ▼ 30% State avg: 4m per day · National avg: 4m per day |
|
Weekend RN
| 28m per day | ■ Avg State avg: 27m per day · National avg: 29m per day |
Reporting period: October 1 – December 31, 2025 (Q4 2025). Source: CMS Payroll-Based Journal report.
Manages medical care and health needs.
Assists with medical care and medications.
Helps with daily care and mobility.
Total hours from contractors
2,802 contractor hours this quarter
| Certified Nursing Assistant | 39 | 0 | 39 | 15,591 | 92 | 100% | 8 |
| Registered Nurse | 12 | 0 | 12 | 4,551 | 92 | 100% | 9.6 |
| Licensed Practical Nurse | 9 | 0 | 9 | 3,895 | 92 | 100% | 9.6 |
| Medication Aide/Technician | 10 | 0 | 10 | 3,279 | 92 | 100% | 9 |
| Clinical Nurse Specialist | 5 | 5 | 10 | 2,098 | 72 | 78% | 7.9 |
| Other Dietary Services Staff | 8 | 0 | 8 | 1,560 | 92 | 100% | 7.6 |
| Physical Therapy Assistant | 0 | 3 | 3 | 725 | 69 | 75% | 6.5 |
| Mental Health Service Worker | 3 | 0 | 3 | 715 | 62 | 67% | 6.9 |
| Physical Therapy Aide | 0 | 3 | 3 | 599 | 64 | 70% | 6.6 |
| Nurse Practitioner | 1 | 0 | 1 | 480 | 60 | 65% | 8 |
| Speech Language Pathologist | 0 | 2 | 2 | 464 | 61 | 66% | 6.9 |
| Respiratory Therapy Technician | 0 | 2 | 2 | 405 | 59 | 64% | 6.7 |
| Administrator | 1 | 0 | 1 | 384 | 48 | 52% | 8 |
| Dietitian | 1 | 0 | 1 | 324 | 41 | 45% | 7.9 |
| Qualified Social Worker | 0 | 1 | 1 | 322 | 58 | 63% | 5.5 |
| Occupational Therapy Aide | 2 | 1 | 3 | 127 | 56 | 61% | 1.8 |
| Medical Director | 0 | 1 | 1 | 95 | 13 | 14% | 7.3 |
| Occupational Therapy Assistant | 0 | 1 | 1 | 35 | 9 | 10% | 3.8 |
| Dental Services Staff | 1 | 2 | 3 | 28 | 3 | 3% | 7.1 |
Federal penalties imposed by CMS for regulatory violations, including civil money penalties (fines) and denials of payment for new Medicare/Medicaid admissions.
Source: CMS Penalties Database
No penalties in the past 3 years
No civil money penalties or payment denials were reported in the last 3 years.
These measures show how residents usually do over time at this home, based on health outcomes and preventive care.
Indiana average: 8.0
Indiana average: 17.1
Indiana average: 12.0%
Indiana average: 14.4%
Indiana average: 24.6%
Indiana average: 3.9%
Indiana average: 4.4%
Indiana average: 1.2%
Indiana average: 5.7%
Indiana average: 24.1%
Indiana average: 12.4%
Indiana average: 93.7%
Indiana average: 95.4%
Indiana average: 1.60
Indiana average: 1.48
Indiana average: 81.7%
Indiana average: 1.4%
Indiana average: 79.0%
Indiana average: 22.4%
Indiana average: 10.5%
Indiana average: 0.8%
Indiana average: 53.7%
Indiana average: 50.6%
Quality measures are calculated from Minimum Data Set (MDS) assessments. For most measures, lower percentages indicate better care quality.
20% of new residents, usually for short-term rehab.
37% of new residents, often for short stays.
43% of new residents, often for long-term daily care.
Source: CMS Long-Term Care Facility Characteristics (Data as of Jan 2026)
Residents meet regularly to discuss policies, care quality, and activities
Organized group of residents that meets regularly to discuss facility policies, quality of life, and activities.
Data sourced from CMS Long-Term Care Facility Characteristics quarterly report. Payer mix reflects the current resident census by primary payment source.
Historical financial and operational data for Golden Living Center – Brentwood from 2011–2023, based on CMS SNF Cost Reports.
Key figures below are for fiscal year ending in 12/2023.
Based on CMS SNF Cost Report for fiscal year ending in 12/2023.
Most residents stay for extended periods and receive ongoing daily care.
New residents most often arrive under Medicaid (43% of admissions), and a typical Medicaid stay runs around 10 - 11 months.
Coverage residents most often arrive under.
Coverage residents most often leave under.
![]() 0.5 miles from city center
0.5 miles from city center
![]() Estimated distance in miles from Evansville's city center to Golden Living Center – Brentwood's address, calculated via Google Maps.
Estimated distance in miles from Evansville's city center to Golden Living Center – Brentwood's address, calculated via Google Maps.
Add your location
Info below is compiled from CMS reports & the IN Dept. of Health (IDOH), senior community websites & trusted data sources such as Walk Score & BBB.
Communities are listed from highest to lowest based on our ranking methodology.
| North River Health Campus | NH ADC AL IL MC SNF | Evansville (East Baseline Road) | 95
Facility
95
IN AVG
116
Rank
#267 / 433 |
50.5%
Facility
50.5%
IN AVG
65.4
Rank
#336 / 423 | -23% | 3.66
Facility
3.66
IN AVG
3.44
Rank
#72 / 280 | +63% | +7% | $0
Facility
$0
IN AVG
$31.4k
Rank
#1 / 282 | 91
Facility
91
IN AVG
83
Rank
#71 / 392 | 10
Facility
10
IN AVG
25.0
Rank
#41 / 282 | 3.3
Facility
3.3
IN AVG
4.1
Rank
#108 / 282 | - | 48 | A+ |
11
Facility
11
IN AVG
37
Rank
#456 / 587 | Thomas Cook | $10.8MFiscal year ending 12/2023
Facility
$10.8MFiscal year ending 12/2023
IN AVG
$10.7M
Rank
#128 / 282 | $5.8MFiscal year ending 12/2023
Facility
$5.8MFiscal year ending 12/2023
IN AVG
$4.2M
Rank
#97 / 282 | 53.6%Fiscal year ending 12/2023
Facility
53.6%Fiscal year ending 12/2023
IN AVG
42%
Rank
#101 / 282 | 155854 | ||||
| Cypress Grove Rehabilitation Center | NH HOS MC PC RC SNF | Newburgh | 90
Facility
90
IN AVG
116
Rank
#284 / 433 |
88.9%
Facility
88.9%
IN AVG
65.4
Rank
#37 / 423 | +36% | 3.02
Facility
3.02
IN AVG
3.44
Rank
#207 / 280 | +23% | -12% | $0
Facility
$0
IN AVG
$31.4k
Rank
#1 / 282 | 83
Facility
83
IN AVG
83
Rank
#154 / 392 | 15
Facility
15
IN AVG
25.0
Rank
#76 / 282 | 3.0
Facility
3.0
IN AVG
4.1
Rank
#82 / 282 | - | 80 | A+ |
56
Facility
56
IN AVG
37
Rank
#172 / 587 | Brandon Burns | $10.3MFiscal year ending 12/2023
Facility
$10.3MFiscal year ending 12/2023
IN AVG
$10.7M
Rank
#150 / 282 | $5.5MFiscal year ending 12/2023
Facility
$5.5MFiscal year ending 12/2023
IN AVG
$4.2M
Rank
#132 / 282 | 53.8%Fiscal year ending 12/2023
Facility
53.8%Fiscal year ending 12/2023
IN AVG
42%
Rank
#119 / 282 | 155273 | ||||
| River Pointe Health Campus | NH AL RC SNF | Evansville (Galaxy Drive) | 124
Facility
124
IN AVG
116
Rank
#157 / 433 |
46.8%
Facility
46.8%
IN AVG
65.4
Rank
#360 / 423 | -28% | 4.28
Facility
4.28
IN AVG
3.44
Rank
#33 / 280 | -8% | +24% | $0
Facility
$0
IN AVG
$31.4k
Rank
#1 / 282 | 75
Facility
75
IN AVG
83
Rank
#264 / 392 | 19
Facility
19
IN AVG
25.0
Rank
#116 / 282 | 3.8
Facility
3.8
IN AVG
4.1
Rank
#135 / 282 | 1 | 58 | A+ |
52
Facility
52
IN AVG
37
Rank
#199 / 587 | Randall Thompson | $11.6MFiscal year ending 12/2023
Facility
$11.6MFiscal year ending 12/2023
IN AVG
$10.7M
Rank
#103 / 282 | $6.1MFiscal year ending 12/2023
Facility
$6.1MFiscal year ending 12/2023
IN AVG
$4.2M
Rank
#87 / 282 | 52.6%Fiscal year ending 12/2023
Facility
52.6%Fiscal year ending 12/2023
IN AVG
42%
Rank
#125 / 282 | 155723 | ||||
| West River Health Campus | NH ADC AL MC RC SNF | Evansville (Westside) | 131
Facility
131
IN AVG
116
Rank
#138 / 433 |
74.0%
Facility
74.0%
IN AVG
65.4
Rank
#154 / 423 | +13% | 4.56
Facility
4.56
IN AVG
3.44
Rank
#27 / 280 | -1% | +33% | $18.7k
Facility
$18.7k
IN AVG
$31.4k
Rank
#256 / 282 | 73
Facility
73
IN AVG
83
Rank
#292 / 392 | 17
Facility
17
IN AVG
25.0
Rank
#104 / 282 | 2.1
Facility
2.1
IN AVG
4.1
Rank
#34 / 282 | 2 | 97 | A+ |
2
Facility
2
IN AVG
37
Rank
#546 / 587 | Carla Baker | $10.1MFiscal year ending 12/2023
Facility
$10.1MFiscal year ending 12/2023
IN AVG
$10.7M
Rank
#146 / 282 | $5.4MFiscal year ending 12/2023
Facility
$5.4MFiscal year ending 12/2023
IN AVG
$4.2M
Rank
#119 / 282 | 53.1%Fiscal year ending 12/2023
Facility
53.1%Fiscal year ending 12/2023
IN AVG
42%
Rank
#105 / 282 | 155785 | ||||
| Golden Living Center – Brentwood | NH MC RC SNF | Evansville (Blackford's Grove) | 114
Facility
114
IN AVG
116
Rank
#191 / 433 |
82.9%
Facility
82.9%
IN AVG
65.4
Rank
#81 / 423 | +27% | 3.48
Facility
3.48
IN AVG
3.44
Rank
#106 / 280 | +8% | +1% | $0
Facility
$0
IN AVG
$31.4k
Rank
#1 / 282 | - | 17
Facility
17
IN AVG
25.0
Rank
#104 / 282 | 2.8
Facility
2.8
IN AVG
4.1
Rank
#69 / 282 | - | 95 | - |
71
Facility
71
IN AVG
37
Rank
#62 / 587 | Ggnsc Evansville Brentwood LLC | $12.4MFiscal year ending 12/2023
Facility
$12.4MFiscal year ending 12/2023
IN AVG
$10.7M
Rank
#172 / 282 | $5.6MFiscal year ending 12/2023
Facility
$5.6MFiscal year ending 12/2023
IN AVG
$4.2M
Rank
#91 / 282 | 45.6%Fiscal year ending 12/2023
Facility
45.6%Fiscal year ending 12/2023
IN AVG
42%
Rank
#24 / 282 | 155248 |
Golden Living Center – Brentwood is located in Evansville, Indiana.
Here are the financial assistance programs available to residents in Indiana.
Golden Living Center – Brentwood is in the Blackford's Grove neighborhood.
Golden Living Center – Brentwood has a walk score of 71. Very walkable. Most errands can be accomplished on foot, and many essentials are within a short walk.
Golden Living Center – Brentwood's occupancy is 81.0%.
No, Golden Living Center – Brentwood has a no-pet policy.
Golden Living Center – Brentwood is registered as a for-profit.
Yes — there is 1 photo of Golden Living Center – Brentwood in the photo gallery on this page.
Golden Living Center – Brentwood is located at 30 E Chandler Ave, Evansville, IN 47713.
Care Cost Calculator: See Prices in Your Area
Nursing Home Data Explorer
Don’t Wait Too Long: 7 Red Flag Signs Your Parent Needs Assisted Living Now
The True Cost of Assisted Living in 2025 – And How Families Are Paying For It
Understanding Senior Living Costs: Pricing Models, Discounts & Financial Assistance


