Guilford Health Care Center
CMS overall rating Info CMS (the Centers for Medicare & Medicaid Services) is the federal agency that rates nursing home quality. Its Overall Rating runs from 1 to 5 stars, combining health inspections, staffing, and quality measures, with inspections weighted most heavily.

Guilford Health Care Center

CMS overall rating Info CMS (the Centers for Medicare & Medicaid Services) is the federal agency that rates nursing home quality. Its Overall Rating runs from 1 to 5 stars, combining health inspections, staffing, and quality measures, with inspections weighted most heavily.
Calculator: See prices in your area
Guilford Health Care Center accepts Medicare, Medicaid, and private pay.

Overview of Guilford Health Care Center

Guilford Health Care Center is a compassionate and dedicated home for seniors that aims to help them overcome the challenges that come with golden years. The staff is always on the go, providing around-the-clock care and utilizing adaptive and proven clinical methods to deliver exceptional services. With the home’s state-of-the-art facilities and cutting-edge technology, it strives to make the recovery process as smooth and efficient as possible.
The facility offers sign language and oral interpreters, as well as other auxiliary aids, to create a more welcoming environment for residents. Specialized programs such as Fast Track Ortho and Activities in Motion provide therapeutic activities designed to achieve wellness and help residents reach their health goals as well. Their strength training equipment and other resources are designed to help residents achieve a full recovery in the shortest amount of time possible.

(336) 272-9700

Quality ratings

Measured by Centers for Medicare & Medicaid Services (CMS)

Overall rating Info The Overall CMS Rating combines results from health inspections, staffing levels and quality measures. Health inspections carry the most weight. Staffing and quality scores can increase or decrease the final rating based on performance compared to state and national standards.
▼ 64.2% Below NC avg. ▼ 64.2% Below NC avg.NC average: 2.8Click the badge to see the full State ranking.Click here to see the full State ranking.
Health Inspection Info Based on the results of the facility's three most recent standard inspections and any complaint investigations. CMS reviews the number, scope, and severity of deficiencies, with more recent findings weighted more heavily.
▼ 29.2% Below NC avg. ▼ 29.2% Below NC avg.NC average: 2.8Click the badge to see the full State ranking.Click here to see the full State ranking.
Staffing Info Measures average nursing staff hours per resident per day, including Registered Nurses (RNs) and total nursing staff. Ratings are adjusted based on the level of care residents require and are compared to state and national benchmarks.
▼ 62.4% Below NC avg. ▼ 62.4% Below NC avg.NC average: 2.7Click the badge to see the full State ranking.Click here to see the full State ranking.
Quality Measures Info Based on clinical and physical health indicators reported to CMS, such as hospital readmissions, falls, pressure ulcers, and improvements in mobility. These measures reflect how well residents' health needs are being managed.
▲ 26.0% Above NC avg. ▲ 26.0% Above NC avg.NC average: 3.2Click the badge to see the full State ranking.Click here to see the full State ranking.

Staffing hours breakdown

Info Daily nursing hours per resident by staff type, reported to CMS. Higher is generally better — compare this facility to state and national averages to see where staffing stands.

Hours per resident per day — compared to North Carolina state averages

Total nursing care / resident Info This home is ranked 95th out of 97 homes in North Carolina for nurse hours. Total adjusted nursing hours per resident per day, combining RN, LPN, and aide time. CMS adjusts this for case-mix so facilities can be fairly compared.
2h 54m per day
Rank #95 / 97Nurse hours — State benchmarkedThis home is ranked 95th out of 97 homes in North Carolina. Shows adjusted nurse hours per resident per day benchmarked to the North Carolina average, with a ranking across 97 North Carolina facilities. More hours mean more direct care. The national average is about 3.5 hrs; below 3.0 is a red flag.Ranking totals vary by category as each rank only includes facilities that report data for that metric. Homes missing that data point aren't included in the ranking.Click the rank badge to see the full State ranking.Click here to see the full State ranking.
This facility North Carolina avg (3h 59m per day)
vs North Carolina avg
-27%

4 of 6 metrics below state avg

Standout metric Physical Therapist is +67% above state avg
Staff typeHours / Day / Residentvs state avg
Registered Nurse (RN) Info RNs hold the highest nursing license and can assess residents, interpret test results, and direct care plans. More RN hours per day often signals stronger clinical oversight and faster response to health changes. 16m per day ▼ 56% State avg: 37m per day · National avg: 41m per day
LPN / LVN Info Licensed Practical Nurses (LPNs) or Licensed Vocational Nurses (LVNs) deliver routine hands-on care — medication administration, wound dressing, and monitoring vital signs. They work under RN supervision and make up a large share of daily bedside care. 1h 6m per day ▲ 24% State avg: 53m per day · National avg: 52m per day
Nurse Aide Info Certified Nurse Aides (CNAs) provide the most direct day-to-day assistance: bathing, dressing, feeding, and mobility. Nurse aide hours are typically the largest staffing category and directly affect residents' quality of life. 1h 59m per day ▼ 14% State avg: 2h 19m per day · National avg: 2h 20m per day
Weekend Total Nursing Info Combined nursing hours (RN + LPN + Nurse Aide) per resident per day on weekends. Staffing often drops on weekends — this figure reveals whether the facility maintains adequate coverage outside of weekday hours. 3h 8m per day ▼ 9% State avg: 3h 26m per day · National avg: 3h 27m per day
Physical Therapist Info Hours per resident per day provided by licensed Physical Therapists (PTs) or PT Assistants. PT services help residents recover mobility after injury or illness and are especially important for post-acute (short-stay) rehabilitation. 9m per day ▲ 67% State avg: 5m per day · National avg: 4m per day
Weekend RN Info Registered nurse hours specifically on weekends. Facilities sometimes reduce RN presence on Saturdays and Sundays — a low weekend RN figure compared to weekday hours can indicate reduced clinical oversight when most administrative staff are absent. 9m per day ▼ 62% State avg: 24m per day · National avg: 29m per day

Capacity and availability

Medium-capacity home

Offers a balance of services and community atmosphere.

Total beds 110

This home usually has limited availability

Higher occupancy than the North Carolina average: 76.4%
Occupancy rate
92.6% Rank #42 / 271Occupancy rate — State benchmarkedThis home is ranked 42nd out of 271 homes in North Carolina. Shows this facility's occupancy rate versus the North Carolina average, with its Statewide rank out of 271. Higher occupancy signals strong local demand and financial stability.Ranking totals vary by category as each rank only includes facilities that report data for that metric. Homes missing that data point aren't included in the ranking.Click the rank badge to see the full State ranking.Click here to see the full State ranking.
Avg. Length of Stay
151 days
Walk Score
Walk Score: 33 / 100 Rank #280 / 572Walk Score — State benchmarkedThis home is ranked 280th out of 572 homes in North Carolina. Shows how walkable this facility's neighborhood is compared to the average Walk Score across North Carolina facilities. Higher scores benefit residents, families, and staff.Ranking totals vary by category as each rank only includes facilities that report data for that metric. Homes missing that data point aren't included in the ranking.Click the rank badge to see the full State ranking.Click here to see the full State ranking.
Somewhat walkable. A few nearby services may be reachable on foot, but most trips require transportation.

About this community

Therapy & Rehabilitation

1 service
Rehabilitation Services

Amenities & Lifestyle

Specific ProgramsRecovery from Planned Surgeries, Recovery from Accidents & Illnesses

Dining & Nutrition

Food DescriptionRestaurant-style dining where chefs prepare food on demand.

Contact Guilford Health Care Center

Penalties and fines

Federal penalties imposed by CMS for regulatory violations, including civil money penalties (fines) and denials of payment for new Medicare/Medicaid admissions.

Source: CMS Penalties Database

No penalties in the past 3 years

No civil money penalties or payment denials were reported in the last 3 years.

Breakdown by payment type

Medicare

3% of new residents, usually for short-term rehab.

Typical stay 1 - 2 years

Private pay

30% of new residents, often for short stays.

Typical stay 5 - 6 months

Medicaid

67% of new residents, often for long-term daily care.

Typical stay 5 months

Finances and operations

Based on CMS SNF Cost Report for fiscal year ending in 12/2023.

Voluntary non-profit community
Operated by a church.
Net patient revenue Info Net patient revenue — what the home actually collects for resident care, after contractual allowances, bad debt and discounts are subtracted from its gross charges (CMS cost report, Worksheet G-3). It covers resident care only; money the home earns from other sources is shown separately as "Other income."
$14.2M
Net patient income Info Net patient income: net patient revenue minus the home's total operating expenses. A positive figure means it earns more from resident care than it spends to deliver it; a negative figure means the opposite. It excludes non-operating "other income."
-$991.2K
Voluntary non-profit community Operated by a church.
Net patient revenue Info Net patient revenue — what the home actually collects for resident care, after contractual allowances, bad debt and discounts are subtracted from its gross charges (CMS cost report, Worksheet G-3). It covers resident care only; money the home earns from other sources is shown separately as "Other income."
$14.2M Rank #36 / 104Revenue — State benchmarkedThis home is ranked 36th out of 104 homes in North Carolina. Shows this facility's annual revenue compared to the North Carolina average. Higher revenue generally means more resources for staffing and capital — read alongside Payroll %.Ranking totals vary by category as each rank only includes facilities that report data for that metric. Homes missing that data point aren't included in the ranking.Click the rank badge to see the full State ranking.Click here to see the full State ranking.
Net patient income Info Net patient income: net patient revenue minus the home's total operating expenses. A positive figure means it earns more from resident care than it spends to deliver it; a negative figure means the opposite. It excludes non-operating "other income."
-$991.2K
Other income Info Money the home earns outside of resident care — such as investments, grants, rentals and other non-operating sources (CMS cost report, Worksheet G-3). It is tracked separately from net patient revenue: it is not part of that figure, and it is not included in net patient income.
$316.8K
Payroll costs Info Staff salaries plus wage-related costs — benefits such as payroll taxes, health insurance and retirement — from the home's own accounting records (CMS cost report, Worksheet A). Contract or agency labor is counted separately, under other operating costs. Rank #56 / 104Payroll — State benchmarkedThis home is ranked 56th out of 104 homes in North Carolina. Shows total annual staff payroll benchmarked to the North Carolina average. Higher payroll investment relative to peers often signals better staffing and less reliance on cheaper contract labor.Ranking totals vary by category as each rank only includes facilities that report data for that metric. Homes missing that data point aren't included in the ranking.Click the rank badge to see the full State ranking.Click here to see the full State ranking.
$6.2M 43.5% of net patient revenue Info Payroll as a share of revenue: staff salaries and wage-related benefits divided by net patient revenue. A higher figure means more of each revenue dollar goes to staff pay. Rank #89 / 104Payroll % — State benchmarkedThis home is ranked 89th out of 104 homes in North Carolina. Shows payroll as a percentage of revenue versus the North Carolina average. Well-run North Carolina facilities typically land around 49–62% — the top third Statewide. Below 25% may signal understaffing or heavy agency use — read with Staffing ratings.Ranking totals vary by category as each rank only includes facilities that report data for that metric. Homes missing that data point aren't included in the ranking.Click the rank badge to see the full State ranking.Click here to see the full State ranking.
Other operating costs Info Everything it costs to run the home apart from payroll — food, utilities, supplies, maintenance, contract labor and administration. Calculated as total operating expense minus payroll (staff salaries and wage-related benefits).
$9.0M
Total costs Info The home's total operating expense for the year — all the costs of running it, salaries included (CMS cost report, Worksheet G-3).
$15.2M

Who this home usually serves

TYPE OF STAY

Mostly long-term care residents

Most residents stay for extended periods and receive ongoing daily care.

Most new residents arrive under Medicaid (67% of admissions), and a typical Medicaid stay runs around 5 months.
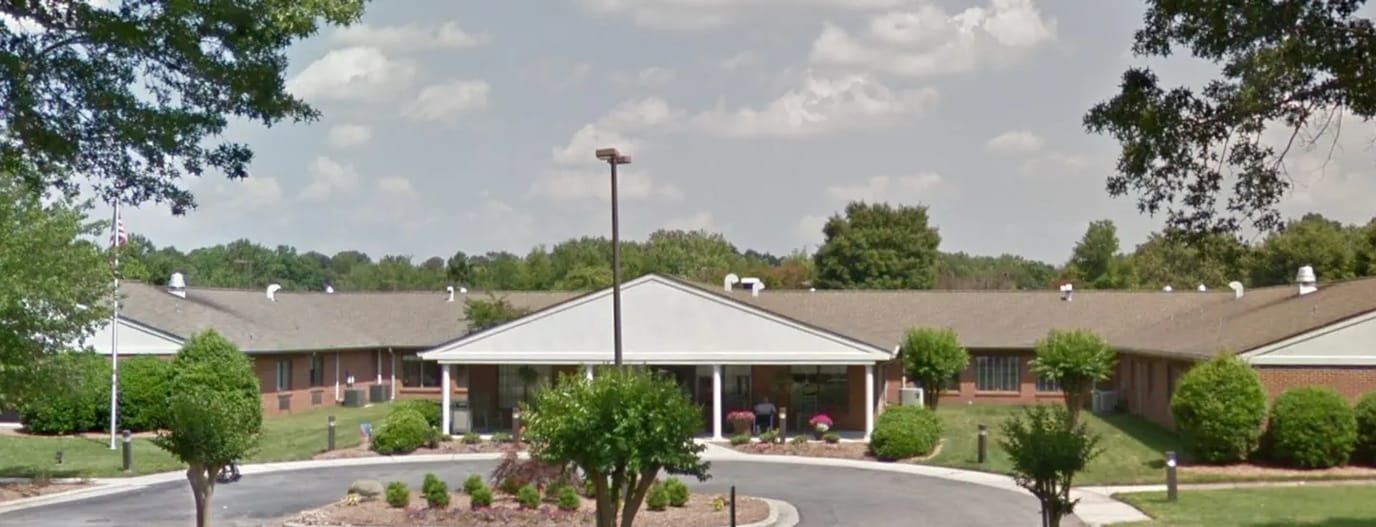
Admissions
224 total

Coverage residents most often arrive under.

Medicare 3%
Private pay 30%
Medicaid 67%
Discharges
247 total

Coverage residents most often leave under.

Medicare 36%
Private pay 20%
Medicaid 44%

Compare Nursing Home around Greensboro

The information below is reported by the North Carolina Department of Health and Human Services, Division of Health Service Regulation.

4 facilities compared · CMS & NC Dept. of Health data

Maryfield Nursing Home
NH
MC
NC
PC
Greensboro
115
Facility 115
NC AVG 72
Rank #55 / 390
85.7%
Facility 85.7%
NC AVG 76.4%
Rank #75 / 271
+12%
4.21
Facility 4.21
NC AVG 3.98
Rank #35 / 97
+3%+6%
$0
Facility $0
NC AVG $74.6k
Rank #1 / 105
1
Facility 1
NC AVG 20.9
Rank #1 / 101
1.0
Facility 1.0
NC AVG 5.0
Rank #1 / 101
-103-
31
Facility 31
NC AVG 33
Rank #294 / 572
Maryfield, Inc.
$31.4M
Facility $31.4M
NC AVG $13.2M
Rank #11 / 104
$16.3M
Facility $16.3M
NC AVG $4.9M
Rank #12 / 104
52%
Facility 52%
NC AVG 39.8%
Rank #69 / 104
345093
Maple Grove Health & Rehabilitation Center
NH
MC
Greensboro
210
Facility 210
NC AVG 72
Rank #2 / 390
41.6%
Facility 41.6%
NC AVG 76.4%
Rank #221 / 271
-46%
3.81
Facility 3.81
NC AVG 3.98
Rank #58 / 97
-7%-4%
$50.3k
Facility $50.3k
NC AVG $74.6k
Rank #81 / 105
24
Facility 24
NC AVG 20.9
Rank #75 / 101
6.0
Facility 6.0
NC AVG 5.0
Rank #80 / 101
3107-
51
Facility 51
NC AVG 33
Rank #137 / 572
-
$11.6M
Facility $11.6M
NC AVG $13.2M
Rank #76 / 104
$5.0M
Facility $5.0M
NC AVG $4.9M
Rank #38 / 104
42.8%
Facility 42.8%
NC AVG 39.8%
Rank #5 / 104
345448
Heartland Living and Rehabilitation
NH
NC
RC
Greensboro
107
Facility 107
NC AVG 72
Rank #67 / 390
67.3%
Facility 67.3%
NC AVG 76.4%
Rank #162 / 271
-12%
4.05
Facility 4.05
NC AVG 3.98
Rank #43 / 97
-80%+2%
$0
Facility $0
NC AVG $74.6k
Rank #1 / 105
12
Facility 12
NC AVG 20.9
Rank #45 / 101
4.0
Facility 4.0
NC AVG 5.0
Rank #49 / 101
-92-
39
Facility 39
NC AVG 33
Rank #231 / 572
Horace Wilson
$11.8M
Facility $11.8M
NC AVG $13.2M
Rank #58 / 104
$4.8M
Facility $4.8M
NC AVG $4.9M
Rank #54 / 104
40.2%
Facility 40.2%
NC AVG 39.8%
Rank #29 / 104
345391
Kindred Hospital Greensboro
NH
Greensboro
23
Facility 23
NC AVG 72
Rank #333 / 390
--
2.85
Facility 2.85
NC AVG 3.98
Rank #95 / 97
-36%-28%
$0
Facility $0
NC AVG $74.6k
Rank #1 / 105
7
Facility 7
NC AVG 20.9
Rank #27 / 101
7.0
Facility 7.0
NC AVG 5.0
Rank #89 / 101
-20-
23
Facility 23
NC AVG 33
Rank #358 / 572
----345273

Financial Assistance for
Nursing Home in North Carolina

Guilford Health Care Center is located in Greensboro, North Carolina.
Here are the financial assistance programs available to residents in North Carolina.

Get Financial aid guidance

Community Alternatives Program for Disabled Adults

NC Medicaid CAP/DA

Age 65+ or disabled
General North Carolina resident, Medicaid- eligible, nursing home-level care need.
Income Limits (2025) ~$2,829/month 300% FBR, individual
Asset Limits $2,000 (individual), $3,000 (couple).
NC

High demand; waitlists common in urban areas.

Benefits
Personal care (5-7 hours/day) Respite (240 hours/year) Adult day care ($60/day) Home modifications ($1,500 avg.)

North Carolina Senior Care Options

NC SCO (via NFCSP)

Age Caregiver of someone 60+ (or with dementia)
General North Carolina resident.
Income Limits No strict limit; prioritizes low-income.
Asset Limits Not applicable.
NC

Limited slots; rural/urban balance.

Benefits
In-home respite (4-6 hours/day) Adult day care (~$60/day) Short-term facility care (up to 5 days)

Program of All-Inclusive Care for the Elderly (PACE)

North Carolina PACE (e.g., PACE of the Triad)

Age 55+
General NC resident (specific counties), NFLOC, safe with PACE support.
Income Limits (2025) ~$2,829/month (Medicaid-eligible); private pay option available.
Asset Limits $2,000 (individual), $3,000 (couple) for Medicaid enrollees.
NC

Available in 10+ counties (e.g., Guilford, Wake); multiple providers (e.g., PACE of the Southern Piedmont).

Benefits
Personal care (5-7 hours/day) Medical care Meals Transportation Respite Therapies

In-Home Aide Services

North Carolina In-Home Aide Services

Age 60+
General NC resident, unable to perform 1+ ADL, at risk of nursing home placement.
Income Limits (2025) No strict cap; prioritizes low-income ~$24,980/year
Asset Limits Not assessed; need-based.
NC

Family can be aides; varies by county funding.

Benefits
Personal care (5-20 hours/week) Meal prep Respite (~5 days/year) Errands

Medicare Savings Program (MSP)

North Carolina Medicare Savings Program

Age 65+ or disabled
General NC resident, Medicare Part A/B.
Income Limits (2025) ~$2,510/month (QMB), ~$3,380/month (SLMB), ~$3,598/month (QI)—individual.
Asset Limits $9,430 (individual), $14,130 (couple).
NC

Three tiers; no waitlist; includes Extra Help for Part D.

Benefits
Covers Part B premiums ($174.70/month) Deductibles ($240/year) Copays (~20%)

VA Aid and Attendance (A&A) and Housebound Benefits

North Carolina VA Aid and Attendance/Housebound

Age 65+ or disabled veteran/spouse
General NC resident, wartime service, need for ADL help (A&A) or homebound.
Income Limits (2025) Net income < ~$1,984/month (veteran with dependent, A&A); pension offsets income.
Asset Limits ~$155,356 net worth limit
NC

High veteran demand in rural/urban areas.

Benefits
Cash (~$1,433-$2,642/month veteran, ~$951-$1,318 spouse) for care costs (e.g., in-home, assisted living)

Urgent Repair Program (URP)

North Carolina Urgent Repair Program

Age 60+ prioritized
General NC resident, homeowner, low-income.
Income Limits (2025) ~$30,258/year 50% AMI, varies by county
Asset Limits Not strictly assessed; home value considered.
NC

Forgivable at $2,000/year; statewide via local partners.

Benefits
Repairs (~$8,000-$12,000 avg.) for safety (e.g., roofs, heating, accessibility)

State/County Special Assistance (SA)

North Carolina Special Assistance

Age 65+ (or disabled)
General NC resident, in licensed adult care home, low-income.
Income Limits (2025) ~$1,255/month (individual, 100% FPL); varies by facility rate.
Asset Limits $2,000 individual
NC

Covers assisted living; counties supplement state funds.

Benefits
Cash (~$1,200-$1,500/month) for room/board; Medicaid covers care services

Frequently Asked Questions about Guilford Health Care Center

Is Guilford Health Care Center in a walkable area?

Guilford Health Care Center has a walk score of 33. Somewhat walkable. A few nearby services may be reachable on foot, but most trips require transportation.

What is the occupancy rate at Guilford Health Care Center?

Guilford Health Care Center's occupancy is 92.6%.

Are there photos of Guilford Health Care Center?

Yes — there are 12 photos of Guilford Health Care Center in the photo gallery on this page.

What is the phone number of Guilford Health Care Center?

(336) 272-9700 will put you in contact with the team at Guilford Health Care Center.

Is Guilford Health Care Center Medicare or Medicaid certified?

Guilford Health Care Center is not currently listed as a CMS-certified provider of Medicare or Medicaid.

Guides for Better Senior Living

Care Cost Calculator: See Prices in Your Area

Nursing Home Data Explorer

Don’t Wait Too Long: 7 Red Flag Signs Your Parent Needs Assisted Living Now

The True Cost of Assisted Living in 2025 – And How Families Are Paying For It

Understanding Senior Living Costs: Pricing Models, Discounts & Financial Assistance