Total health inspections
3
Virginia average 4.2
Last Health inspection on Jan 2022

We arrange tours, appointments, and even moving support so you don’t have to
Thank you for your interest!
Our team will be in touch shortly to help with next steps.
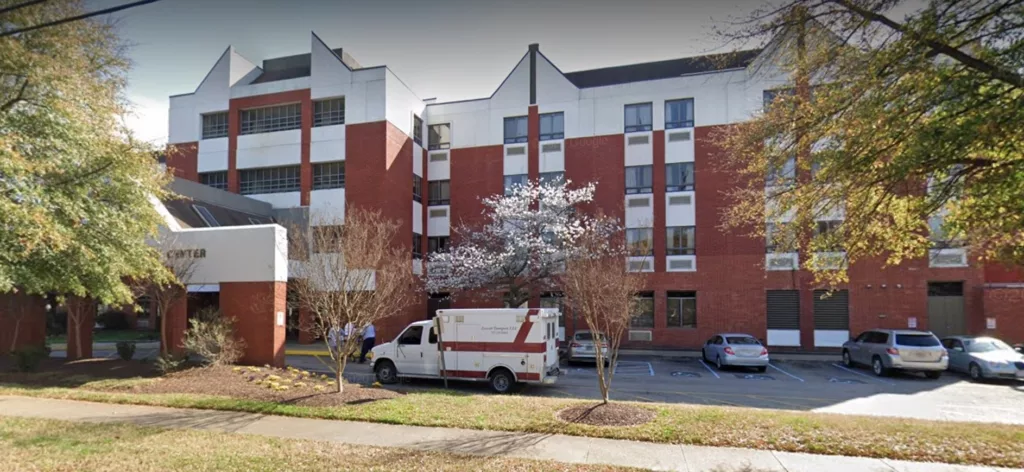

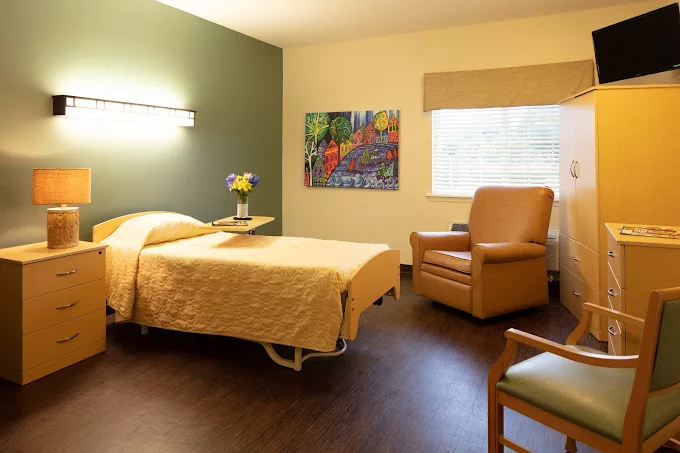
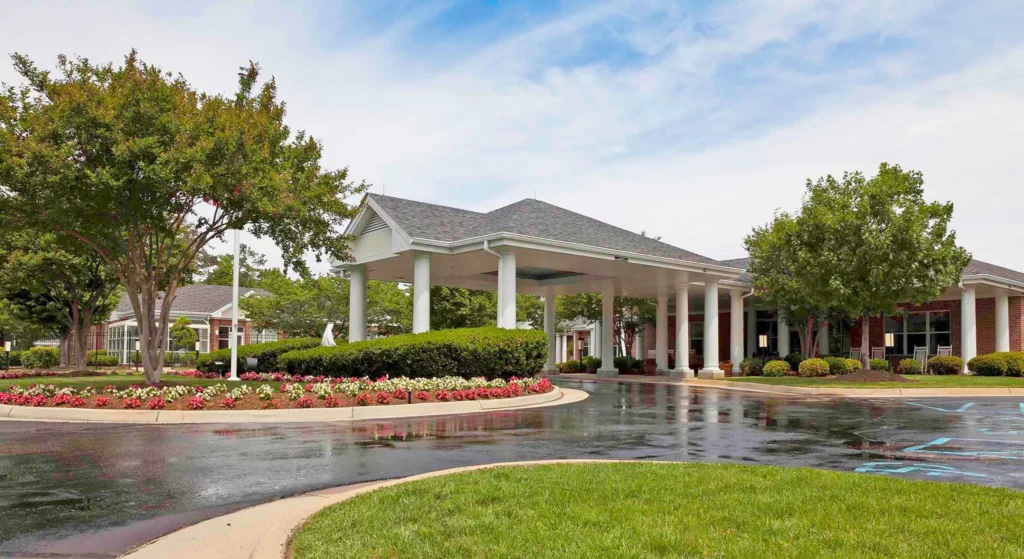
Nestled in the scenic neighborhood of Virginia Beach, VA, Kempsville Health & Rehab Center is a compassionate senior care provider, offering extensive rehabilitation, skilled nursing, and long-term care services. A team of highly skilled therapists are available to offer physical, speech, and occupational therapy services to help residents maintain their highest functionality to continue living their usual lifestyle. Each resident is provided with personalized care plans that best fits their individual needs and care goals and guarantee that they are met with effective services and care.
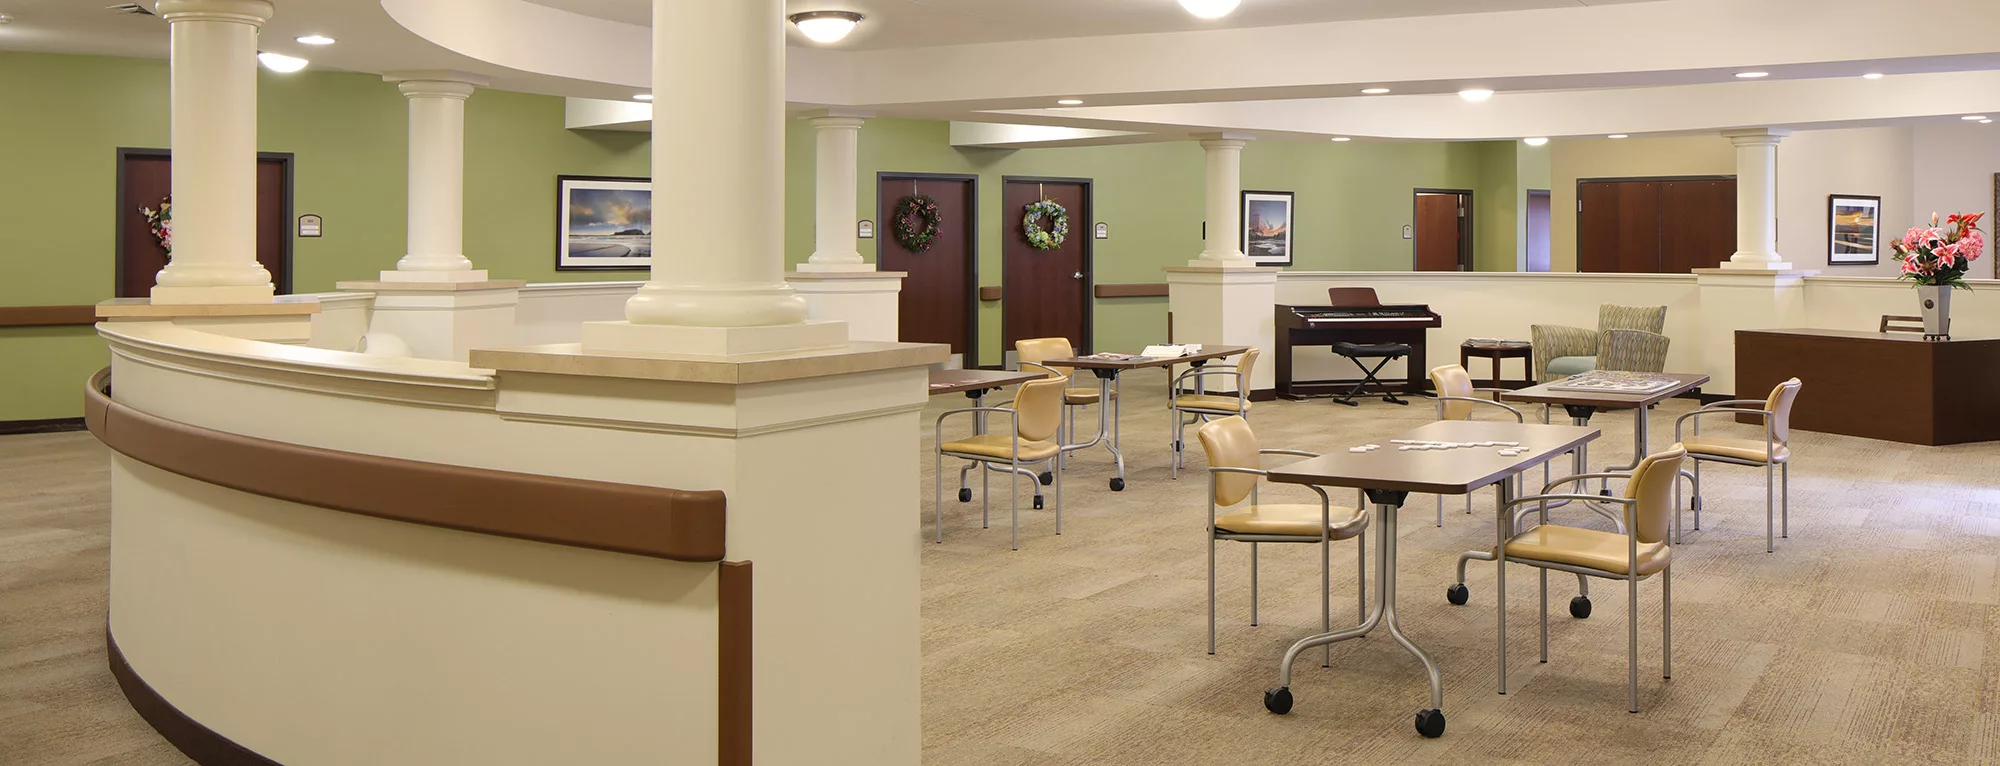
The community also provides its residents with countless opportunities for making meaningful connections and enriching memories through its vibrant array of activities, including shopping, outings, bingo, live entertainment, and more. Here, residents’ every need is met with compassion and expertise, guaranteeing they’ll be able to attain the best version of their overall well-being and functionality for a more rewarding living experience.
May offer a more intimate, personalized care environment.
Occupancy is moderate, suggesting balanced demand.
This home supports both short-term rehab and long-term care, with residents staying for a wide range of durations.
39% of new residents, usually for short-term rehab.
59% of new residents, often for short stays.
2% of new residents, often for long-term daily care.
Accept Medicaid: Yes
Total Residents: 90
Building Type: Mid-rise
Virginia average 4.2
Last Health inspection on Jan 2022
Virginia average 38.4
Virginia average 8.93
Health citations are formal notices following inspections when they fail to comply with safety and care standards.
All 36 citations resulted from standard inspections.
Virginia average: 0.4
Virginia average: 1
Data sourced from CMS Health Deficiencies reports. Citation severity codes range from A (least serious) to L (most serious). Immediate Jeopardy (J-L) citations indicate situations where the facility's noncompliance has placed residents at risk of death or serious harm.
Assisted Living A licensed, long-term care setting for seniors or individuals with disabilities who need help with daily activities — like bathing, dressing, and medication management — but not 24-hour skilled nursing. Offers housing, meals, and around-the-clock support while aiming to maximize resident independence.
Memory Care Secured, specialized care for people living with Alzheimer's or dementia. Staff trained in cognitive impairment, with higher staff-to-resident ratios and an environment designed to reduce confusion and wandering risk.
Nursing Home Licensed facility providing 24/7 skilled nursing care for residents with complex, ongoing medical needs. Staffed by RNs, LPNs, and CNAs. Inspected and star-rated annually by CMS. Accepts Medicare (short-term rehab) and Medicaid (long-term care).
Assisted Living A licensed, long-term care setting for seniors or individuals with disabilities who need help with daily activities — like bathing, dressing, and medication management — but not 24-hour skilled nursing. Offers housing, meals, and around-the-clock support while aiming to maximize resident independence.
Independent Living Lifestyle-focused communities for older adults offering dining, activities, and transportation with minimal personal care. Best for active, independent seniors who want community without medical support.
Nursing Home Licensed facility providing 24/7 skilled nursing care for residents with complex, ongoing medical needs. Staffed by RNs, LPNs, and CNAs. Inspected and star-rated annually by CMS. Accepts Medicare (short-term rehab) and Medicaid (long-term care).
Respite Care Short-term temporary care — days to weeks — to give family caregivers a break. Full care provided during the stay. Often used after hospitalization or to trial a facility before a permanent placement decision.
Assisted Living A licensed, long-term care setting for seniors or individuals with disabilities who need help with daily activities — like bathing, dressing, and medication management — but not 24-hour skilled nursing. Offers housing, meals, and around-the-clock support while aiming to maximize resident independence.
Independent Living Lifestyle-focused communities for older adults offering dining, activities, and transportation with minimal personal care. Best for active, independent seniors who want community without medical support.
Memory Care Secured, specialized care for people living with Alzheimer's or dementia. Staff trained in cognitive impairment, with higher staff-to-resident ratios and an environment designed to reduce confusion and wandering risk.
Nursing Home Licensed facility providing 24/7 skilled nursing care for residents with complex, ongoing medical needs. Staffed by RNs, LPNs, and CNAs. Inspected and star-rated annually by CMS. Accepts Medicare (short-term rehab) and Medicaid (long-term care).
Assisted Living A licensed, long-term care setting for seniors or individuals with disabilities who need help with daily activities — like bathing, dressing, and medication management — but not 24-hour skilled nursing. Offers housing, meals, and around-the-clock support while aiming to maximize resident independence.
Independent Living Lifestyle-focused communities for older adults offering dining, activities, and transportation with minimal personal care. Best for active, independent seniors who want community without medical support.
Memory Care Secured, specialized care for people living with Alzheimer's or dementia. Staff trained in cognitive impairment, with higher staff-to-resident ratios and an environment designed to reduce confusion and wandering risk.
Nursing Home Licensed facility providing 24/7 skilled nursing care for residents with complex, ongoing medical needs. Staffed by RNs, LPNs, and CNAs. Inspected and star-rated annually by CMS. Accepts Medicare (short-term rehab) and Medicaid (long-term care).
Home Care Professional care delivered in the person's own home — from companionship and errands to skilled nursing and therapy. Allows seniors to age in place. Medicare covers skilled home health when medically necessary.
Nursing Home Licensed facility providing 24/7 skilled nursing care for residents with complex, ongoing medical needs. Staffed by RNs, LPNs, and CNAs. Inspected and star-rated annually by CMS. Accepts Medicare (short-term rehab) and Medicaid (long-term care).
Respite Care Short-term temporary care — days to weeks — to give family caregivers a break. Full care provided during the stay. Often used after hospitalization or to trial a facility before a permanent placement decision.
![]() 13.9 miles from city center — 3.38 miles to nearest hospital (Sentara Leigh Hospital)
13.9 miles from city center — 3.38 miles to nearest hospital (Sentara Leigh Hospital)
![]() 5520 Indian River Rd, Virginia Beach, VA 23464
5520 Indian River Rd, Virginia Beach, VA 23464
Add your location
This data corresponds to Q2 2025 and is based on CMS Payroll-Based Journal.
Virginia average ratio: 1.67:1
Virginia average: 8 hours
Manages medical care and health needs.
This role is partially covered by contractors.
Assists with medical care and medications.
This role is partially covered by contractors.
Helps with daily care and mobility.
This role is partially covered by contractors.
Total hours from contractors
5,555 contractor hours this quarter
| Certified Nursing Assistant | 42 | 11 | 53 | 13,566 | 91 | 100% | 7.7 |
| Licensed Practical Nurse | 23 | 8 | 31 | 7,988 | 91 | 100% | 7.9 |
| Registered Nurse | 7 | 9 | 16 | 3,214 | 91 | 100% | 8.5 |
| RN Director of Nursing | 2 | 1 | 3 | 1,151 | 84 | 92% | 7.9 |
| Dental Services Staff | 2 | 0 | 2 | 999 | 74 | 81% | 7.6 |
| Administrator | 2 | 0 | 2 | 968 | 64 | 70% | 8 |
| Physical Therapy Assistant | 0 | 3 | 3 | 948 | 68 | 75% | 7.4 |
| Respiratory Therapy Technician | 0 | 3 | 3 | 859 | 71 | 78% | 6.9 |
| Physical Therapy Aide | 0 | 5 | 5 | 831 | 70 | 77% | 6.9 |
| Speech Language Pathologist | 0 | 4 | 4 | 533 | 71 | 78% | 6.4 |
| Dietitian | 1 | 0 | 1 | 524 | 68 | 75% | 7.7 |
| Clinical Nurse Specialist | 2 | 1 | 3 | 498 | 48 | 53% | 7.9 |
| Nurse Practitioner | 1 | 1 | 2 | 496 | 62 | 68% | 8 |
| Qualified Social Worker | 0 | 4 | 4 | 464 | 61 | 67% | 7.4 |
| Occupational Therapy Aide | 1 | 1 | 2 | 292 | 63 | 69% | 4.6 |
| Other Dietary Services Staff | 1 | 0 | 1 | 120 | 15 | 16% | 8 |
| Occupational Therapy Assistant | 0 | 3 | 3 | 57 | 48 | 53% | 1.2 |
| Medical Director | 0 | 1 | 1 | 43 | 30 | 33% | 1.4 |
Source: CMS Long-Term Care Facility Characteristics (Data as of Jan 2026)
Residents meet regularly to discuss policies, care quality, and activities
Organized group of residents that meets regularly to discuss facility policies, quality of life, and activities.
Data sourced from CMS Long-Term Care Facility Characteristics quarterly report. Payer mix reflects the current resident census by primary payment source.
These measures show how residents usually do over time at this home, based on health outcomes and preventive care.
Virginia average: 10.1
Virginia average: 19.7
Virginia average: 16.8%
Virginia average: 19.7%
Virginia average: 22.6%
Virginia average: 3.6%
Virginia average: 5.4%
Virginia average: 1.5%
Virginia average: 5.9%
Virginia average: 14.9%
Virginia average: 12.9%
Virginia average: 91.3%
Virginia average: 94.0%
Virginia average: 74.9%
Virginia average: 1.2%
Virginia average: 73.6%
Virginia average: 22.0%
Virginia average: 11.7%
Virginia average: 0.8%
Virginia average: 53.7%
Virginia average: 50.6%
Quality measures are calculated from Minimum Data Set (MDS) assessments. For most measures, lower percentages indicate better care quality.
Historical financial and operational data for Kempsville Health & Rehab Center based on CMS SNF Cost Reports.
Loading trend charts...
Care Cost Calculator: See Prices in Your Area
Nursing Home Data Explorer
Don’t Wait Too Long: 7 Red Flag Signs Your Parent Needs Assisted Living Now
The True Cost of Assisted Living in 2025 – And How Families Are Paying For It
Understanding Senior Living Costs: Pricing Models, Discounts & Financial Assistance

Touring a community? Use this expert-backed checklist to stay organized, ask the right questions, and find the perfect fit.
We'll send you a PDF version of the touring checklist.