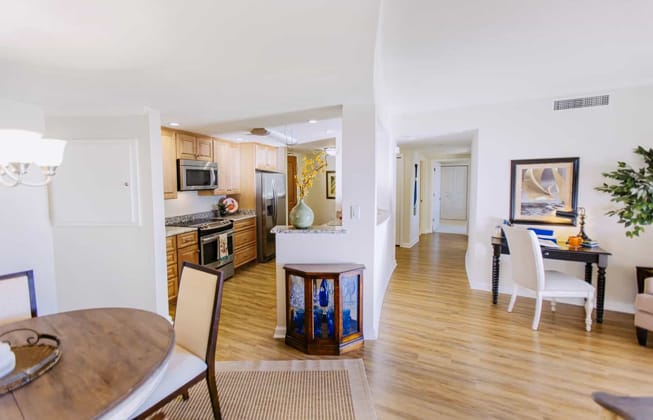
Best Nursing Homes in Virginia Beach, VA

Why trust this guide? Our editorial team analyzed 6 nursing homes in Virginia Beach, VA using CMS data, inspection records, complaints, amenities, and facility-level details. How we rank nursing homes in VA
Reviewed by
Last updated
We analyzed These are the facilities in Virginia Beach, VA our team has analyzed — not a count of every nursing home provider in Virginia Beach, VA.
6 homes
Other senior care options in Virginia Beach:
Avg Overall CMS Rating: 3.0/ 5The average Overall CMS Rating for all CMS-certified nursing homes in Virginia Beach, VA. Ratings combine health inspections, staffing, and quality measures, with inspections weighted most. Individual facilities can vary widely from this average.
National Average: 3.2/ 5
Avg Staffing Rating: 2.8/ 5The average Staffing Rating across all CMS-certified nursing homes in Virginia Beach, VA. Reflects nursing staff hours per resident per day (including RNs), adjusted for residents' care needs. Individual facilities can vary widely from this average.
National Average: 3.4/ 5
Avg Health Insp. Rating: 3.0/ 5The average Health Inspection Rating across all CMS-certified nursing homes in Virginia Beach, VA. Based on each facility's recent inspections and complaint investigations, weighing the number, scope, and severity of deficiencies. Individual facilities can vary widely from this average.
National Average: 3.0/ 5

Compare Nursing Homes around Virginia Beach (Metro Area)

Info below is compiled from CMS reports & the VA Depts. of Social Services & Health, senior community websites & trusted data sources such as Walk Score & BBB.

Communities are listed from highest to lowest based on our ranking methodology.

The facility name. Click to view the full profile page on Assisted Living Magazine, including photos, services, and contact info.
CMS (Centers for Medicare & Medicaid Services, the federal agency that regulates nursing homes) Overall 5-star rating — a composite of Health Inspection, Staffing, and Quality Measures scores. 5 stars = top 10% nationally. 1 star = bottom 10%. The single most important number to start with when comparing facilities.
Care Types in This Table AL (Assisted Living): Housing with help for daily activities like bathing, dressing, and medication, without 24-hour skilled nursing. NH (Nursing Home): 24/7 skilled nursing care for residents with complex, ongoing medical needs. SNF (Skilled Nursing Facility): Round-the-clock nursing care, often for recovery after surgery, injury, or illness. MC (Memory Care): Secured, specialized care for people living with Alzheimer's or dementia. RC (Respite Care): Short-term temporary care that gives family caregivers a break. IL (Independent Living): Community living with dining, activities, and transportation for active seniors who need little personal care. HOS (Hospice Care): Comfort-focused care for those with a terminal illness, prioritizing quality of life over treatment. PC (Palliative Care): Comfort-focused care for serious illness at any stage, including alongside curative treatment.
Neighborhood or city area where the facility is located. Proximity to family, hospitals, and green space matters for both quality of life and ease of visitation. Consider drive time and transit access when evaluating location.
Licensed bed capacity. Larger facilities (300+ beds) often have more specialized programs but can feel institutional. Smaller homes (under 150 beds) tend to deliver more personalized care. Compare with Avg Res/Day to understand how full the facility typically runs.
Percentage of licensed beds filled on an average day. Color indicates financial health: green (90%+) = operationally strong, typically profitable. Amber (80–89%) = stable but leaving revenue on the table. Orange (70–79%) = financial strain likely, may struggle with fixed costs. Red (<70%) = significant distress, closure or ownership change risk increases sharply.
This facility's occupancy rate compared to the statewide average for similar facilities. A positive number means above-average demand. Facilities running 5%+ above the state average are typically the most sought-after in their market — a strong proxy for reputation.
CMS-adjusted total nurse hours per resident per day (RN + LPN + CNA combined). The national average is approximately 3.5 hrs. Higher is better — more direct care time per resident. Below 3.0 is a red flag. CMS weights RN hours more heavily because RNs handle complex clinical decisions that CNAs cannot.
CMS Health Inspection star rating (1–5 stars), based on the 3 most recent annual state surveys plus any complaint investigations. This is the hardest rating to manipulate — it reflects real surveyor findings on-site. 5 stars = fewest deficiencies found. 1 star = most. It carries the heaviest weight in the Overall CMS rating.
CMS Staffing star rating (1–5 stars), based on daily nurse staffing hours submitted to CMS via verified payroll data. Compares RN, LPN, and CNA coverage relative to resident acuity level. 5 stars = well above expected staffing. Weekend staffing is evaluated separately, as that's where many facilities quietly reduce coverage.
CMS Quality Measures star rating (1–5 stars), based on 15 clinical outcome metrics including fall rates, pressure ulcers, antipsychotic drug use, and hospital readmissions. Captures actual resident health outcomes, not just compliance. High QM combined with low Health Inspection scores can indicate a facility with strong care but weak documentation practices.
Registered Nurse hours per resident/day compared to the statewide average. RNs are the highest-skilled nursing staff — they assess residents, manage medications, and respond to emergencies. A value of +50% means RN coverage is 50% above the state norm. Negative values are a concern for residents with complex or acute medical needs.
Total nursing staff hours (RN + LPN + CNA combined) per resident/day vs. the statewide average. A broader measure than RN vs State — it captures the entire care team. A facility can have high total staffing but low RN hours, meaning more aides and fewer nurses. Read both columns together for the full picture.
Total dollar amount of federal monetary fines (civil money penalties) issued by CMS in the past 3 years. Fines are only levied for serious violations — typically actual harm to residents, repeated uncorrected deficiencies, or systemic non-compliance. Even a single fine is noteworthy. Multiple fines strongly suggest a pattern, not isolated incidents.
Total health deficiency citations from the most recent standard inspection cycle. Minor citations (scope A–C) are common and often administrative in nature. Higher counts aren't always disqualifying, but should be read alongside Severe Citations to understand actual harm levels. Under 10 is strong for a large facility; 30+ warrants a closer look.
Average deficiency citations per CMS inspection (survey) in the reporting window — total citations divided by the number of inspections. Lower is better; compare alongside total Citations and Severe Citations for context.
Citations at CMS scope/severity level G or higher — G–I means actual harm occurred; J–L means residents were placed in immediate jeopardy. (D–F is potential for harm only). Examples include unaddressed falls, medication errors causing injury, neglect, or abuse.
Average number of residents in the building on any given day, derived from annual census data. Reflects true operating scale — a 400-bed facility running 200 residents/day operates very differently from one at 390. Higher resident counts generally mean more funded staffing hours.
Better Business Bureau rating (A+ to F). Reflects complaint history, business transparency, and how family disputes were resolved. A+ means no significant unresolved complaints. A blank (—) means the facility isn't BBB-accredited, which is common for healthcare providers and not necessarily a negative signal.
Walk Score® (0–100). Measures walkability of the surrounding area. 90–100 = Walker's Paradise. 70–89 = Very Walkable. 50–69 = Somewhat Walkable. Below 50 = Car-Dependent. Higher scores benefit family visitors, resident outings, and staff commuting.
The licensed owner or operator of record filed with CMS — the individual or organization legally accountable for the facility. Searching the operator name across other facilities can reveal chain or multi-site ownership, which matters: chain-operated homes tend to have more variable quality outcomes than independently run facilities.
What the home actually collects for resident care, after contractual allowances, bad debt and discounts — not gross billings. Taken from the latest complete annual cost report, so it is comparable across homes reporting the same period. Revenue alone doesn't indicate care quality, but it funds staffing and capital reinvestment. Pair with Payroll %. Figures are from each facility's most recent complete fiscal year — hover a value for the exact year; a * marks homes that report an older period than most facilities.
Staff salaries plus wage-related benefits from the latest complete annual cost report. Contract and agency labour is counted separately, under other operating costs, so a home leaning on agency staff can show a low figure here. Payroll is the cost most directly tied to care quality — compare with Payroll % for full context. Figures are from each facility's most recent complete fiscal year — hover a value for the exact year; a * marks homes that report an older period than most facilities.
Payroll as a share of NET PATIENT REVENUE (not gross revenue). Both figures come from the same cost-report year. A higher figure means more of each revenue dollar goes to staff pay. Read with the Staffing star rating to judge whether spend translates into coverage — and note that homes whose patient revenue covers only part of their operation can read implausibly high. The Virginia average is: 76.3% Figures are from each facility's most recent complete fiscal year — hover a value for the exact year; a * marks homes that report an older period than most facilities.
CMS Certification Number: the unique federal identifier for this skilled nursing provider.
Westminster-Canterbury on Chesapeake Bay
NH
AL
IL
MC
SNF
Virginia Beach (North Virginia Beach)
120
Facility 120
VA AVG 96
Rank #88 / 365
57.5%
Facility 57.5%
VA AVG 71
Rank #221 / 293
-19%
7.47
Facility 7.47
VA AVG 3.74
Rank #1 / 70
-3%+99%
$0
Facility $0
VA AVG $54.3k
Rank #1 / 74
17
Facility 17
VA AVG 38.4
Rank #23 / 69
5.7
Facility 5.7
VA AVG 8.9
Rank #25 / 69
-69-
47
Facility 47
VA AVG 45
Rank #191 / 434
Westminster-Canterbury On Chesapeake Bay
$41.9MFiscal year ending 09/2023
Facility $41.9MFiscal year ending 09/2023
VA AVG $19.9M
Rank #3 / 69
$25.9MFiscal year ending 09/2023
Facility $25.9MFiscal year ending 09/2023
VA AVG $11.3M
Rank #3 / 69
61.7%Fiscal year ending 09/2023
Facility 61.7%Fiscal year ending 09/2023
VA AVG 76.3%
Rank #16 / 69
495127
Atlantic Shores
NH
AL
HOS
IL
MC
SNF
Virginia Beach
50
Facility 50
VA AVG 96
Rank #300 / 365
77.0%
Facility 77.0%
VA AVG 71
Rank #122 / 293
+9%
4.75
Facility 4.75
VA AVG 3.74
Rank #29 / 70
-64%+27%
$0
Facility $0
VA AVG $54.3k
Rank #1 / 74
23
Facility 23
VA AVG 38.4
Rank #31 / 69
7.7
Facility 7.7
VA AVG 8.9
Rank #36 / 69
-39A+
8
Facility 8
VA AVG 45
Rank #412 / 434
Atlantic Shores Cooperative Association Inc
$30.1MFiscal year ending 12/2023
Facility $30.1MFiscal year ending 12/2023
VA AVG $19.9M
Rank #12 / 69
$17.8MFiscal year ending 12/2023
Facility $17.8MFiscal year ending 12/2023
VA AVG $11.3M
Rank #10 / 69
59%Fiscal year ending 12/2023
Facility 59%Fiscal year ending 12/2023
VA AVG 76.3%
Rank #21 / 69
495324
Cypress Point Rehabilitation and Nursing
NH
HOS
MC
PC
RC
SNF
Virginia Beach (Northwest)
90
Facility 90
VA AVG 96
Rank #179 / 365
94.3%
Facility 94.3%
VA AVG 71
Rank #27 / 293
+33%
3.32
Facility 3.32
VA AVG 3.74
Rank #53 / 70
-27%-11%
$15.9k
Facility $15.9k
VA AVG $54.3k
Rank #67 / 74
55
Facility 55
VA AVG 38.4
Rank #60 / 69
13.8
Facility 13.8
VA AVG 8.9
Rank #57 / 69
-85-
61
Facility 61
VA AVG 45
Rank #104 / 434
Richard Bank
$10.3MFiscal year ending 03/2024
Facility $10.3MFiscal year ending 03/2024
VA AVG $19.9M
Rank #58 / 69
$5.2MFiscal year ending 03/2024
Facility $5.2MFiscal year ending 03/2024
VA AVG $11.3M
Rank #58 / 69
50.4%Fiscal year ending 03/2024
Facility 50.4%Fiscal year ending 03/2024
VA AVG 76.3%
Rank #34 / 69
495234
Rosemont Health and Rehab
NH
HOS
MC
RC
SNF
Virginia Beach (Windsor Woods)
116
Facility 116
VA AVG 96
Rank #100 / 365
96.1%
Facility 96.1%
VA AVG 71
Rank #19 / 293
+35%
3.23
Facility 3.23
VA AVG 3.74
Rank #56 / 70
+34%-14%
$9.3k
Facility $9.3k
VA AVG $54.3k
Rank #63 / 74
33
Facility 33
VA AVG 38.4
Rank #41 / 69
6.6
Facility 6.6
VA AVG 8.9
Rank #30 / 69
3112-
34
Facility 34
VA AVG 45
Rank #269 / 434
Alverta Robinson
$12.8MFiscal year ending 12/2023
Facility $12.8MFiscal year ending 12/2023
VA AVG $19.9M
Rank #45 / 69
$5.9MFiscal year ending 12/2023
Facility $5.9MFiscal year ending 12/2023
VA AVG $11.3M
Rank #53 / 69
45.7%Fiscal year ending 12/2023
Facility 45.7%Fiscal year ending 12/2023
VA AVG 76.3%
Rank #50 / 69
495270
Kempsville Health & Rehab Center
NH
HOS
MC
RC
SNF
Virginia Beach
90
Facility 90
VA AVG 96
Rank #179 / 365
--
3.03
Facility 3.03
VA AVG 3.74
Rank #59 / 70
+19%-19%
$0
Facility $0
VA AVG $54.3k
Rank #1 / 74
36
Facility 36
VA AVG 38.4
Rank #44 / 69
12.0
Facility 12.0
VA AVG 8.9
Rank #51 / 69
193-
60
Facility 60
VA AVG 45
Rank #108 / 434
Patrick Shuler
$10.7MFiscal year ending 12/2023
Facility $10.7MFiscal year ending 12/2023
VA AVG $19.9M
Rank #53 / 69
$5.1MFiscal year ending 12/2023
Facility $5.1MFiscal year ending 12/2023
VA AVG $11.3M
Rank #61 / 69
47.7%Fiscal year ending 12/2023
Facility 47.7%Fiscal year ending 12/2023
VA AVG 76.3%
Rank #41 / 69
495232

Rank badges are statewide: each community is ranked against every VA community we track that reports that metric, not just the 6 analyzed for Virginia Beach.

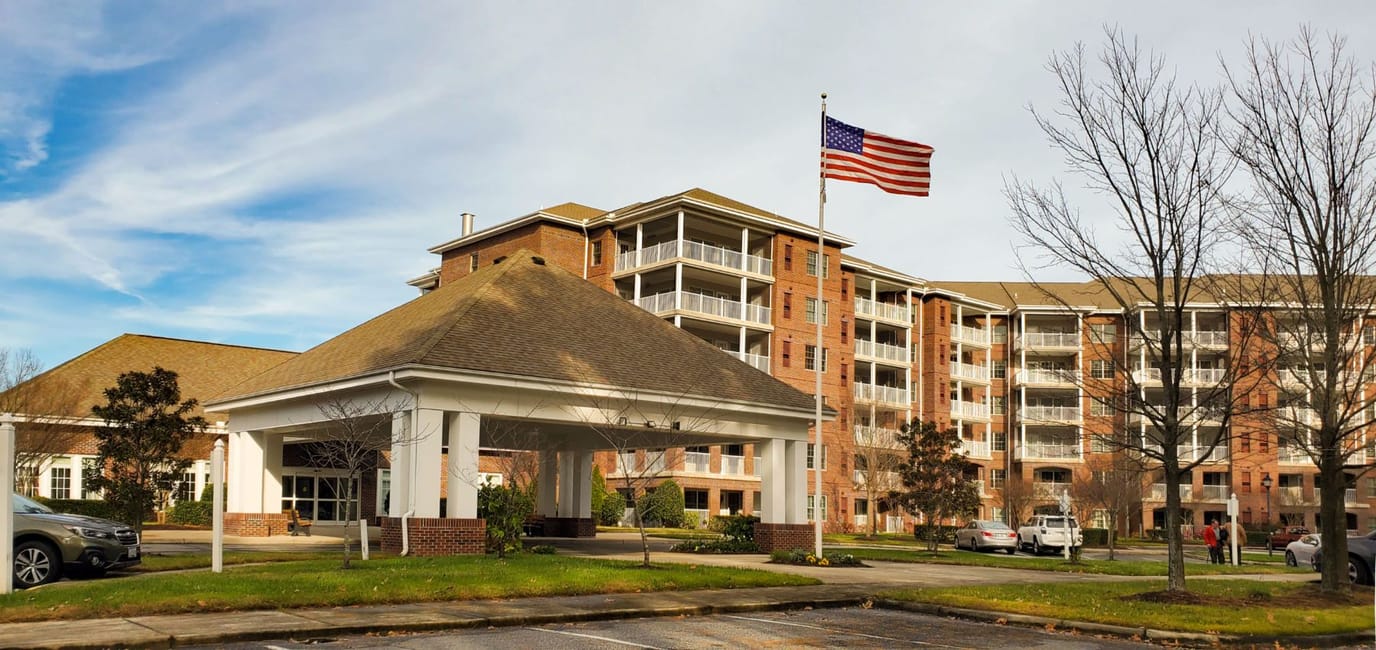
Overview of Westminster-Canterbury on Chesapeake Bay

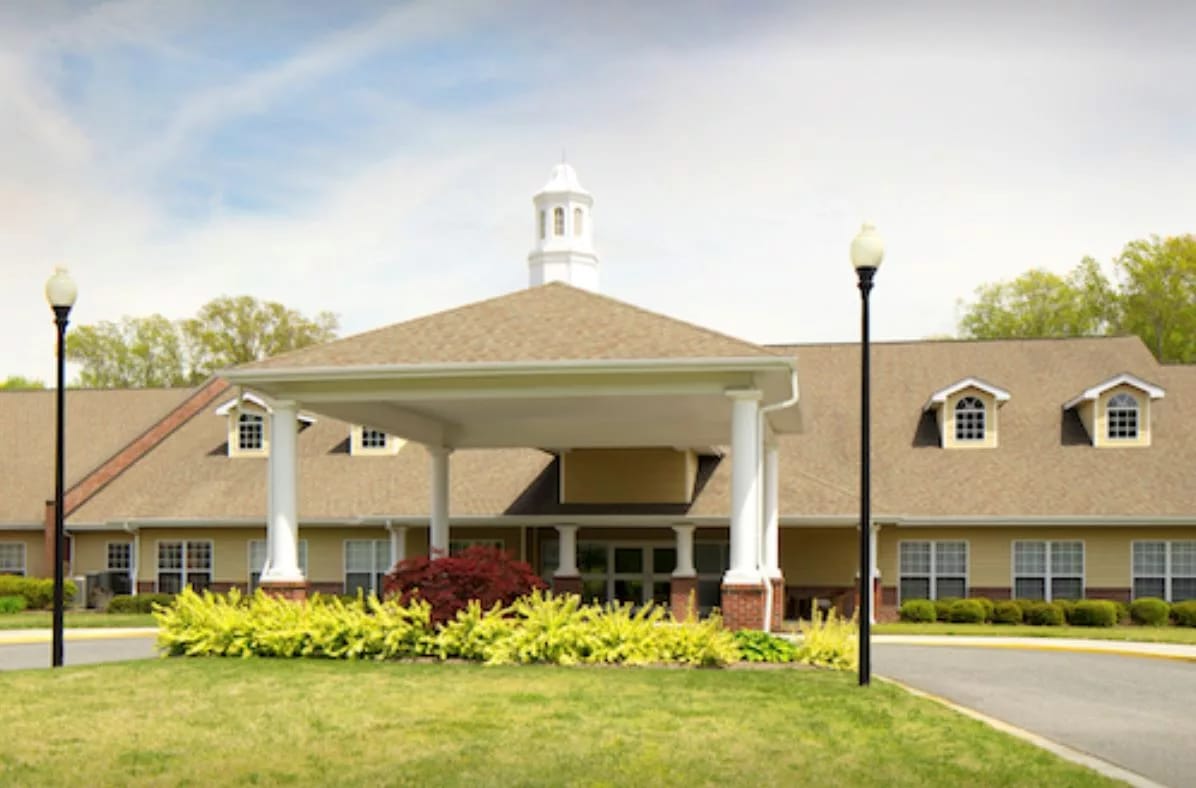
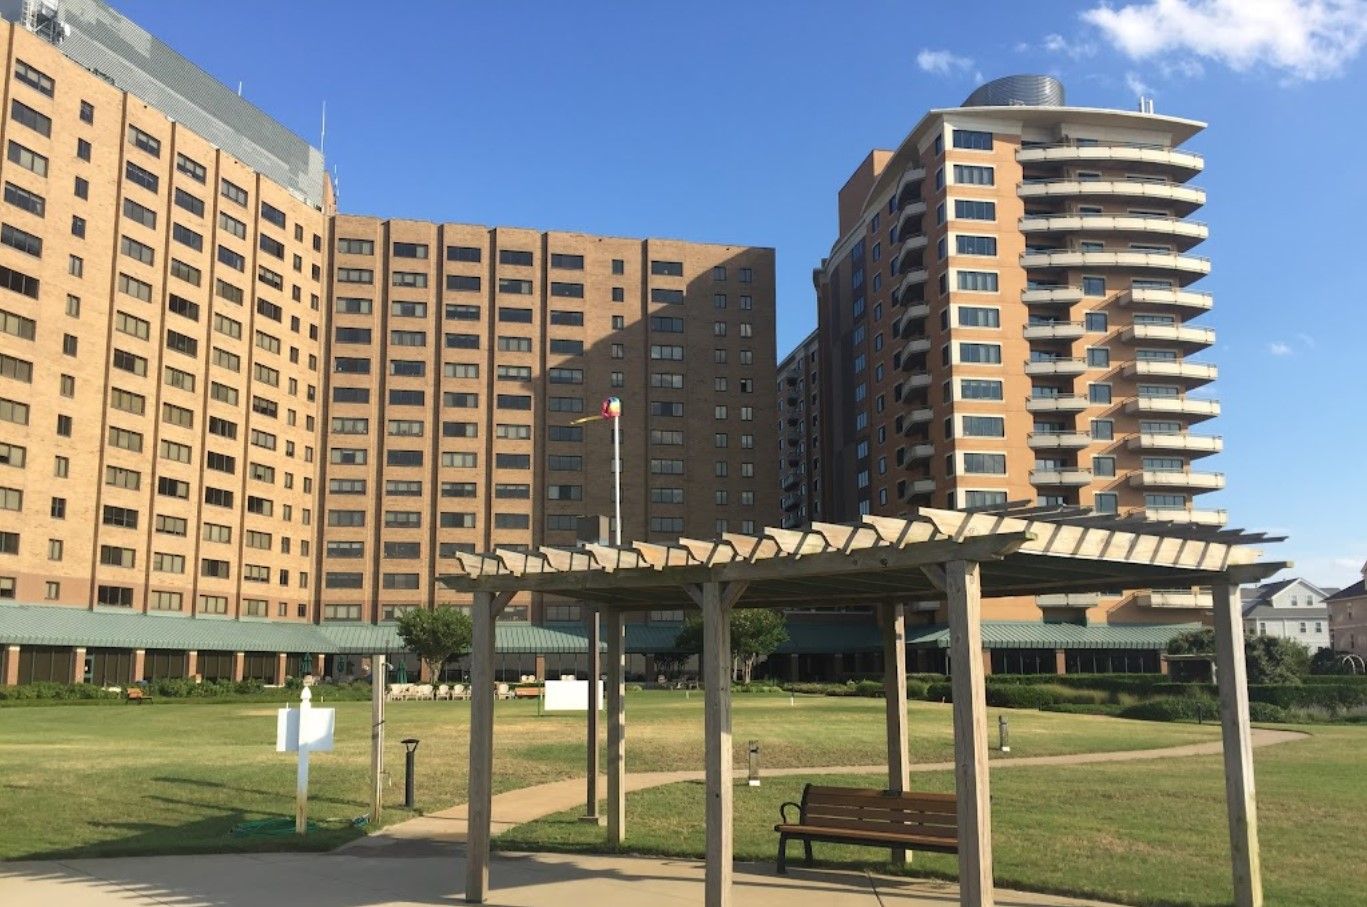
At 49 years old and with 120 beds, Westminster-Canterbury on Chesapeake Bay is one of the more established continuing care communities on Virginia Beach’s waterfront. The address, 3100 Shore Dr, puts it along the Chesapeake Bay in a somewhat walkable area (Walk Score 47) where a car is generally still needed. Ms. Julia Fretwell administers the facility; Mr. Ben Unkle is President and CEO. CARF accreditation is on the record.

Medicare drives 77% of new admissions, with a typical stay of 19 days. The overall average length of stay is 74 days. Those two figures together describe a facility that functions, in practical terms, as a short-stay rehabilitation hub. Occupancy sits at 58%, meaning 69 of 120 beds are currently in use.

The clinical staffing is substantial: total nursing hours run 6 hours 34 minutes per resident per day, with RN coverage at 55 minutes daily. Rehabilitation services are the stated clinical offering, built around a named program suite: Early Advantage, Make A Move, Pre-hab, At Home Services, the Birdsong Clinic, and Catering and Private Events. An Active Resident Council operates on-site.

State inspections have tended to center on emergency preparedness, staffing credentials, and care planning and documentation rather than direct resident care concerns.

Westminster-Canterbury accepts Medicare and private pay. The full spectrum of care types on the license, including independent living, assisted living, memory care, and home care, means the campus can theoretically accommodate a range of needs. It is a high-staffed, program-rich post-acute rehabilitation facility drawing predominantly short-stay Medicare patients, set inside a long-standing waterfront institution that has operated on this stretch of Shore Drive for nearly five decades.

Contact Westminster-Canterbury on Chesapeake Bay

Atlantic Shores

1200 Atlantic Shores Dr, Virginia Beach, VA 23454
Overview of Atlantic Shores

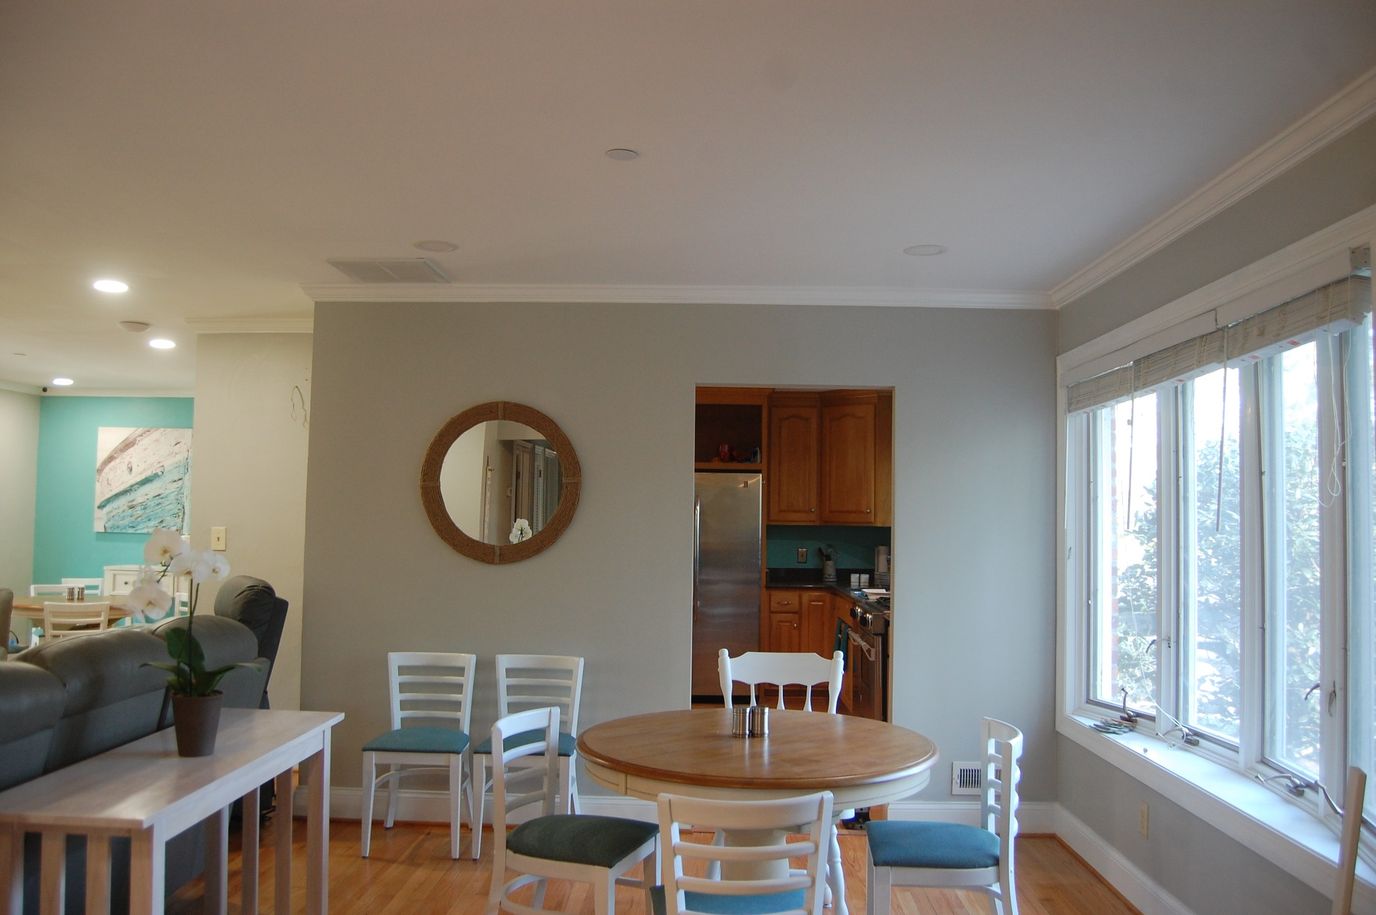
Atlantic Shores is a 55+ retirement community in Virginia Beach, VA, that offers independent living, assisted living, memory care, and skilled nursing. The community promotes a supportive and welcoming environment to ensure older adults can keep their peace of mind during their stay. Exceptional services, including housekeeping, well-balanced meals, and concierge services, are also provided, so residents have a maintenance-free lifestyle. Focusing on residents’ holistic wellness, the community also creates care plans tailored to their unique needs and preferences.
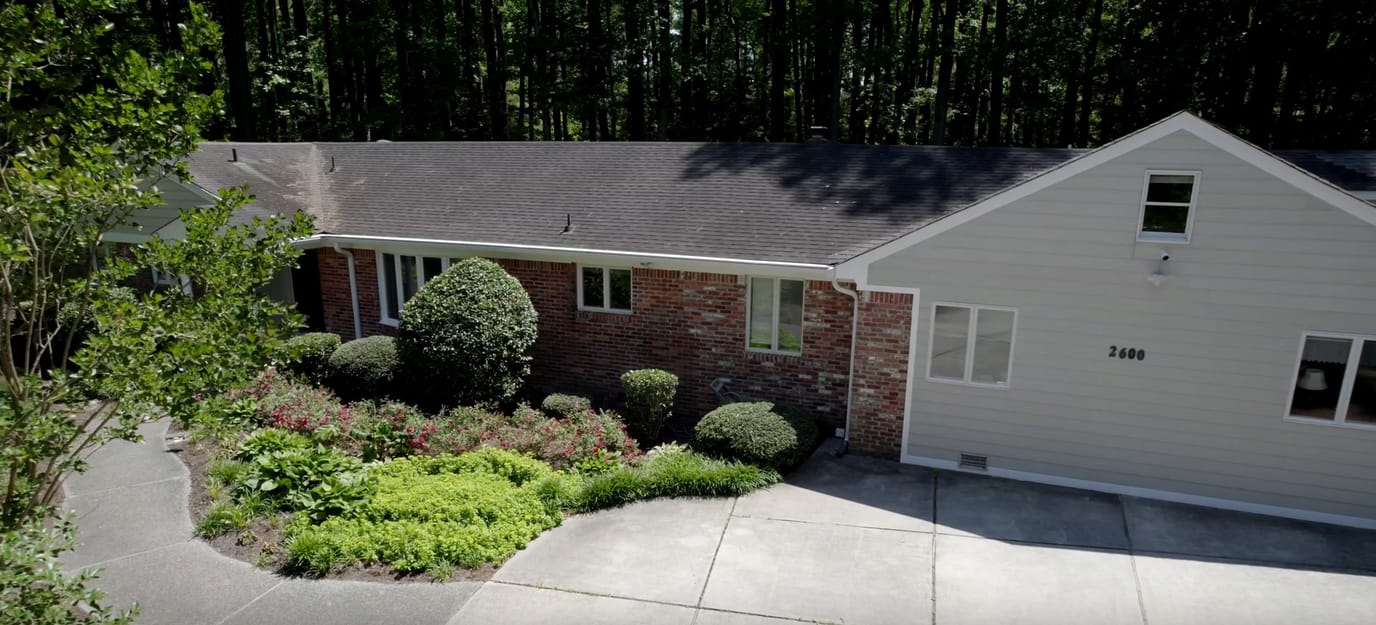
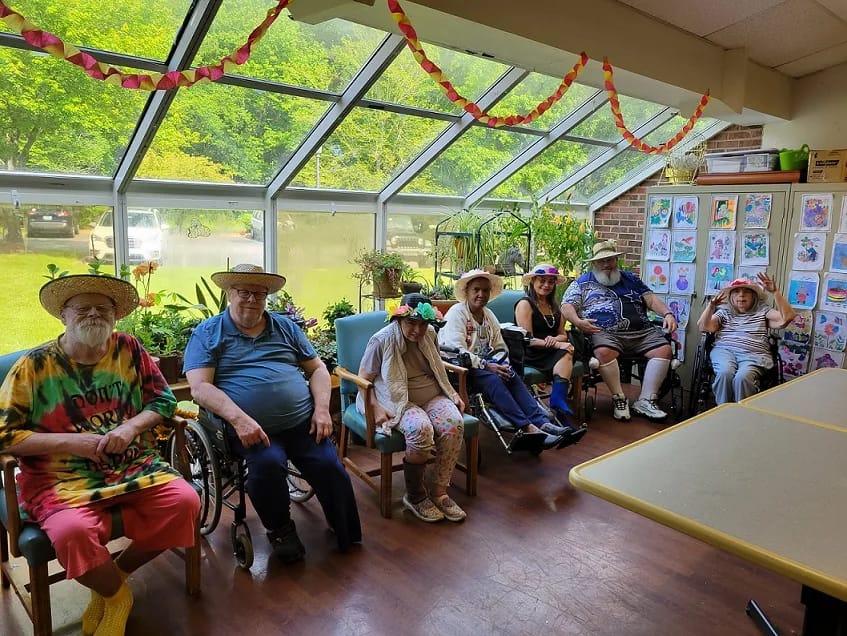
Dance, board games, and pet-friendly outings are just some of the activities that residents can participate in to stay active and have fun. Residents can also lounge and interact with their surroundings through state-of-the-art amenities, including the indoor pool, fitness center, and beautifully maintained gardens. With its scenic setting near Lake Redwing and various leisure sites, residents are guaranteed a stress-free retirement. This retirement community has high standards of care, making it one of the best choices for senior living in Virginia.
Contact Atlantic Shores

Overview of Cypress Point Rehabilitation and Nursing

Cypress Point Rehabilitation and Nursing is one of the trusted nursing homes in VB. The rehabilitation center boasts a family-like environment where residents can feel comfortable and secure with the staff to take care of them because the personal touch approach creates a warm and welcoming environment; it’s a home where families can trust that their loved ones are in good hands. Cypress Pointe is the ideal place for seniors looking to heal. 
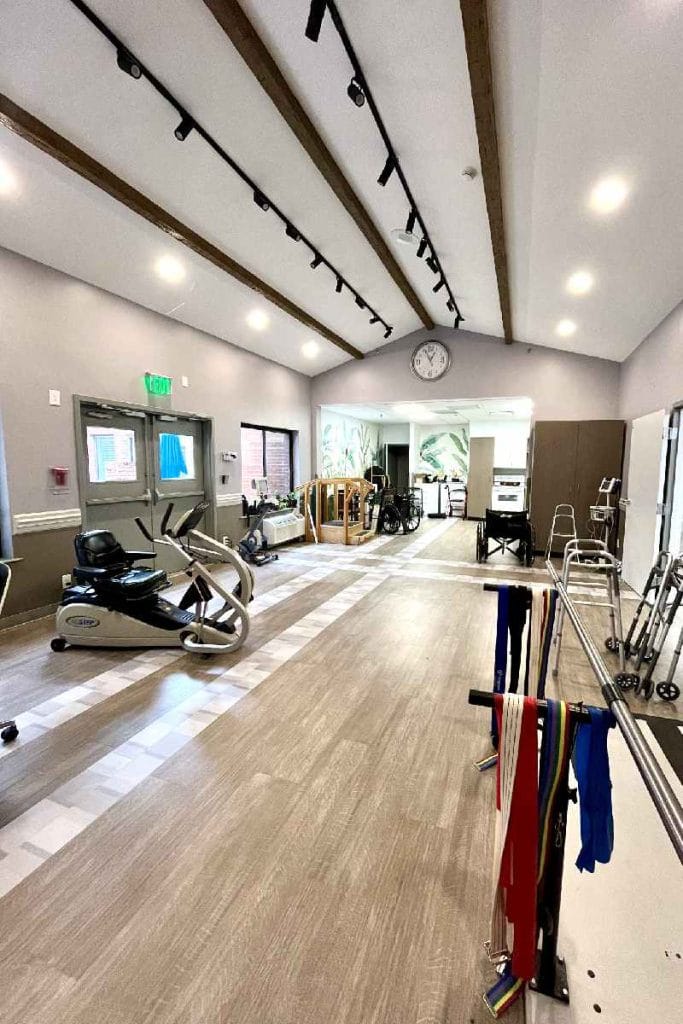
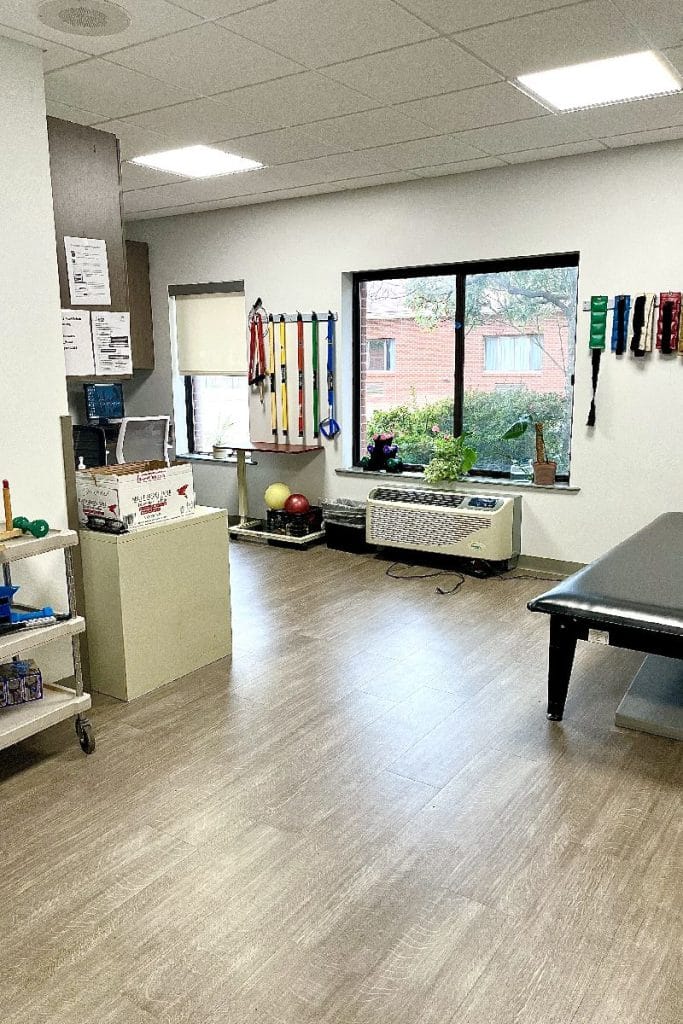
Cypress boasts its clinical excellence found in the advanced medical equipment, 24/7 licensed nurses for skilled nursing such as respiratory care, wound care, and diabetes management. Rehabilitative services offered include an on-site gym with the necessary technology; speech, occupational, and physical therapy for regaining endurance and stability. 

Contact Cypress Point Rehabilitation and Nursing

Rosemont Health and Rehab

3750 Sentara Way Ste R, Virginia Beach, VA 23452
Overview of Rosemont Health and Rehab

Set in the scenic Virginia Beach, VA, Rosemont Health and Rehab is an excellent senior care provider, offering skilled nursing, senior rehabilitation and long-term care options. The community strives to create a healing environment that fosters quick recovery with the aid of a dependable care team that carefully curates custom care plans for each resident. Residents also enjoy access to expert physical, occupational and speech therapy that help them attain a more improved quality of life and well-being.

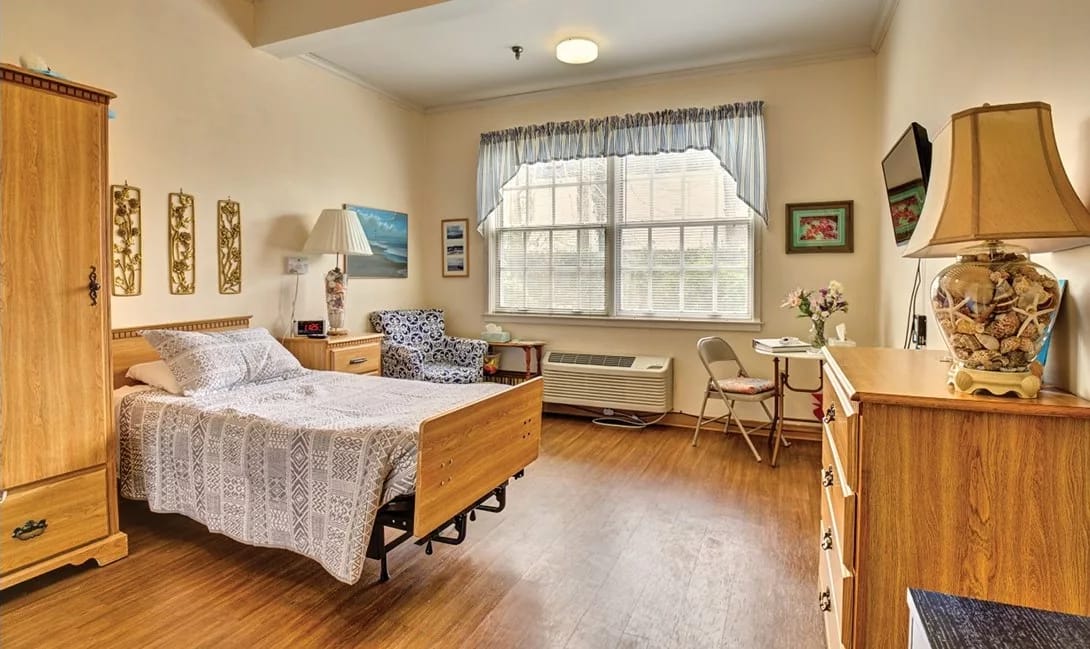
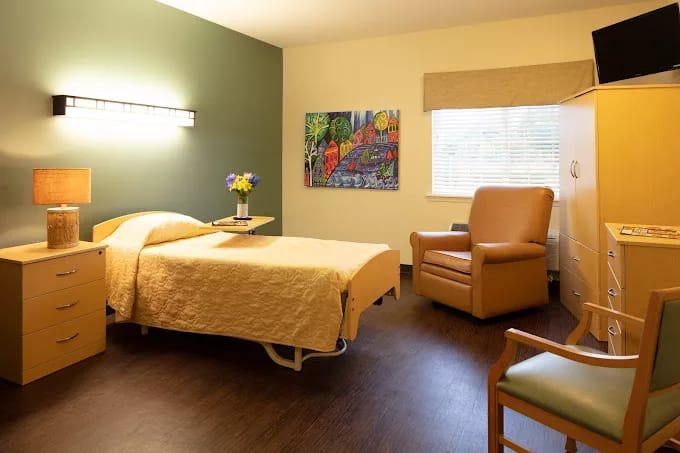
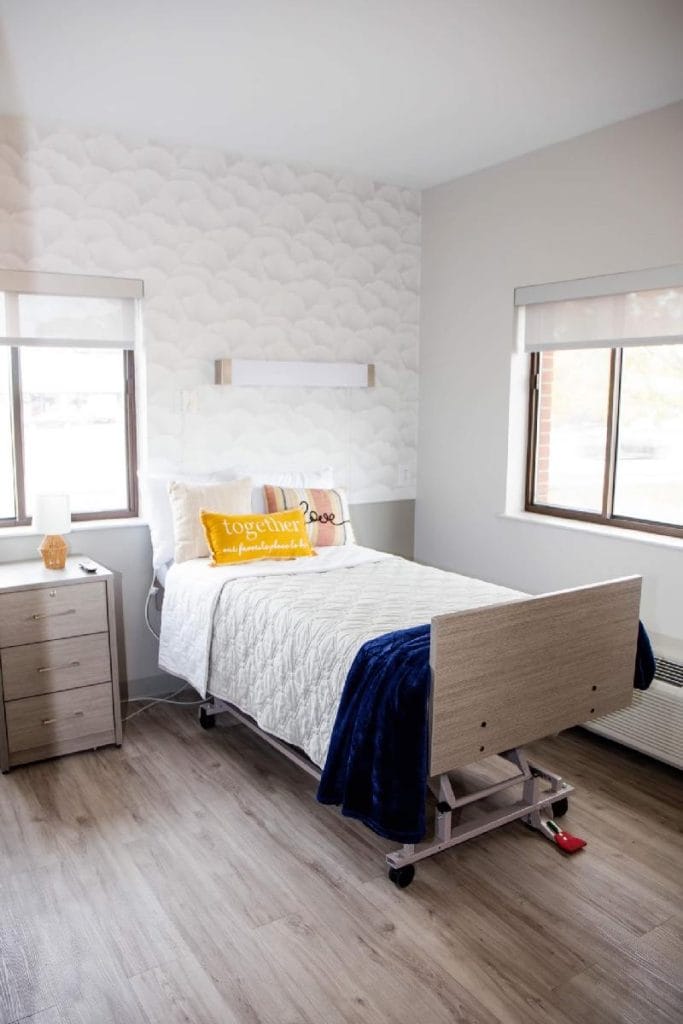
Committed to making its residents feel comfortable and at ease, Rosemont Health and Rehab provides its residents with safe, private rooms that they can freely personalize to make it their own. The community’s prime location also offers easy access to beaches, restaurants, town center, and a variety of tourist locations that residents and their families can freely visit and explore for recreation.

Contact Rosemont Health and Rehab

Overview of Kempsville Health & Rehab Center

Nestled in the scenic neighborhood of Virginia Beach, VA, Kempsville Health & Rehab Center is a compassionate senior care provider, offering extensive rehabilitation, skilled nursing, and long-term care services. A team of highly skilled therapists are available to offer physical, speech, and occupational therapy services to help residents maintain their highest functionality to continue living their usual lifestyle. Each resident is provided with personalized care plans that best fits their individual needs and care goals and guarantee that they are met with effective services and care.

The community also provides its residents with countless opportunities for making meaningful connections and enriching memories through its vibrant array of activities, including shopping, outings, bingo, live entertainment, and more. Here, residents’ every need is met with compassion and expertise, guaranteeing they’ll be able to attain the best version of their overall well-being and functionality for a more rewarding living experience.

Contact Kempsville Health & Rehab Center

Overview of Living Well Assisted Living

Located in the neighborhood of Virginia Beach, VA, Living Well Assisted Living is a distinct senior living community, offering a safe haven for residents needing exceptional assisted living and memory care. The community offers a wide range of services tailored to enhance residents’ quality of life, such as assistance with daily living activities and supportive memory care. A dedicated care team thoroughly assess residents’ needs and provide them with an effective personalized care plan, as well as access to skilled nursing and rehabilitation services through its trusted partnerships should residents need it.

With a focus on residents wellness, the community provides an array of fun fitness programs like yoga, meditation, and personal training to help residents maintain an active and healthy lifestyle. Residents also enjoy freshly made organic meals to ensure they eat healthy and receive the nourishment they need to stay on top of their health. With excellent care, services, and programs, the community provides residents utmost peace of mind about their future.

Contact Living Well Assisted Living

Ranking Methodology

How we rank these nursing homes

Every nursing home above is evaluated across five weighted categories using CMS data including Care Compare, Payroll-Based Journal, and Medicare Cost Reports.

  • CMS data
  • 5 weighted categories
  • Updated quarterly
Full methodology

Weighting overview

  • 35%
    Care Quality
  • 20%
    Staffing
  • 20%
    Regulatory
  • 20%
    Operational
  • 5%
    Environment
01

Care Quality 35%

The largest single share of every ranking. CMS star ratings and quality measures that reflect actual care delivered to residents.

  • Includes
  • Overall Rating
  • Health Inspection
  • QM Rating
  • Long-Stay QM
  • Short-Stay QM
02

Staffing Adequacy 20%

The strongest predictor of resident outcomes. Volume and stability of nursing care, drawn from CMS Payroll-Based Journal.

  • Includes
  • Nurse Hrs/Res/Day
  • RN vs State
  • Total Nurse Staff Hrs vs State
  • RN Turnover
03

Regulatory & Safety Record 20%

Inspection patterns that star ratings can mask. We weight per-inspection rates more heavily than raw counts.

  • Includes
  • Citations
  • Citations/Inspection
  • Severe Citations
  • Fines
  • Accreditations
04

Operational & Financial Stability 20%

Stable operations and sound finances are leading indicators of consistent care over time.

  • Includes
  • Occupancy vs State
  • Avg Length of Stay
  • Revenue
  • Payroll %
  • Years in Operation
  • Admin Tenure
05

Environment & Accessibility 5%

Context that matters to families but doesn't directly measure clinical care. Weighted lower for nursing homes than for assisted or independent living.

  • Includes
  • Walk Score
  • BBB Rating
No paid rankings Facilities cannot pay to influence placement.
How we're paid: If we help you find a home and you move in, that home may pay us a referral fee. This never affects where they rank or what you pay. Learn more
Submit a correction

Virginia Beach Nursing Home Facilities Overview

  • Avg payroll costs: $6,857,520.23 (Virginia avg: $5,690,166.18)
  • Avg home costs: $11,066,380.92 (Virginia avg: $8,753,535.33)
  • Avg occupancy: 89.33% (Virginia avg: 87.22%)
  • Avg bed count: 110 (Virginia avg: 135)
  • Avg home revenue: $20,064,750.31 (Virginia avg: $16,215,621.96)

Community-level financial and occupancy data

  • THALIA GARDENS REHABILITATION AND NU: 84.71% occupancy, 138 beds, $13,948,820.00 home revenue, $4,371,859.00 payroll costs, $8,028,615.00 home costs.
  • PRINCESS ANNE HEALTH & REHAB CENTER: 93.75% occupancy, 120 beds, $29,966,286.00 home revenue, $5,840,439.00 payroll costs, $11,699,407.00 home costs.
  • VA BEACH HEALTH CARE & REHAB CENTER: 96.17% occupancy, 180 beds, $31,380,865.00 home revenue, $6,611,178.00 payroll costs, $13,164,140.00 home costs.
  • BETH SHOLOM HOME OF EASTERN VIRGINIA: 90.08% occupancy, 120 beds, $20,989,427.00 home revenue, $12,591,156.00 payroll costs, $11,248,252.00 home costs.
  • BAYSIDE HEALTH & REHAB CTR: 91.67% occupancy, 60 beds, $12,578,291.00 home revenue, $2,425,328.00 payroll costs, $5,469,219.00 home costs.
  • BIRCHWOOD PARK REHAB AND NURSING: 86.47% occupancy, 150 beds, $14,868,134.00 home revenue, $4,593,298.00 payroll costs, $8,702,286.00 home costs.
  • WESTMINSTER CANTERBURY ON CHESAPEAK: 87.04% occupancy, 108 beds, $51,400,339.00 home revenue, $19,914,260.00 payroll costs, $33,994,464.00 home costs.
  • ROSEMONT HEALTH AND REHAB: 92.76% occupancy, 116 beds, $12,682,696.00 home revenue, $4,420,848.00 payroll costs, $6,235,150.00 home costs.
  • COLONIAL HEALTH & REHAB CENTER: 87.44% occupancy, 90 beds, $8,586,302.00 home revenue, $2,367,368.00 payroll costs, $5,280,948.00 home costs.
  • HAMPTON HEALTHCARE GROUP LLC: 92.56% occupancy, 90 beds, $9,687,917.00 home revenue, $4,886,467.00 payroll costs, $4,758,937.00 home costs.
  • BAY POINTE REHABILITATION AND NURSIN: 87.41% occupancy, 112 beds, $12,887,274.00 home revenue, $3,586,214.00 payroll costs, $7,665,235.00 home costs.
View Chart Data Table
MetricVirginia BeachVirginia
Avg payroll costs$6,857,520.23$5,690,166.18
Avg home costs$11,066,380.92$8,753,535.33
Avg occupancy89.33%87.22%
Avg bed count110135
Avg home revenue$20,064,750.31$16,215,621.96
CommunityOccupancyBedsHome RevenuePayroll CostsHome CostsMedicareMedicaidPrivate Pay
THALIA GARDENS REHABILITATION AND NU84.71%138$13,948,820.00$4,371,859.00$8,028,615.007.13%75.73%17.14%
PRINCESS ANNE HEALTH & REHAB CENTER93.75%120$29,966,286.00$5,840,439.00$11,699,407.0042.21%40.41%17.38%
VA BEACH HEALTH CARE & REHAB CENTER96.17%180$31,380,865.00$6,611,178.00$13,164,140.0026.86%58.21%14.93%
BETH SHOLOM HOME OF EASTERN VIRGINIA90.08%120$20,989,427.00$12,591,156.00$11,248,252.0018.89%4.33%76.78%
BAYSIDE HEALTH & REHAB CTR91.67%60$12,578,291.00$2,425,328.00$5,469,219.0036.70%39.38%23.92%
BIRCHWOOD PARK REHAB AND NURSING86.47%150$14,868,134.00$4,593,298.00$8,702,286.007.64%79.42%12.94%
WESTMINSTER CANTERBURY ON CHESAPEAK87.04%108$51,400,339.00$19,914,260.00$33,994,464.0026.74%8.87%64.39%
ROSEMONT HEALTH AND REHAB92.76%116$12,682,696.00$4,420,848.00$6,235,150.0010.12%7.02%82.86%
COLONIAL HEALTH & REHAB CENTER87.44%90$8,586,302.00$2,367,368.00$5,280,948.0010.92%71.08%18.00%
HAMPTON HEALTHCARE GROUP LLC92.56%90$9,687,917.00$4,886,467.00$4,758,937.0013.60%5.25%81.15%
BAY POINTE REHABILITATION AND NURSIN87.41%112$12,887,274.00$3,586,214.00$7,665,235.0012.04%79.29%8.67%
Who we are

Your Senior Care Partner, Every Step of the Way

We help families find affordable senior communities and unlock same day discounts, Medicaid, and Medicare options tailored to your needs.

Contact us Today

Frequently Asked Questions about Nursing Homes in Virginia Beach, VA

What's the difference between assisted living and a nursing home in Virginia?

Assisted living in Virginia is a residential model focused on housing, hospitality, and help with daily activities. Nursing homes (skilled nursing facilities) provide 24/7 medical care from licensed nurses for residents with significant health needs, and are regulated more strictly under both state and federal CMS rules.

Does Virginia Medicaid cover nursing home care?

Yes — Virginia Medicaid covers nursing home care for residents who meet income, asset, and medical-need eligibility requirements. Most CMS-certified nursing homes accept Medicaid as a primary payer once long-term-care eligibility is established.

What is nursing home care?

Nursing homes (also called skilled nursing facilities) provide 24/7 medical care from licensed nurses, rehabilitation services, and long-term custodial care for residents with significant health or functional needs.

How many nursing homes are listed on this page?

This page features 6 nursing homes in Virginia Beach, VA. Use the filters and comparison tools above to compare ratings, amenities, and pricing.

How do I choose the right nursing home in Virginia Beach, VA?

Start by matching the level of care offered to the resident's current and anticipated needs, then compare licensing status, staff-to-resident ratios, recent inspection results, and pricing. Tour at least two or three communities in Virginia Beach, VA, talk to current residents and families, and confirm what is included in the base rate versus billed as add-on services.

What should I look for when visiting nursing homes in Virginia Beach, VA?

Pay attention to staff interactions with residents, cleanliness and odor, food quality at meal times, the activity calendar, and how questions about pricing and care plans are answered. Ask to see the most recent state inspection report, the move-out / level-of-care-change policy, and a sample monthly bill that lists every fee.