


La Familia Assisted Living
La Familia Assisted Living
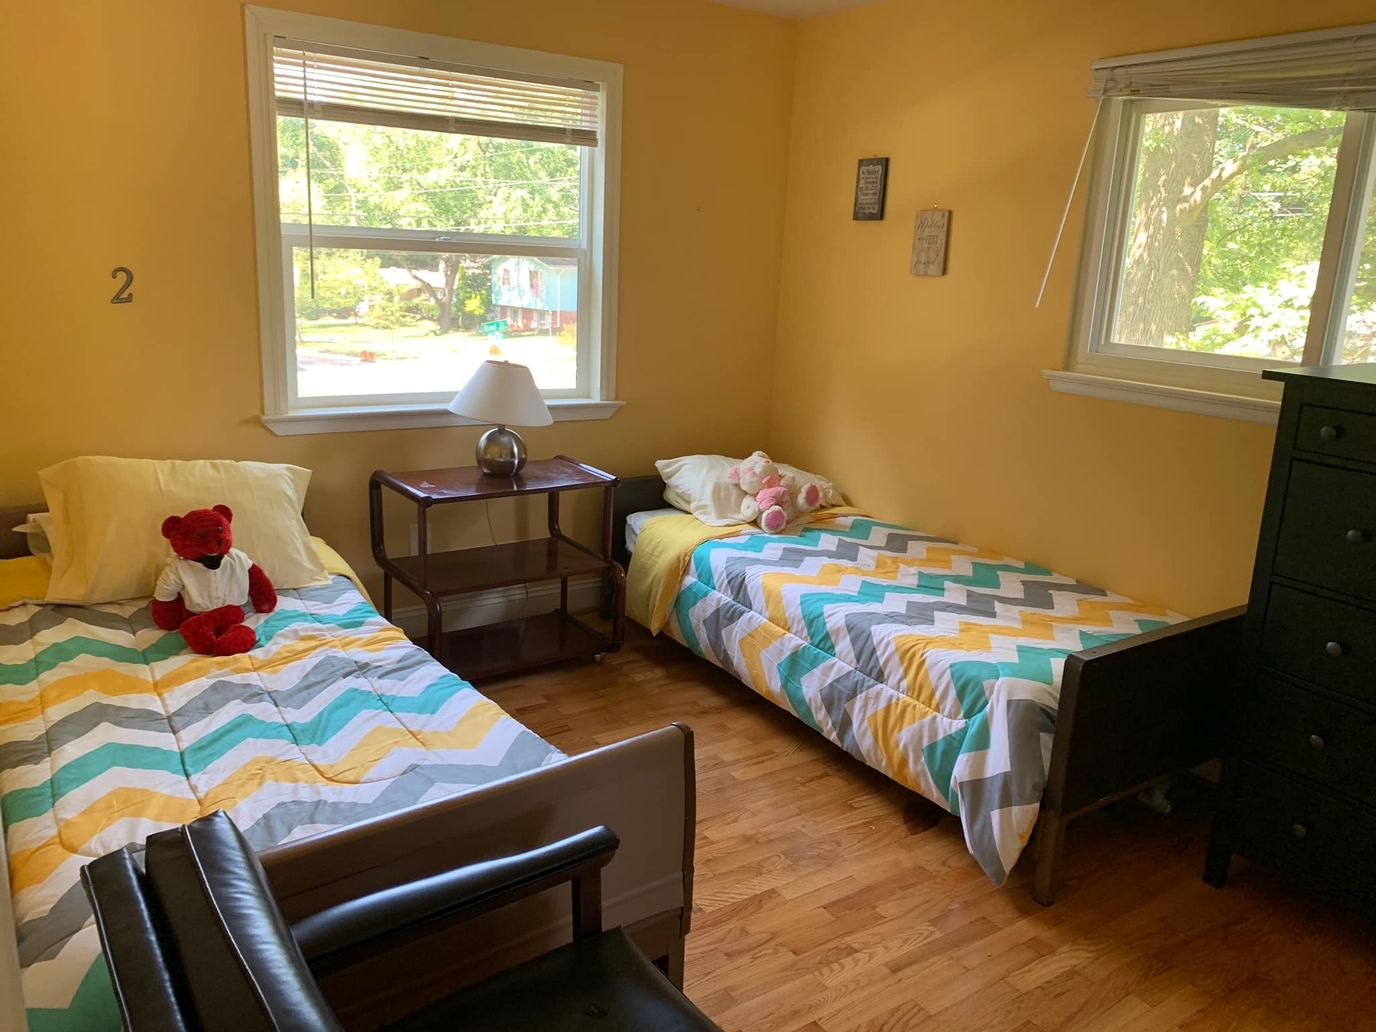
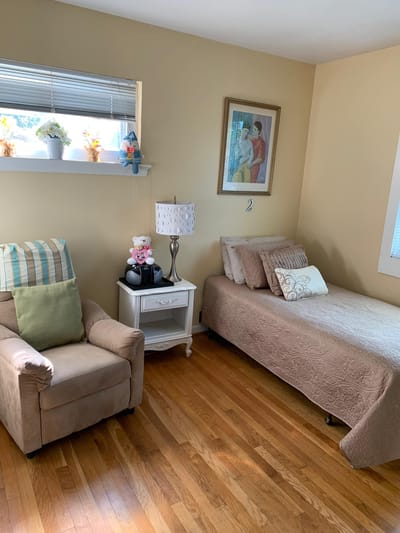
Make the most of your best years at La Familia Assisted Living, a blissful retreat in Rockville, MD, offering assisted living. Residents can ease their worries with a compassionate and well-trained team helping with their daily living activities and personal needs 24/7. The community also offers specially designed and secure accommodations, ensuring residents are comfortable and safe.
For residents’ happiness and wellness, a variety of engaging activities and enriching programs are conducted. Healthy meals are important for residents’ well-being, so delicious and well-balanced dining options are served to meet their nutritional needs and preferences. With its dedicated services and state-of-the-art amenities, residents are guaranteed the finest retirement experience.
5-bed community Rank #424 / 685Bed count — State benchmarkedThis home is ranked 424th out of 685 homes in Maryland for bed count. Shows this facility's certified or reported bed count compared to other Maryland facilities. Larger communities may offer more amenities, programs, and on-site services for residents and families.Facilities with the same value for a metric share the same rank. Rankings are based only on facilities in Maryland that report data for that category. Facilities without available data are excluded from the ranking.Click the rank badge to see the full State ranking.Click here to see the full State ranking.
A smaller, more intimate setting that may offer a quieter environment and closer staff-resident interactions.
Walk Score: 24 / 100 Rank #693 / 985Walk Score — State benchmarkedThis home is ranked 693rd out of 985 homes in Maryland for walk score. Shows how walkable this facility's neighborhood is compared to the average walk score across Maryland facilities. Higher scores benefit residents, families, and staff.Facilities with the same value for a metric share the same rank. Rankings are based only on facilities in Maryland that report data for that category. Facilities without available data are excluded from the ranking.Click the rank badge to see the full State ranking.Click here to see the full State ranking.
Car-dependent. Most errands require a car, with limited nearby walkable options.
About this community
Facility TypeAssisted Living
CountyWashington
No mild Alzheimer's level
No moderate Alzheimer's level
No severe Alzheimer's level
What does this home offer?
Housing Options: Private / Shared Rooms
Building Type: 2-story
Housekeeping Services
Social and Recreational Activities
Places of interest near La Familia Assisted Living
![]() 3.6 miles from city center
3.6 miles from city center
![]() Estimated distance in miles from Rockville's city center to La Familia Assisted Living's address, calculated via Google Maps.
Estimated distance in miles from Rockville's city center to La Familia Assisted Living's address, calculated via Google Maps.
Calculate Travel Distance to La Familia Assisted Living
Add your location
Compare Assisted Living around Rockville
Info below is compiled from the MD Dept. of Health (OHCQ), senior community websites & trusted data sources such as Walk Score & BBB.
Communities are listed from highest to lowest based on our ranking methodology.
| Revitz House | AL HC IL MC NH SNF | Rockville | 558
Facility
558
MD AVG
42
Rank
#1 / 685 | Yes |
81
Facility
81
MD AVG
43
Rank
#86 / 985 | 1 Bed | - | - | - | - | - | - | - | - | - | - | - |
| Landow House | AL HC IL MC NH SNF | Rockville (Rollins Park) | 98
Facility
98
MD AVG
42
Rank
#126 / 685 | Yes |
59
Facility
59
MD AVG
43
Rank
#327 / 985 | 1 Bed / 2 Bed | 31
Facility
31
MD AVG
21
Rank
#39 / 210 | - |
31% Male Residents — State Benchmarked 31% of residents are male, compared to the Maryland average of 31%. This facility caters to a majority female resident pool (69% female), consistent with the broader assisted living trend where women significantly outnumber men. |
69% Female Residents — State Benchmarked 69% of residents are female, compared to the Maryland average of 69%. Women comprise the large majority, consistent with national assisted living demographics where women live longer and enter care facilities at higher rates. |
99% White Residents — State Benchmarked 99% of residents are reported as White, compared to the Maryland average of 81%. A higher White share than is typical for assisted living in Maryland in this dataset — compare with peer facilities for local context. |
0% African American Residents — State Benchmarked 0% of residents are reported as African American or Black, compared to the Maryland average of 13%. A lower African American share than is typical in Maryland; local markets still vary widely. |
1% Other Ethnicity Residents — State Benchmarked 1% of residents fall into categories other than White or African American (combined), compared to the Maryland average of 6%. This column aggregates Hispanic, Asian, multiracial, and any other labeled groups that are not classified as White or African American. Reported subgroups in this total: Asian (1%). |
7% Residents Age 65–74 — State Benchmarked 7% of residents are 65–74, compared to the Maryland average of 13%. Fewer younger seniors suggests the resident population skews older, likely requiring higher acuity care and more hands-on support. |
20% Residents Age 75–84 — State Benchmarked 20% of residents are 75–84, compared to the Maryland average of 31%. Below the state norm — the resident mix may skew either younger or older than this typical middle bracket. |
49% Residents Age 85–94 — State Benchmarked 49% of residents are 85–94, compared to the Maryland average of 44%. A high concentration of very elderly residents signals a higher-acuity facility with experience caring for advanced age-related needs. |
24% Residents Age 95+ — State Benchmarked 24% of residents are 95 or older, compared to the Maryland average of 16%. A high proportion of the oldest-old suggests strong end-of-life care experience and very-high-acuity capabilities. |
| Sunrise of Rockville | AL HOS MC | Rockville (Baltimore Road) | 89
Facility
89
MD AVG
42
Rank
#150 / 685 | Yes |
89
Facility
89
MD AVG
43
Rank
#32 / 985 | Studio / 1 Bed / 2 Bed | 45
Facility
45
MD AVG
21
Rank
#4 / 210 | A- |
23% Male Residents — State Benchmarked 23% of residents are male, compared to the Maryland average of 31%. This facility caters to a majority female resident pool (77% female), consistent with the broader assisted living trend where women significantly outnumber men. |
77% Female Residents — State Benchmarked 77% of residents are female, compared to the Maryland average of 69%. Women comprise the large majority, consistent with national assisted living demographics where women live longer and enter care facilities at higher rates. |
87% White Residents — State Benchmarked 87% of residents are reported as White, compared to the Maryland average of 81%. Close to the average for this category among assisted living facilities in Maryland with reported race/ethnicity data. |
2% African American Residents — State Benchmarked 2% of residents are reported as African American or Black, compared to the Maryland average of 13%. A lower African American share than is typical in Maryland; local markets still vary widely. |
11% Other Ethnicity Residents — State Benchmarked 11% of residents fall into categories other than White or African American (combined), compared to the Maryland average of 6%. This column aggregates Hispanic, Asian, multiracial, and any other labeled groups that are not classified as White or African American. Reported subgroups in this total: Mixed Race (6%), Hispanic (3%), Asian (2%). |
3% Residents Age 65–74 — State Benchmarked 3% of residents are 65–74, compared to the Maryland average of 13%. Fewer younger seniors suggests the resident population skews older, likely requiring higher acuity care and more hands-on support. |
31% Residents Age 75–84 — State Benchmarked 31% of residents are 75–84, compared to the Maryland average of 31%. This is the second most common age bracket in assisted living, representing residents with moderate care needs. |
56% Residents Age 85–94 — State Benchmarked 56% of residents are 85–94, compared to the Maryland average of 44%. A high concentration of very elderly residents signals a higher-acuity facility with experience caring for advanced age-related needs. |
10% Residents Age 95+ — State Benchmarked 10% of residents are 95 or older, compared to the Maryland average of 16%. Most residents here have not yet reached the oldest-old bracket, suggesting a younger overall community. |
| Ingleside at King Farm | AL IL MC NH SNF | Rockville (King Farm) | 45
Facility
45
MD AVG
42
Rank
#219 / 685 | Yes |
73
Facility
73
MD AVG
43
Rank
#152 / 985 | 1 Bed / 2 Bed | - | - | - | - | - | - | - | - | - | - | - |
| La Familia Assisted Living | AL | Rockville | 5
Facility
5
MD AVG
42
Rank
#424 / 685 | No |
24
Facility
24
MD AVG
43
Rank
#693 / 985 | Private / Shared Rooms | - | - | - | - | - | - | - | - | - | - | - |
Financial Assistance for
Assisted Living in Maryland
La Familia Assisted Living is located in Rockville, Maryland.
Here are the financial assistance programs available to residents in Maryland.
Frequently Asked Questions about La Familia Assisted Living
Is La Familia Assisted Living in a walkable area?
La Familia Assisted Living has a walk score of 24. Car-dependent. Most errands require a car, with limited nearby walkable options.
Are pets allowed at La Familia Assisted Living?
No, La Familia Assisted Living has a no-pet policy.
How many beds does La Familia Assisted Living have?
La Familia Assisted Living has 5 beds.
Are there photos of La Familia Assisted Living?
Yes — there are 2 photos of La Familia Assisted Living in the photo gallery on this page.
What is the address of La Familia Assisted Living?
La Familia Assisted Living is located at 14417 Bauer Drive, Rockville, MD 20853.
What is the phone number of La Familia Assisted Living?
(301) 603-8054 will put you in contact with the team at La Familia Assisted Living.
What county is La Familia Assisted Living located in?
La Familia Assisted Living is in Washington County.
Guides for Better Senior Living
Care Cost Calculator: See Prices in Your Area
Assisted Living Explorer
Don’t Wait Too Long: 7 Red Flag Signs Your Parent Needs Assisted Living Now
The True Cost of Assisted Living in 2025 – And How Families Are Paying For It
Understanding Senior Living Costs: Pricing Models, Discounts & Financial Assistance
Updated on
