Laurelwood Health Care Center
Nursing Home & Respite Care · Jackson, TN
CMS overall rating Info The Overall CMS Rating is scored from 1 to 5 stars and combines results from health inspections, staffing levels, and quality measures. Health inspections carry the most weight. Staffing and quality scores can increase or decrease the final rating based on performance compared to state and national standards.

Laurelwood Health Care Center

Nursing Home & Respite Care · Jackson, TN
CMS overall rating Info The Overall CMS Rating is scored from 1 to 5 stars and combines results from health inspections, staffing levels, and quality measures. Health inspections carry the most weight. Staffing and quality scores can increase or decrease the final rating based on performance compared to state and national standards.
Calculator: See prices in your area
Laurelwood Health Care Center accepts Medicare, Medicaid, and private pay.

Overview of Laurelwood Health Care Center

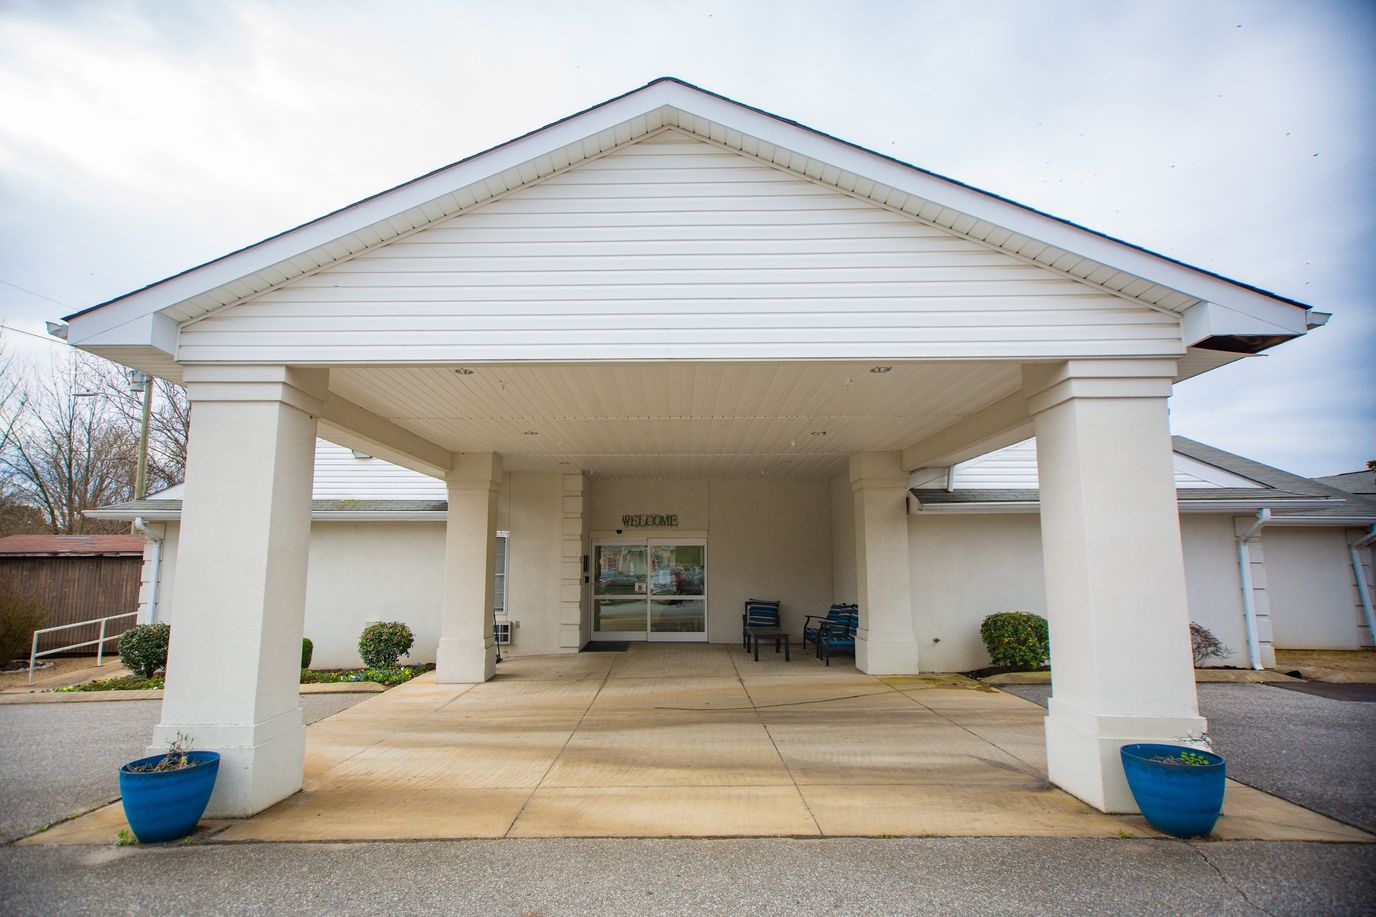
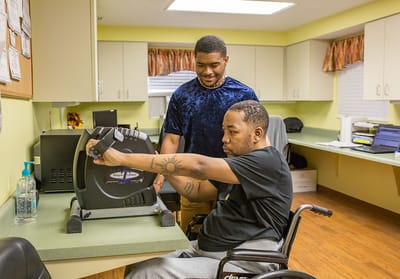
Laurelwood Health Care Center is a trusted nursing home in Jackson, TN, offering skilled nursing and rehabilitation. Promoting a warm and nurturing environment, the community ensures older adults are well-cared for. Well-balanced meals, therapy services, and 24-hour care are among the exceptional services provided to improve residents’ quality of life. Through personalized care plans, residents also receive the utmost attention and care to recover and return to their routines with ease.

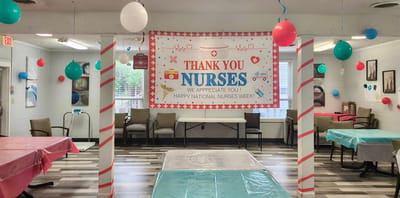
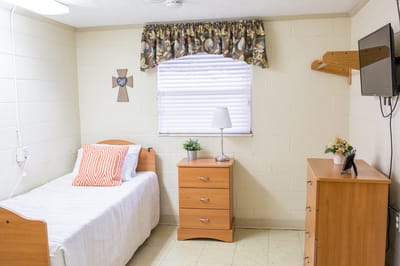
Sensory activities, holiday events, and pet therapy are just some of the life enrichment programs dedicated to helping residents maintain their holistic wellness and have fun. A spacious courtyard and thoughtfully furnished rooms are also available, so residents can rest and move around comfortably. Residents also experience a convenient and laid-back lifestyle, as it is located near bus stops in Jackson’s serene residential area. This nursing home is one of the good options for senior living in Tennessee, especially with its high standards of care.

(731) 422-5641

Quality ratings

Measured by Centers for Medicare & Medicaid Services (CMS)

Overall rating Info The Overall CMS Rating combines results from health inspections, staffing levels and quality measures. Health inspections carry the most weight. Staffing and quality scores can increase or decrease the final rating based on performance compared to state and national standards.
▼ 29.4% Below TN avg. ▼ 29.4% Below TN avg.Click the badge to see the full State ranking.Click here to see the full State ranking.
Health Inspection Info Based on the results of the facility's three most recent standard inspections and any complaint investigations. CMS reviews the number, scope, and severity of deficiencies, with more recent findings weighted more heavily.
▼ 28.2% Below TN avg. ▼ 28.2% Below TN avg.Click the badge to see the full State ranking.Click here to see the full State ranking.
Staffing Info Measures average nursing staff hours per resident per day, including Registered Nurses (RNs) and total nursing staff. Ratings are adjusted based on the level of care residents require and are compared to state and national benchmarks.
▼ 17.2% Below TN avg. ▼ 17.2% Below TN avg.Click the badge to see the full State ranking.Click here to see the full State ranking.
Quality Measures Info Based on clinical and physical health indicators reported to CMS, such as hospital readmissions, falls, pressure ulcers, and improvements in mobility. These measures reflect how well residents' health needs are being managed.
▼ 12.8% Below TN avg. ▼ 12.8% Below TN avg.Click the badge to see the full State ranking.Click here to see the full State ranking.

Staffing hours breakdown

Info Daily nursing hours per resident by staff type, reported to CMS. Higher is generally better — compare this facility to state and national averages to see where staffing stands.

Hours per resident per day — compared to Tennessee state averages

Total nursing care / resident Info This home is ranked 30th out of 172 homes in Tennessee. Total adjusted nursing hours per resident per day, combining RN, LPN, and aide time. CMS adjusts this for case-mix so facilities can be fairly compared.
3h 59m per day
Rank #30 / 172Nurse hours — State benchmarkedThis home is ranked 30th out of 172 homes in Tennessee. Shows adjusted nurse hours per resident per day benchmarked to the Tennessee average, with a ranking across 172 Tennessee SNFs. More hours mean more direct care. The national average is about 3.5 hrs; below 3.0 is a red flag.Click the rank badge to see the full State ranking.Click here to see the full State ranking.
This facility Tennessee avg (3h 38m per day)
vs Tennessee avg
+10%

5 of 6 metrics below state avg

Standout metric LPN / LVN is +3% above state avg
Staff typeHours / Day / Residentvs state avg
Registered Nurse (RN) Info RNs hold the highest nursing license and can assess residents, interpret test results, and direct care plans. More RN hours per day often signals stronger clinical oversight and faster response to health changes. 20m per day ▼ 46% State avg: 37m per day · National avg: 41m per day
LPN / LVN Info Licensed Practical Nurses (LPNs) or Licensed Vocational Nurses (LVNs) deliver routine hands-on care — medication administration, wound dressing, and monitoring vital signs. They work under RN supervision and make up a large share of daily bedside care. 1h 8m per day ▲ 3% State avg: 1h 6m per day · National avg: 52m per day
Nurse Aide Info Certified Nurse Aides (CNAs) provide the most direct day-to-day assistance: bathing, dressing, feeding, and mobility. Nurse aide hours are typically the largest staffing category and directly affect residents' quality of life. 2h 1m per day ▼ 6% State avg: 2h 9m per day · National avg: 2h 21m per day
Weekend Total Nursing Info Combined nursing hours (RN + LPN + Nurse Aide) per resident per day on weekends. Staffing often drops on weekends — this figure reveals whether the facility maintains adequate coverage outside of weekday hours. 3h 2m per day ▼ 10% State avg: 3h 21m per day · National avg: 3h 26m per day
Physical Therapist Info Hours per resident per day provided by licensed Physical Therapists (PTs) or PT Assistants. PT services help residents recover mobility after injury or illness and are especially important for post-acute (short-stay) rehabilitation. 1m per day ▼ 80% State avg: 5m per day · National avg: 4m per day
Weekend RN Info Registered nurse hours specifically on weekends. Facilities sometimes reduce RN presence on Saturdays and Sundays — a low weekend RN figure compared to weekday hours can indicate reduced clinical oversight when most administrative staff are absent. 13m per day ▼ 48% State avg: 25m per day · National avg: 29m per day

Types of Care at Laurelwood Health Care Center

Nursing Home Respite Care

Capacity and availability

This home usually has availability

Occupancy lower than 85% suggests more openings may be available.

Higher occupancy than the Tennessee average: 73%
Occupancy rate 82.4% Rank #112 / 302Occupancy rate — State benchmarkedThis home is ranked 112th out of 302 homes in Tennessee. Shows this facility's occupancy rate versus the Tennessee average, with its Statewide rank out of 302. Higher occupancy signals strong local demand and financial stability.Click the rank badge to see the full State ranking.Click here to see the full State ranking.
Avg. Length of Stay 68 days
Occupancy rate
82.4% Rank #112 / 302Occupancy rate — State benchmarkedThis home is ranked 112th out of 302 homes in Tennessee. Shows this facility's occupancy rate versus the Tennessee average, with its Statewide rank out of 302. Higher occupancy signals strong local demand and financial stability.Click the rank badge to see the full State ranking.Click here to see the full State ranking.
Avg. Length of Stay
68 days
Walk Score
Walk Score: 4 / 100 Rank #489 / 555Walk Score — State benchmarkedThis home is ranked 489th out of 555 homes in Tennessee. Shows how walkable this facility's neighborhood is compared to the average Walk Score across Tennessee SNFs. Higher scores benefit residents, families, and staff.Click the rank badge to see the full State ranking.Click here to see the full State ranking.
Car-dependent. Most errands require a car, with limited nearby walkable options.

Contact Laurelwood Health Care Center

Staffing Data

Reporting period: October 1 – December 31, 2025 (Q4 2025). Source: CMS Payroll-Based Journal report.

Total staff 124
Employees 70
Contractors 54
Staff to resident ratio 2.34:1
34% better than Tennessee average
Tennessee average ratio: 1.75:1 Tennessee average ratio: 1.75:1See full Tennessee ranking
Avg staff/day 28
Average shift 7.5 hours
10% worse than Tennessee average
Tennessee average: 8.3 hours Tennessee average shift: 8.3 hoursSee full Tennessee ranking
Total staff hours (quarter) 19,262

Nursing staff breakdown

Q4 2025 · Oct 1 – Dec 31 More info This data comes from the CMS Payroll-Based Journal report covering October 1 – December 31, 2025.
Registered Nurse

Manages medical care and health needs.

RN Staff 9
Average shift length Info Average shift length. Calculated as total hours divided by days worked and average staff per day. 8.7 hours

This role is partially covered by contractors.

Licensed Practical Nurse

Assists with medical care and medications.

LPN Staff 33
Average shift length Info Average shift length. Calculated as total hours divided by days worked and average staff per day. 8.7 hours

This role is partially covered by contractors.

Certified Nursing Assistant

Helps with daily care and mobility.

CNA Staff 49
Average shift length Info Average shift length. Calculated as total hours divided by days worked and average staff per day. 7.6 hours

This role is partially covered by contractors.

Contractor staffing

Q4 2025 · Oct 1 – Dec 31 More info This data comes from the CMS Payroll-Based Journal report covering October 1 – December 31, 2025.

Total hours from contractors

9.6%

1,842 contractor hours this quarter

Licensed Practical Nurse: 18 Certified Nursing Assistant: 9 Qualified Social Worker: 6 Physical Therapy Assistant: 6 Physical Therapy Aide: 4 Registered Nurse: 4 Respiratory Therapy Technician: 4 Speech Language Pathologist: 3

Staff by category

Q4 2025 · Oct 1 – Dec 31 More info This data comes from the CMS Payroll-Based Journal report covering October 1 – December 31, 2025.
Certified Nursing Assistant409499,84992100%7.6
Licensed Practical Nurse1518334,50892100%8.7
RN Director of Nursing3031,0697076%7.6
Registered Nurse5499069098%8.7
Dietitian1014906672%7.4
Administrator1014886166%8
Nurse Practitioner1014886166%8
Mental Health Service Worker1014636166%7.6
Speech Language Pathologist0333716267%4.9
Nurse Aide in Training2021742527%6.4
Qualified Social Worker0661705762%2.8
Physical Therapy Assistant0661083740%2.4
Respiratory Therapy Technician044803437%2.4
Physical Therapy Aide044803033%2.6
Clinical Nurse Specialist1011933%6.4
49 Certified Nursing Assistant
% of Days 100%
33 Licensed Practical Nurse
% of Days 100%
3 RN Director of Nursing
% of Days 76%
9 Registered Nurse
% of Days 98%
1 Dietitian
% of Days 72%
1 Administrator
% of Days 66%
1 Nurse Practitioner
% of Days 66%
1 Mental Health Service Worker
% of Days 66%
3 Speech Language Pathologist
% of Days 67%
2 Nurse Aide in Training
% of Days 27%
6 Qualified Social Worker
% of Days 62%
6 Physical Therapy Assistant
% of Days 40%
4 Respiratory Therapy Technician
% of Days 37%
4 Physical Therapy Aide
% of Days 33%
1 Clinical Nurse Specialist
% of Days 3%

Penalties and fines

Includes penalties issued in 2024

Federal penalties imposed by CMS for regulatory violations, including civil money penalties (fines) and denials of payment for new Medicare/Medicaid admissions.

Source: CMS Penalties Database (Data as of Jan 2026)

Total fines amount $127K Rank #159 / 177Federal fines — State benchmarkedThis home is ranked 159th out of 177 homes in Tennessee. Shows this facility's cumulative CMS federal fine dollars versus the Tennessee average among facilities with fines, and where it ranks among 177 skilled nursing facilities in the pool. Lower total dollars mean a better rank.Click the rank badge to see the full State ranking.Click here to see the full State ranking.
47% higher than Tennessee average

Tennessee average: $86K

Number of fines 1
43% fewer fines than Tennessee average

Tennessee average: 1.7

Payment Denials Info Serious action where Medicare and/or Medicaid temporarily stops payments for new residents until issues are fixed. 1
96% more payment denials than Tennessee average

Tennessee average: 0.5

Fines amount comparison
This facility $127K
Tennessee average $86K
Penalty History

Penalties are imposed by CMS for violations of federal nursing home regulations.

2 penalties in the past 3 years

Multiple penalties were reported in the last 3 years.

Civil Money Penalty Info Fines imposed for noncompliance, which can be assessed per day or per instance of violation. Mar 26, 2024
$127K
Payment Denial Info Serious action where Medicare and/or Medicaid temporarily stops payments for new residents until issues are fixed. Mar 26, 2024
21 days

Last updated: Jan 2026

Quality of care over time

These measures show how residents usually do over time at this home, based on health outcomes and preventive care.

High-risk clinical events score Info A composite score based on pressure ulcers, falls with injury, weight loss, walking ability decline, and activities of daily living decline. 6.6
37% better than Tennessee average

Tennessee average: 10.5

Functional decline score Info A composite score based on activities of daily living decline, walking ability decline, and incontinence. 13.4
31% better than Tennessee average

Tennessee average: 19.5

Long-stay resident measures
Below average Info CMS star rating based on long-stay quality measure performance. 5 stars = significantly above average, 1 star = significantly below average.
Need for Help with Daily Activities Increased Info Percent of long-stay residents whose need for help with daily activities has increased 13.0%
19% better than Tennessee average

Tennessee average: 16.0%

Walking Ability Worsened Info Percent of long-stay residents whose ability to move independently worsened 6.3%
71% better than Tennessee average

Tennessee average: 21.7%

Low Risk Residents with Bowel/Bladder Incontinence Info Percent of low risk long-stay residents who lose control of their bowels or bladder 21.0%
In line with Tennessee average

Tennessee average: 20.7%

Falls with Major Injury Info Percent of long-stay residents experiencing one or more falls with major injury 3.9%
8% worse than Tennessee average

Tennessee average: 3.7%

High Risk Residents with Pressure Ulcers Info Percent of long-stay high risk residents with pressure ulcers 5.5%
In line with Tennessee average

Tennessee average: 5.4%

Urinary Tract Infection Info Percent of long-stay residents with a urinary tract infection 1.5%
27% better than Tennessee average

Tennessee average: 2.1%

Lost Too Much Weight Info Percent of long-stay residents who lose too much weight 4.0%
37% better than Tennessee average

Tennessee average: 6.3%

Depressive Symptoms Info Percent of long-stay residents who have depressive symptoms 3.8%
66% better than Tennessee average

Tennessee average: 11.0%

Antipsychotic Use Info Percent of long-stay residents who received an antipsychotic medication 23.7%
43% worse than Tennessee average

Tennessee average: 16.5%

Pneumococcal Vaccine Info Percent of long-stay residents assessed and appropriately given the pneumococcal vaccine 84.7%
6% worse than Tennessee average

Tennessee average: 89.9%

Influenza Vaccine Info Percent of long-stay residents assessed and appropriately given the seasonal influenza vaccine 96.2%
In line with Tennessee average

Tennessee average: 94.5%

Hospitalizations per 1,000 days Info Number of hospitalizations per 1,000 long-stay resident days. 2.53
60% worse than Tennessee average

Tennessee average: 1.58

ED visits per 1,000 days Info Number of outpatient emergency department visits per 1,000 long-stay resident days. 2.96
89% worse than Tennessee average

Tennessee average: 1.57

Short-stay resident measures
Pneumococcal Vaccine Info Percent of short-stay residents assessed and appropriately given the pneumococcal vaccine 52.5%
34% worse than Tennessee average

Tennessee average: 79.7%

Antipsychotic medication increase Info Percent of short-stay residents who newly received an antipsychotic medication 20.0%
1077% worse than Tennessee average

Tennessee average: 1.7%

Falls with major injury Info Percentage of SNF residents who experience falls with major injury during their stay. 4.6%
491% worse than Tennessee average

Tennessee average: 0.8%

Breakdown by payment type

Medicare

21% of new residents, usually for short-term rehab.

Typical stay 26 days

Private pay

22% of new residents, often for short stays.

Typical stay 1 - 2 months

Medicaid

57% of new residents, often for long-term daily care.

Typical stay 3 - 4 months

Facility Characteristics

Source: CMS Long-Term Care Facility Characteristics (Data as of Jan 2026)

Total residents 53
Medicare
5
9.4% of residents
Medicaid
40
75.5% of residents
Private pay or other
8
15.1% of residents
Programs & Services
Residents Group

Residents meet regularly to discuss policies, care quality, and activities

Nurse Aide Training

State-approved Nurse Aide Training and Competency Evaluation Program on-site

Active Resident Council

Organized group of residents that meets regularly to discuss facility policies, quality of life, and activities.

Finances and operations

Voluntary non-profit community
Operated by a church.
Home revenue
$7.0M
Surplus of revenue
$798.5K
Voluntary non-profit community Operated by a church.
Home revenue
$7.0M Rank #156 / 176Revenue — State benchmarkedThis home is ranked 156th out of 176 homes in Tennessee. Shows this facility's annual revenue compared to the Tennessee SNF average. Higher revenue generally means more resources for staffing and capital — read alongside Payroll %.Click the rank badge to see the full State ranking.Click here to see the full State ranking.
Surplus of revenue
$798.5K
Payroll costs Info The portion of the home's budget spent on staff, including nurses, caregivers, and other employees who support care and operations. Rank #156 / 176Payroll — State benchmarkedThis home is ranked 156th out of 176 homes in Tennessee. Shows total annual staff payroll benchmarked to the Tennessee average. Higher payroll investment relative to peers often signals better staffing and less reliance on cheaper contract labor.Click the rank badge to see the full State ranking.Click here to see the full State ranking.
$2.9M
41.1% of revenue Rank #111 / 176Payroll % — State benchmarkedThis home is ranked 111th out of 176 homes in Tennessee. Shows payroll as a percentage of revenue versus the Tennessee average. Well-run Tennessee SNFs typically land around 50–60% — the top third Statewide. Below 25% may signal understaffing or heavy agency use — read with Staffing ratings.Click the rank badge to see the full State ranking.Click here to see the full State ranking.
Other operating costs Info All remaining costs needed to run the home, such as food, utilities, building maintenance, supplies and administrative expenses.
$3.3M
Total costs $6.2M

What does this home offer?

Housing options icon

Housing Options: Private / Shared Rooms

Building type icon
Building type icon

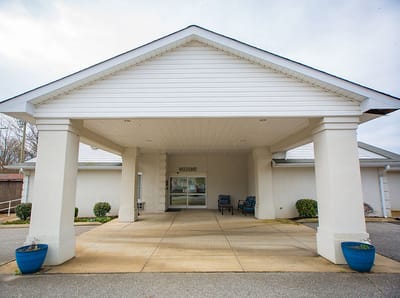
Building Type: Single-story

Dining services icon

Dining Services

Beauty services icon

Beauty Services

Housekeeping icon
Housekeeping icon

Housekeeping Services

Social and recreational activities icon

Social and Recreational Activities

On-site medical care and health services icon

On-site Medical Care and Health Services

Rehabilitative support icon

Rehabilitative Support

Who this home usually serves

TYPE OF STAY

Mostly long-term care residents

Most residents stay for extended periods and receive ongoing daily care.

Places of interest near Laurelwood Health Care Center

Address 2.3 miles from city center Info Estimated distance in miles from Jackson's city center to Laurelwood Health Care Center's address, calculated via Google Maps.

Calculate Travel Distance to Laurelwood Health Care Center

Add your location

Address

Financial Assistance for
Nursing Home in Tennessee

Laurelwood Health Care Center is located in Jackson, Tennessee.
Here are the financial assistance programs available to residents in Tennessee.

Get Financial aid guidance

CHOICES Program

TN Medicaid CHOICES

Age 65+ or disabled
General Tennessee resident, Medicaid-eligible, nursing home-level care need.
Income Limits (2025) ~$2,829/month 300% FBR, individual
Asset Limits $2,000 (individual), $3,000 (couple).
TN

Managed care model; high rural demand.

Benefits
Personal care (5-7 hours/day) Respite (240 hours/year) Adult day care ($65/day) Home modifications ($1,500 avg.)

Tennessee Options for Community Living

TN Options

Age 60+
General Tennessee resident, at risk of nursing home.
Income Limits ~$2,000/month individual, varies
Asset Limits $5,000 individual
TN

Limited funding; rural/urban balance.

Benefits
In-home care (3-5 hours/week) Respite (up to 10 days/year) Transportation (~5 trips/month)

Medicare Savings Program (MSP)

Tennessee Medicare Savings Program

Age 65+ or disabled
General TN resident, Medicare Part A/B.
Income Limits (2025) ~$2,510/month (QMB), ~$3,380/month (SLMB), ~$3,598/month (QI)—individual.
Asset Limits $9,430 (individual), $14,130 (couple).
TN

Three tiers; includes Extra Help for Part D; no waitlist.

Benefits
Covers Part B premiums ($174.70/month) Deductibles ($240/year) Copays (~20%)

Family Caregiver Support Program (FCSP)

Tennessee Family Caregiver Support Program

Age
General Caregivers of 60+ needing care or 55+ caregivers of others; TN resident; functional needs (2+ ADLs).
Income Limits (2025) No strict cap; prioritizes low-income ~$24,980/year
Asset Limits Not assessed; need-based.
TN

Includes grandparent caregivers; high rural demand.

Benefits
Respite (4-6 hours/week or 5 days/year) Adult day care ($60/day) Training Supplies (~$500/year)

VA Aid and Attendance (A&A) and Housebound Benefits

Tennessee VA Aid and Attendance/Housebound

Age 65+ or disabled veteran/spouse
General TN resident, wartime service, need for ADL help (A&A) or homebound.
Income Limits (2025) Net income < ~$1,984/month (veteran with dependent, A&A); pension offsets income.
Asset Limits ~$155,356 net worth limit
TN

High veteran population; supports rural/urban care needs.

Benefits
Cash (~$1,433-$2,642/month veteran, ~$951-$1,318 spouse) for care costs (e.g., in-home, assisted living)

Elderly Nutrition Program

Tennessee Elderly Nutrition Program

Age 60+
General TN resident; no income limit but prioritizes low-income.
Income Limits (2025) None; donations encouraged.
Asset Limits Not assessed.
TN

Serves ~50,000 annually; 200+ congregate sites plus Meals on Wheels.

Benefits
Congregate meals ($5-$7/meal value) at senior centers Home-delivered meals ($5-$7/meal)

Property Tax Relief Program

Tennessee Property Tax Relief Program

Age 65+
General TN resident, homeowner/renter (or widow/er 50+, disabled 18+).
Income Limits (2025) ~$45,000/year household, excludes half of Social Security
Asset Limits Not assessed; income-focused.
TN

Rebates up to $1,000; serves ~100,000 annually.

Benefits
Tax rebates (~$250-$1,000 based on income; e.g., $1,000 if income < $8,000)

Frequently Asked Questions about Laurelwood Health Care Center

Is Laurelwood Health Care Center in a walkable area?

Laurelwood Health Care Center has a walk score of 4. Car-dependent. Most errands require a car, with limited nearby walkable options.

What is the address of Laurelwood Health Care Center?

Laurelwood Health Care Center is located at 200 Birch St, Jackson, TN 38301.

What is the phone number of Laurelwood Health Care Center?

(731) 422-5641 will put you in contact with the team at Laurelwood Health Care Center.

Is Laurelwood Health Care Center Medicare or Medicaid certified?

Yes — Laurelwood Health Care Center is a CMS-certified provider of Medicare and Medicaid.

Guides for Better Senior Living

Care Cost Calculator: See Prices in Your Area

Nursing Home Data Explorer

Don’t Wait Too Long: 7 Red Flag Signs Your Parent Needs Assisted Living Now

The True Cost of Assisted Living in 2025 – And How Families Are Paying For It

Understanding Senior Living Costs: Pricing Models, Discounts & Financial Assistance

Explore Open Rooms
1 Contact details
2 What type of senior care service are you looking for?
3 What budget do you have in mind for senior care?
4 How soon do you need to find care?
5 Additional details

Thank you for your interest!

Our team will be in touch shortly to help with next steps.