Legend of Lititz
Nursing Home, Assisted Living, Independent Living, Memory Care & Respite Care · Pennsylvania, PA
CMS overall rating Info CMS (the Centers for Medicare & Medicaid Services) is the federal agency that rates nursing home quality. Its Overall Rating runs from 1 to 5 stars, combining health inspections, staffing, and quality measures, with inspections weighted most heavily.

Legend of Lititz

Nursing Home, Assisted Living, Independent Living, Memory Care & Respite Care · Pennsylvania, PA
CMS overall rating Info CMS (the Centers for Medicare & Medicaid Services) is the federal agency that rates nursing home quality. Its Overall Rating runs from 1 to 5 stars, combining health inspections, staffing, and quality measures, with inspections weighted most heavily.
Calculator: See prices in your area
Legend of Lititz accepts Medicare, Medicaid, and private pay.

Overview of Legend of Lititz

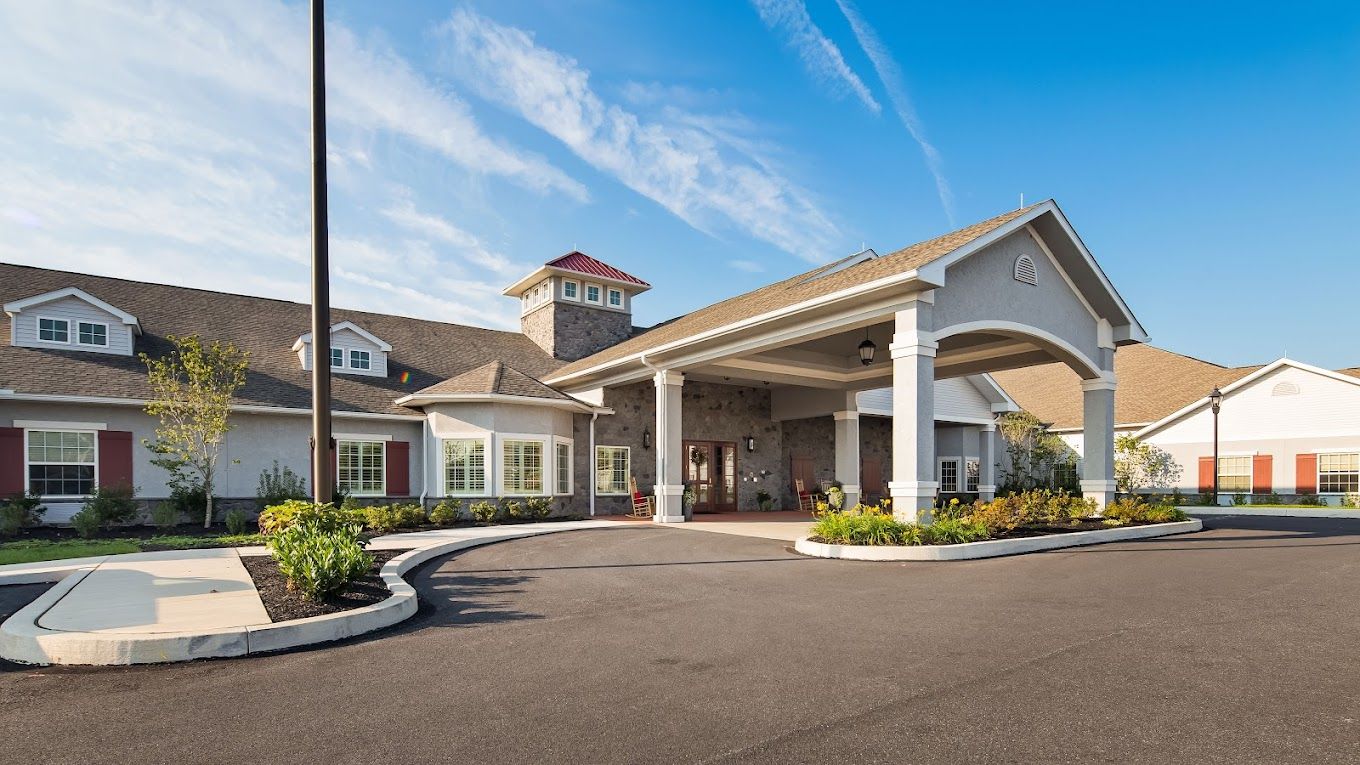
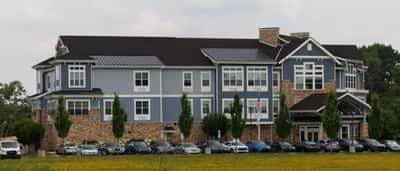
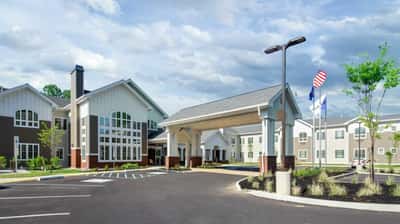
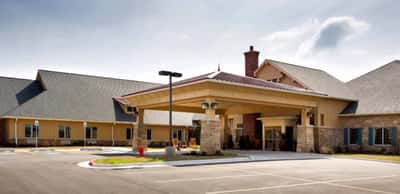
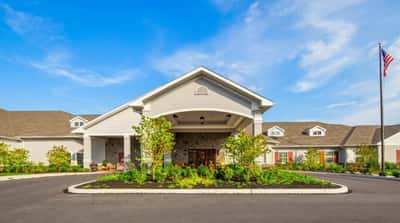
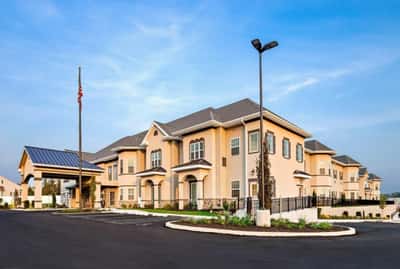
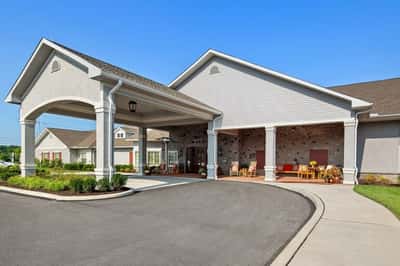
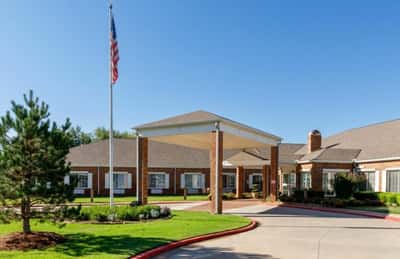
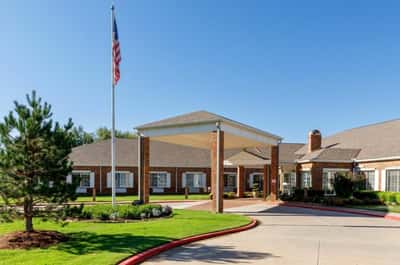
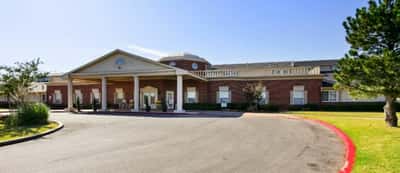
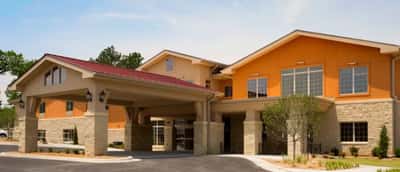
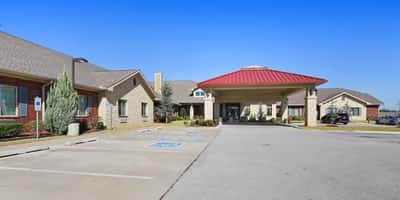
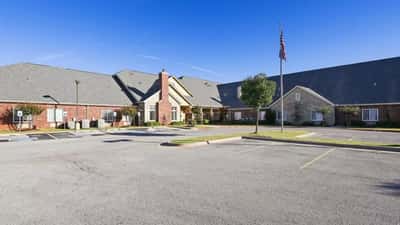
Located in Warwick Township near Lititz, Pennsylvania, Legend of Lititz is a 42-bed skilled nursing facility owned by Shannon Kidd and operated by Legend SL, a network of 23 senior living communities across multiple states. The facility is classified as a nursing home with integrated assisted living and memory care services, accepting Medicare short-term residents and longer-stay Medicaid and private-pay admissions. Lancaster General Health’s Kissel Hill campus stands less than half a mile away.

The census runs at 37 residents, with admission patterns heavily weighted toward Medicaid (42%) and Medicare (40%), and typical stays averaging 145 days. At 95.8% occupancy, the facility is among the state’s highest-demand communities, ranking 13th in Pennsylvania by occupancy rate.

The facility’s 1-star CMS rating reflects documented, substantial quality of care deficiencies across multiple measures. Long-stay residents show alarming rates of pressure ulcer development; 10.9% of high-risk residents, or nearly double Pennsylvania’s average, suggesting systemic failures in skin care or repositioning protocols.

Walking ability deteriorated in more than one-third of long-stay residents (35.5%), substantially worse than state experience, indicating inadequate mobility programming or therapeutic attention.

High-risk clinical event scoring reaches 16.2, nearly 50% worse than state average, and functional decline indicators are correspondingly poor.

Vaccination compliance lags significantly: only 63% of residents received appropriate pneumococcal vaccine and 82% received flu vaccine, both well below state targets.

Positive quality outcomes include an exceptionally low major injury fall rate (0.8%) and zero urinary tract infections, suggesting some care protocols function well.

Staffing combines 71 full-time employees with no temporary or contract labor, yielding a resident-to-staff ratio slightly above state average. Yet payroll consumption of 43.4% of revenue ranks lowest among Pennsylvania facilities, 199th of 205, suggesting wage constraints or insufficient care-delivery staffing despite favorable ratios on paper. The facility reported $71,400 in profit against $7.5 million revenue in 2023, a razor-thin 1.0% margin.

A six-day payment denial occurred in April 2025, marking the facility’s first recent CMS enforcement action. This represents 397% higher payment denial frequency than the Pennsylvania average, signaling current-year compliance problems not reflected in the no-fine historical record.

The facility’s 1-star rating and recent payment denial reflect ongoing quality and compliance challenges that extend beyond financial or occupancy trends.

(717) 723-9928

Quality ratings

Measured by Centers for Medicare & Medicaid Services (CMS)

Overall rating Info The Overall CMS Rating combines results from health inspections, staffing levels and quality measures. Health inspections carry the most weight. Staffing and quality scores can increase or decrease the final rating based on performance compared to state and national standards.
▼ 66.6% Below PA avg. ▼ 66.6% Below PA avg.PA average: 3.0Click the badge to see the full State ranking.Click here to see the full State ranking.
Health Inspection Info Based on the results of the facility's three most recent standard inspections and any complaint investigations. CMS reviews the number, scope, and severity of deficiencies, with more recent findings weighted more heavily.
▼ 64.3% Below PA avg. ▼ 64.3% Below PA avg.PA average: 2.8Click the badge to see the full State ranking.Click here to see the full State ranking.
Staffing Info Measures average nursing staff hours per resident per day, including Registered Nurses (RNs) and total nursing staff. Ratings are adjusted based on the level of care residents require and are compared to state and national benchmarks.
▼ 70.5% Below PA avg. ▼ 70.5% Below PA avg.PA average: 3.4Click the badge to see the full State ranking.Click here to see the full State ranking.
Quality Measures Info Based on clinical and physical health indicators reported to CMS, such as hospital readmissions, falls, pressure ulcers, and improvements in mobility. These measures reflect how well residents' health needs are being managed.
▼ 70.5% Below PA avg. ▼ 70.5% Below PA avg.PA average: 3.4Click the badge to see the full State ranking.Click here to see the full State ranking.

Staffing hours breakdown

Info Daily nursing hours per resident by staff type, reported to CMS. Higher is generally better — compare this facility to state and national averages to see where staffing stands.

Hours per resident per day — compared to Pennsylvania state averages

Total nursing care / resident Info This home is ranked 141st out of 207 homes in Pennsylvania for nurse hours. Total adjusted nursing hours per resident per day, combining RN, LPN, and aide time. CMS adjusts this for case-mix so facilities can be fairly compared.
3h 57m per day
Rank #141 / 207Nurse hours — State benchmarkedThis home is ranked 141st out of 207 homes in Pennsylvania. Shows adjusted nurse hours per resident per day benchmarked to the Pennsylvania average, with a ranking across 207 Pennsylvania facilities. More hours mean more direct care. The national average is about 3.5 hrs; below 3.0 is a red flag.Rankings are based only on facilities in Pennsylvania that report data for that category. Facilities without available data are excluded from the ranking.Click the rank badge to see the full State ranking.Click here to see the full State ranking.
This facility Pennsylvania avg (4h 9m per day)
vs Pennsylvania avg
-5%

4 of 6 metrics below state avg

Standout metric Weekend RN is +15% above state avg
Staff typeHours / Day / Residentvs state avg
Registered Nurse (RN) Info RNs hold the highest nursing license and can assess residents, interpret test results, and direct care plans. More RN hours per day often signals stronger clinical oversight and faster response to health changes. 53m per day ▲ 14% State avg: 47m per day · National avg: 41m per day
LPN / LVN Info Licensed Practical Nurses (LPNs) or Licensed Vocational Nurses (LVNs) deliver routine hands-on care — medication administration, wound dressing, and monitoring vital signs. They work under RN supervision and make up a large share of daily bedside care. 45m per day ▼ 17% State avg: 54m per day · National avg: 52m per day
Nurse Aide Info Certified Nurse Aides (CNAs) provide the most direct day-to-day assistance: bathing, dressing, feeding, and mobility. Nurse aide hours are typically the largest staffing category and directly affect residents' quality of life. 1h 22m per day ▼ 38% State avg: 2h 12m per day · National avg: 2h 20m per day
Weekend Total Nursing Info Combined nursing hours (RN + LPN + Nurse Aide) per resident per day on weekends. Staffing often drops on weekends — this figure reveals whether the facility maintains adequate coverage outside of weekday hours. 2h 49m per day ▼ 20% State avg: 3h 32m per day · National avg: 3h 27m per day
Physical Therapist Info Hours per resident per day provided by licensed Physical Therapists (PTs) or PT Assistants. PT services help residents recover mobility after injury or illness and are especially important for post-acute (short-stay) rehabilitation. 4m per day ▼ 31% State avg: 6m per day · National avg: 4m per day
Weekend RN Info Registered nurse hours specifically on weekends. Facilities sometimes reduce RN presence on Saturdays and Sundays — a low weekend RN figure compared to weekday hours can indicate reduced clinical oversight when most administrative staff are absent. 38m per day ▲ 15% State avg: 33m per day · National avg: 29m per day

Capacity and availability

This home is often near full

Higher occupancy than the Pennsylvania average: 78.7%
Occupancy rate
95.8% Rank #12 / 518Occupancy rate — State benchmarkedThis home is ranked 12th out of 518 homes in Pennsylvania. Shows this facility's occupancy rate versus the Pennsylvania average, with its Statewide rank out of 518. Higher occupancy signals strong local demand and financial stability.Rankings are based only on facilities in Pennsylvania that report data for that category. Facilities without available data are excluded from the ranking.Click the rank badge to see the full State ranking.Click here to see the full State ranking.
Avg. Length of Stay
145 days
Bed community size
42-bed community Rank #490 / 555Bed count — State benchmarkedThis home is ranked 490th out of 555 homes in Pennsylvania. Shows this facility's certified or reported bed count compared to other Pennsylvania facilities. Larger communities may offer more amenities, programs, and on-site services for residents and families.Rankings are based only on facilities in Pennsylvania that report data for that category. Facilities without available data are excluded from the ranking.Click the rank badge to see the full State ranking.Click here to see the full State ranking.
A moderately sized community that may balance personal attention with shared amenities and social activities.
Walk Score
Walk Score: 25 / 100 Rank #501 / 668Walk Score — State benchmarkedThis home is ranked 501st out of 668 homes in Pennsylvania. Shows how walkable this facility's neighborhood is compared to the average Walk Score across Pennsylvania facilities. Higher scores benefit residents, families, and staff.Rankings are based only on facilities in Pennsylvania that report data for that category. Facilities without available data are excluded from the ranking.Click the rank badge to see the full State ranking.Click here to see the full State ranking.
Somewhat walkable. A few nearby services may be reachable on foot, but most trips require transportation.

Contact Legend of Lititz

Staffing Data

Reporting period: October 1 – December 31, 2025 (Q4 2025). Source: CMS Payroll-Based Journal report.

Total staff 71
Employees 71
Contractors 0
Staff to resident ratio 1.92 : 1
5% more staff per resident than Pennsylvania average
Pennsylvania average ratio: 1.83 : 1 Pennsylvania average ratio: 1.83 : 1See full Pennsylvania ranking
Avg staff/day 21
Average shift 7.8 hours
0% compared with Pennsylvania average
Pennsylvania average: 7.8 hours Pennsylvania average shift: 7.8 hoursSee full Pennsylvania ranking
Total staff hours (quarter) 15,079

Nursing staff breakdown

Q4 2025 · Oct 1 – Dec 31 More info This data comes from the CMS Payroll-Based Journal report covering October 1 – December 31, 2025.
Registered Nurse

Manages medical care and health needs.

RN Staff Info All 19 RN Staff are full-time employees. No contractors work on this role. 19
Average shift length Info Average shift length. Calculated as total hours divided by days worked and average staff per day. 8.1 hours
Licensed Practical Nurse

Assists with medical care and medications.

LPN Staff Info All 12 LPN Staff are full-time employees. No contractors work on this role. 12
Average shift length Info Average shift length. Calculated as total hours divided by days worked and average staff per day. 8.1 hours
Certified Nursing Assistant

Helps with daily care and mobility.

CNA Staff Info All 21 CNA Staff are full-time employees. No contractors work on this role. 21
Average shift length Info Average shift length. Calculated as total hours divided by days worked and average staff per day. 8 hours

Contractor staffing

Q4 2025 · Oct 1 – Dec 31 More info This data comes from the CMS Payroll-Based Journal report covering October 1 – December 31, 2025.
Total hours from contractors 0% — all staff are direct employees this quarter

Staff by category

Q4 2025 · Oct 1 – Dec 31 More info This data comes from the CMS Payroll-Based Journal report covering October 1 – December 31, 2025.
Certified Nursing Assistant210214,95792100%8
Licensed Practical Nurse120122,74092100%8.1
Registered Nurse190192,36092100%8.1
Physical Therapy Aide3039906571%7.1
Speech Language Pathologist3039887177%7.2
Nurse Practitioner2024936065%7.6
Other Dietary Services Staff1014686267%7.5
Administrator1014666166%7.6
Dietitian1013855155%7.5
Physical Therapy Assistant3033735257%7
Clinical Nurse Specialist1013594852%7.5
Respiratory Therapy Technician2022504043%6.2
Mental Health Service Worker1012292932%7.9
Qualified Social Worker101221314%1.7
21 Certified Nursing Assistant
% of Days 100%
12 Licensed Practical Nurse
% of Days 100%
19 Registered Nurse
% of Days 100%
3 Physical Therapy Aide
% of Days 71%
3 Speech Language Pathologist
% of Days 77%
2 Nurse Practitioner
% of Days 65%
1 Other Dietary Services Staff
% of Days 67%
1 Administrator
% of Days 66%
1 Dietitian
% of Days 55%
3 Physical Therapy Assistant
% of Days 57%
1 Clinical Nurse Specialist
% of Days 52%
2 Respiratory Therapy Technician
% of Days 43%
1 Mental Health Service Worker
% of Days 32%
1 Qualified Social Worker
% of Days 14%

Penalties and fines

Includes penalties issued in 2025

Federal penalties imposed by CMS for regulatory violations, including civil money penalties (fines) and denials of payment for new Medicare/Medicaid admissions.

Source: CMS Penalties Database (Data as of Jan 2026)

Total fines amount $0 Rank #1 / 210Federal fines — State benchmarkedThis home is ranked 1st out of 210 homes in Pennsylvania. Shows this facility's cumulative CMS federal fine dollars versus the Pennsylvania average among facilities with fines, and where it ranks among 210 facilities in the pool. Lower total dollars mean a better rank.Rankings are based only on facilities in Pennsylvania that report data for that category. Facilities without available data are excluded from the ranking.Click the rank badge to see the full State ranking.Click here to see the full State ranking.
100% lower than Pennsylvania average

Pennsylvania average: $59K

Number of fines 0
100% fewer fines than Pennsylvania average

Pennsylvania average: 2.1

Payment Denials Info Serious action where Medicare and/or Medicaid temporarily stops payments for new residents until issues are fixed. 1
397% more payment denials than Pennsylvania average

Pennsylvania average: 0.2

Fines amount comparison
This facility $0
Pennsylvania average $59K
Penalty History

Penalties are imposed by CMS for violations of federal nursing home regulations.

1 penalty in the past 3 years

Apr 29, 2025 · 6 days

Payment Denial Info Serious action where Medicare and/or Medicaid temporarily stops payments for new residents until issues are fixed. Apr 29, 2025
6 days

Last updated: Jan 2026

Quality of care over time

These measures show how residents usually do over time at this home, based on health outcomes and preventive care.

High-risk clinical events score Info A composite score based on pressure ulcers, falls with injury, weight loss, walking ability decline, and activities of daily living decline. 16.2
48% worse than Pennsylvania average

Pennsylvania average: 11.0

Functional decline score Info A composite score based on activities of daily living decline, walking ability decline, and incontinence. 31.7
43% worse than Pennsylvania average

Pennsylvania average: 22.2

Long-stay resident measures
Need for Help with Daily Activities Increased Info Percent of long-stay residents whose need for help with daily activities has increased 27.4%
44% worse than Pennsylvania average

Pennsylvania average: 19.0%

Walking Ability Worsened Info Percent of long-stay residents whose ability to move independently worsened 35.5%
68% worse than Pennsylvania average

Pennsylvania average: 21.1%

Low Risk Residents with Bowel/Bladder Incontinence Info Percent of low risk long-stay residents who lose control of their bowels or bladder 32.2%
21% worse than Pennsylvania average

Pennsylvania average: 26.7%

Falls with Major Injury Info Percent of long-stay residents experiencing one or more falls with major injury 0.8%
74% better than Pennsylvania average

Pennsylvania average: 3.2%

High Risk Residents with Pressure Ulcers Info Percent of long-stay high risk residents with pressure ulcers 10.9%
98% worse than Pennsylvania average

Pennsylvania average: 5.5%

Urinary Tract Infection Info Percent of long-stay residents with a urinary tract infection 0.0%
100% better than Pennsylvania average

Pennsylvania average: 1.8%

Lost Too Much Weight Info Percent of long-stay residents who lose too much weight 6.5%
In line with Pennsylvania average

Pennsylvania average: 6.6%

Depressive Symptoms Info Percent of long-stay residents who have depressive symptoms 2.1%
62% better than Pennsylvania average

Pennsylvania average: 5.5%

Antipsychotic Use Info Percent of long-stay residents who received an antipsychotic medication 11.3%
34% better than Pennsylvania average

Pennsylvania average: 17.1%

Pneumococcal Vaccine Info Percent of long-stay residents assessed and appropriately given the pneumococcal vaccine 63.1%
27% worse than Pennsylvania average

Pennsylvania average: 86.9%

Influenza Vaccine Info Percent of long-stay residents assessed and appropriately given the seasonal influenza vaccine 81.8%
13% worse than Pennsylvania average

Pennsylvania average: 93.5%

Short-stay resident measures
Pneumococcal Vaccine Info Percent of short-stay residents assessed and appropriately given the pneumococcal vaccine 30.3%
56% worse than Pennsylvania average

Pennsylvania average: 68.8%

Antipsychotic medication increase Info Percent of short-stay residents who newly received an antipsychotic medication 1.0%
37% better than Pennsylvania average

Pennsylvania average: 1.5%

Influenza Vaccine Info Percent of short-stay residents assessed and appropriately given the seasonal influenza vaccine 42.1%
39% worse than Pennsylvania average

Pennsylvania average: 68.7%

Breakdown by payment type

Medicare

40% of new residents, usually for short-term rehab.

Typical stay 1 - 2 months

Private pay

18% of new residents, often for short stays.

Typical stay 9 - 10 months

Medicaid

42% of new residents, often for long-term daily care.

Typical stay 5 - 6 months

Facility Characteristics

Source: CMS Long-Term Care Facility Characteristics (Data as of Jan 2026)

Total residents 37
Medicare
12
32.4% of residents
Medicaid
19
51.4% of residents
Private pay or other
6
16.2% of residents
Programs & Services
Residents Group

Residents meet regularly to discuss policies, care quality, and activities

Active Resident Council

Organized group of residents that meets regularly to discuss facility policies, quality of life, and activities.

Finances and operations

Based on CMS SNF Cost Report for fiscal year ending in 12/2023.

Privately-owned community
Operated by a single business entity.
Net patient revenue Info Net patient revenue — what the home actually collects for resident care, after contractual allowances, bad debt and discounts are subtracted from its gross charges (CMS cost report, Worksheet G-3). It covers resident care only; money the home earns from other sources is shown separately as "Other income."
$5.0M
Net patient income Info Net patient income: net patient revenue minus the home's total operating expenses. A positive figure means it earns more from resident care than it spends to deliver it; a negative figure means the opposite. It excludes non-operating "other income."
$70.8K
Privately-owned community Operated by a single business entity.
Net patient revenue Info Net patient revenue — what the home actually collects for resident care, after contractual allowances, bad debt and discounts are subtracted from its gross charges (CMS cost report, Worksheet G-3). It covers resident care only; money the home earns from other sources is shown separately as "Other income."
$5.0M Rank #195 / 209Revenue — State benchmarkedThis home is ranked 195th out of 209 homes in Pennsylvania. Shows this facility's annual revenue compared to the Pennsylvania average. Higher revenue generally means more resources for staffing and capital — read alongside Payroll %.Rankings are based only on facilities in Pennsylvania that report data for that category. Facilities without available data are excluded from the ranking.Click the rank badge to see the full State ranking.Click here to see the full State ranking.
Net patient income Info Net patient income: net patient revenue minus the home's total operating expenses. A positive figure means it earns more from resident care than it spends to deliver it; a negative figure means the opposite. It excludes non-operating "other income."
$70.8K
Other income Info Money the home earns outside of resident care — such as investments, grants, rentals and other non-operating sources (CMS cost report, Worksheet G-3). It is tracked separately from net patient revenue: it is not part of that figure, and it is not included in net patient income.
$669
Payroll costs Info Staff salaries plus wage-related costs — benefits such as payroll taxes, health insurance and retirement — from the home's own accounting records (CMS cost report, Worksheet A). Contract or agency labor is counted separately, under other operating costs. Rank #203 / 209Payroll — State benchmarkedThis home is ranked 203rd out of 209 homes in Pennsylvania. Shows total annual staff payroll benchmarked to the Pennsylvania average. Higher payroll investment relative to peers often signals better staffing and less reliance on cheaper contract labor.Rankings are based only on facilities in Pennsylvania that report data for that category. Facilities without available data are excluded from the ranking.Click the rank badge to see the full State ranking.Click here to see the full State ranking.
$2.4M 48% of net patient revenue Info Payroll as a share of revenue: staff salaries and wage-related benefits divided by net patient revenue. A higher figure means more of each revenue dollar goes to staff pay. Rank #131 / 209Payroll % — State benchmarkedThis home is ranked 131st out of 209 homes in Pennsylvania. Shows payroll as a percentage of revenue versus the Pennsylvania average. Well-run Pennsylvania facilities typically land around 53–61% — the top third Statewide. Below 25% may signal understaffing or heavy agency use — read with Staffing ratings.Rankings are based only on facilities in Pennsylvania that report data for that category. Facilities without available data are excluded from the ranking.Click the rank badge to see the full State ranking.Click here to see the full State ranking.
Other operating costs Info Everything it costs to run the home apart from payroll — food, utilities, supplies, maintenance, contract labor and administration. Calculated as total operating expense minus payroll (staff salaries and wage-related benefits).
$2.6M
Total costs Info The home's total operating expense for the year — all the costs of running it, salaries included (CMS cost report, Worksheet G-3).
$5.0M

What does this home offer?

Housing options icon

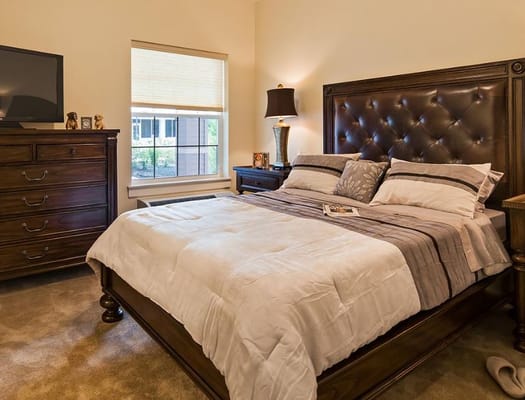
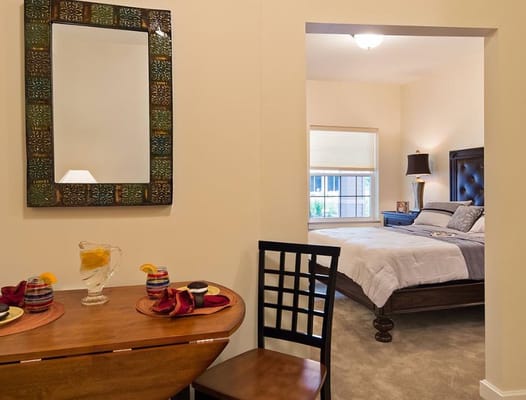
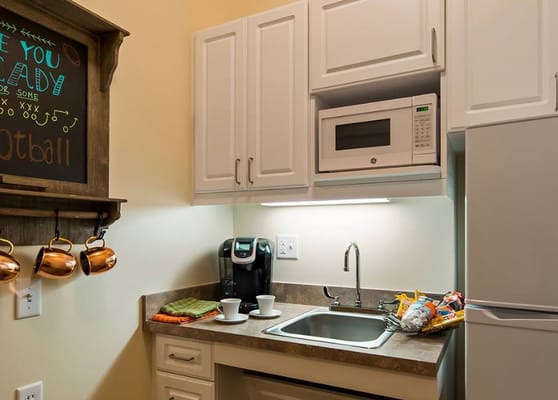
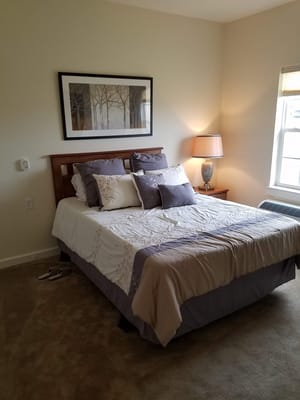
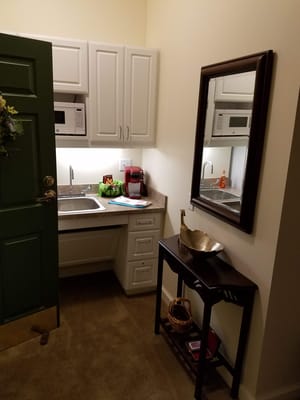
Housing Options: 1 Bed / 2 Bed

Building type icon
Building type icon

Building Type: Single-story

Transportation services icon

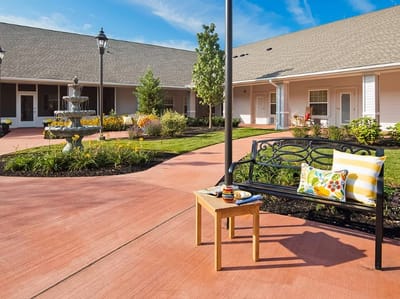
Transportation Services

Fitness and recreation icon

Fitness and Recreation

Type of Rooms Available

1 Bed
1 Bed
1 Bed
1 / 4
1 Bed
1
425 - 610 sq. ft
2 Bed
2 Bed
2 Bed
1 / 4
2 Bed
1
775 sq. ft

Who this home usually serves

TYPE OF STAY

Mostly long-term care residents

Most residents stay for extended periods and receive ongoing daily care.

New residents most often arrive under Medicaid (42% of admissions), and a typical Medicaid stay runs around 5 - 6 months.

Admissions
106 total

Coverage residents most often arrive under.

Medicare 40%
Private pay 18%
Medicaid 42%
Discharges
101 total

Coverage residents most often leave under.

Medicare 39%
Private pay 25%
Medicaid 37%

Places of interest near Legend of Lititz

Address 2.7 miles from city center Info Estimated distance in miles from Lititz's city center to Legend of Lititz's address, calculated via Google Maps.

Calculate Travel Distance to Legend of Lititz

Add your location

Address

Financial Assistance for
Assisted Living in Pennsylvania

Legend of Lititz is located in Lititz, Pennsylvania.
Here are the financial assistance programs available to residents in Pennsylvania.

Get Financial aid guidance

Community HealthChoices (CHC)

PA Medicaid CHC

Age 65+ or disabled
General Pennsylvania resident, Medicaid-eligible, nursing home-level care need.
Income Limits (2025) ~$2,829/month 300% FBR, individual
Asset Limits $2,000 (individual), $3,000 (couple) (excludes home, car).
PA

Managed care model; high urban demand (e.g., Philadelphia, Pittsburgh).

Benefits
Personal care (5-7 hours/day, e.g., bathing, dressing) Respite care (up to 240 hours/year) Adult day care ($70/day) Home modifications ($1,500 avg.)

Pennsylvania OPTIONS Program

PA OPTIONS

Age 60+
General Pennsylvania resident, at risk of nursing home placement.
Income Limits ~$2,000/month individual, varies by region
Asset Limits $8,000 individual
PA

Cost-sharing required above certain income; rural/urban balance.

Benefits
In-home care (3-5 hours/week) Respite (up to 10 days/year) Adult day care (~$70/day) Transportation (~5 trips/month)

Living Independence for the Elderly (LIFE)

Pennsylvania LIFE (PACE)

Age 55+
General PA resident (specific counties), NFLOC, safe with LIFE support.
Income Limits (2025) ~$2,829/month (Medicaid-eligible); private pay option available.
Asset Limits $2,000 (individual), $3,000 (couple) for Medicaid enrollees.
PA

16 providers in 25 counties (e.g., Allegheny, Luzerne); LIFE branding unique to PA.

Benefits
Personal care (5-7 hours/day) Medical care Meals Transportation Respite Therapies

Medicare Savings Program (MSP)

Pennsylvania Medicare Savings Program

Age 65+ or disabled
General PA resident, Medicare Part A/B.
Income Limits (2025) ~$2,510/month (QMB), ~$3,380/month (SLMB), ~$3,598/month (QI)—individual.
Asset Limits $9,430 (individual), $14,130 (couple).
PA

Three tiers; includes Extra Help for Part D; no waitlist.

Benefits
Covers Part B premiums ($174.70/month) Deductibles ($240/year) Copays (~20%)

Family Caregiver Support Program (FCSP)

Pennsylvania Family Caregiver Support Program

Age
General Caregivers of 60+ needing care or 55+ caregivers of others; PA resident; functional needs (2+ ADLs).
Income Limits (2025) No strict cap; reimbursements up to $600/month if care recipient income < ~$2,322/month 185% FPL
Asset Limits Not assessed; need-based.
PA

High demand; includes grandparent caregivers.

Benefits
Respite (4-6 hours/week or 5 days/year) Adult day care ($60/day) Supplies (~$2,000/year) Caregiver training

VA Aid and Attendance (A&A) and Housebound Benefits

Pennsylvania VA Aid and Attendance/Housebound

Age 65+ or disabled veteran/spouse
General PA resident, wartime service, need for ADL help (A&A) or homebound.
Income Limits (2025) Net income < ~$1,984/month (veteran with dependent, A&A); pension offsets income.
Asset Limits ~$155,356 net worth limit
PA

High veteran population; supports rural/urban care needs.

Benefits
Cash (~$1,433-$2,642/month veteran, ~$951-$1,318 spouse) for care costs (e.g., in-home, assisted living)

Property Tax/Rent Rebate Program (PTRR)

Pennsylvania Property Tax/Rent Rebate Program

Age 65+
General PA resident, homeowner/renter (or widow/er 50+, disabled 18+).
Income Limits (2025) ~$45,000/year individual or couple, excludes half of Social Security
Asset Limits Not assessed; income-focused.
PA

Rebates up to $1,000; ~600,000 eligible annually.

Benefits
Rebates ($250-$1,000 based on income; e.g., $1,000 if income < $8,000)

Senior Farmers’ Market Nutrition Program (SFMNP)

Pennsylvania SFMNP

Age 60+
General PA resident, low-income.
Income Limits (2025) ~$2,322/month individual, 185% FPL
Asset Limits Not assessed.
PA

Vouchers (~$50/season) via 52 AAAs; serves ~200,000 annually.

Benefits
Vouchers (~$50/season) for fresh produce at approved markets

More homes from the same operator

Operated by Legend SL

Frequently Asked Questions about Legend of Lititz

What neighborhood is Legend of Lititz in?

Legend of Lititz is in the Warwick Township neighborhood.

Is Legend of Lititz in a walkable area?

Legend of Lititz has a walk score of 25. Somewhat walkable. A few nearby services may be reachable on foot, but most trips require transportation.

What is the occupancy rate at Legend of Lititz?

Legend of Lititz's occupancy is 95.8%.

Are there photos of Legend of Lititz?

Yes — there are 5 photos of Legend of Lititz in the photo gallery on this page.

What is the address of Legend of Lititz?

Legend of Lititz is located at 80 W Millport Rd, Lititz, PA 17543.

What is the phone number of Legend of Lititz?

(717) 723-9928 will put you in contact with the team at Legend of Lititz.

Is Legend of Lititz Medicare or Medicaid certified?

Yes — Legend of Lititz is a CMS-certified provider of Medicare and Medicaid.

Guides for Better Senior Living

Care Cost Calculator: See Prices in Your Area

Nursing Home Data Explorer

Don’t Wait Too Long: 7 Red Flag Signs Your Parent Needs Assisted Living Now

The True Cost of Assisted Living in 2025 – And How Families Are Paying For It

Understanding Senior Living Costs: Pricing Models, Discounts & Financial Assistance