Magnolia Manor – Rock Hill
Nursing Home, Assisted Living, Independent Living & Memory Care · Rock Hill, SC
CMS overall rating Info CMS (the Centers for Medicare & Medicaid Services) is the federal agency that rates nursing home quality. Its Overall Rating runs from 1 to 5 stars, combining health inspections, staffing, and quality measures, with inspections weighted most heavily.

Magnolia Manor – Rock Hill

Nursing Home, Assisted Living, Independent Living & Memory Care · Rock Hill, SC
CMS overall rating Info CMS (the Centers for Medicare & Medicaid Services) is the federal agency that rates nursing home quality. Its Overall Rating runs from 1 to 5 stars, combining health inspections, staffing, and quality measures, with inspections weighted most heavily.
Calculator: See prices in your area
Magnolia Manor – Rock Hill accepts Medicare, Medicaid, and private pay.

Overview of Magnolia Manor – Rock Hill

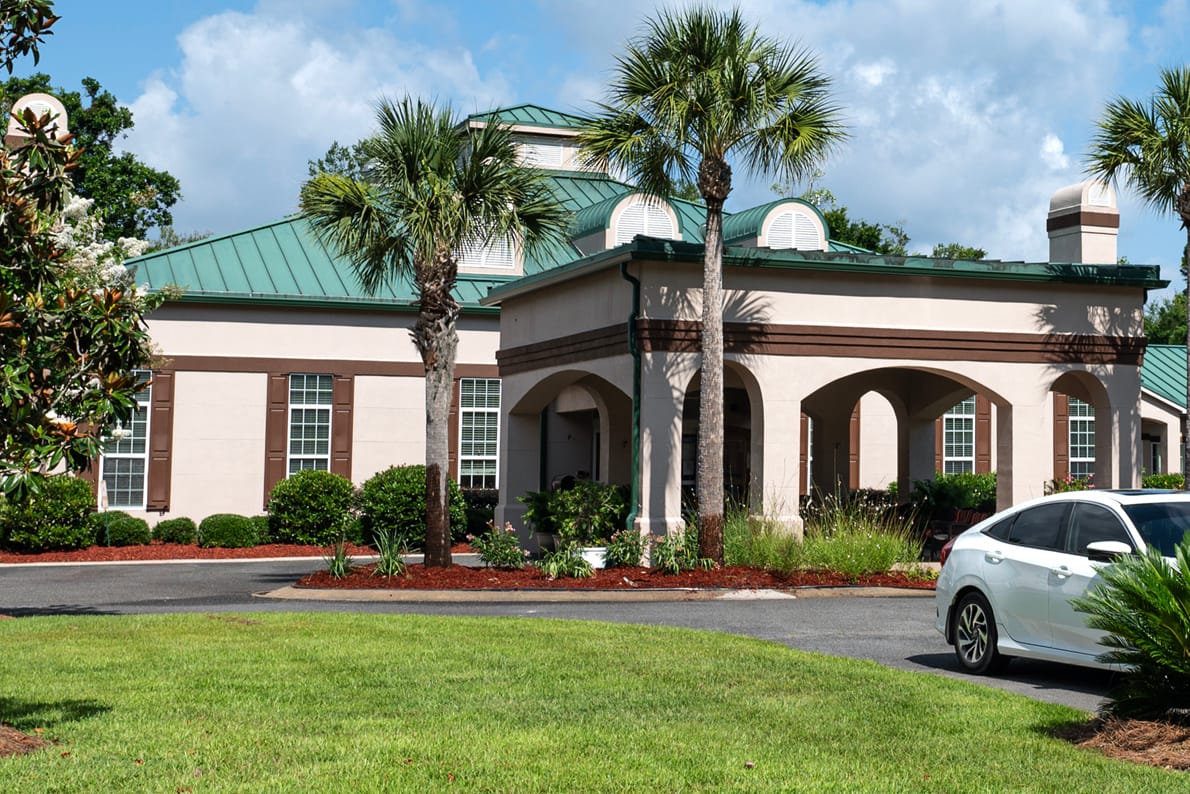
Magnolia Manor of Rock Hill, situated in the heart of Rock Hill, South Carolina, is a distinguished assisted living community committed to providing personalized skilled nursing services. Their approach is centered around addressing the unique needs of each patient, ensuring comprehensive care and support.
At Magnolia Manor, their mission is clear: to offer a professional and honest approach to healthcare. With a focus on integrity and dedication, they are dedicated to delivering top-quality care that places the well-being and comfort of their residents at the forefront of their mission.

Quality ratings

Measured by Centers for Medicare & Medicaid Services (CMS)

Overall rating Info The Overall CMS Rating combines results from health inspections, staffing levels and quality measures. Health inspections carry the most weight. Staffing and quality scores can increase or decrease the final rating based on performance compared to state and national standards.
▼ 64.8% Below SC avg. ▼ 64.8% Below SC avg.SC average: 2.8Click the badge to see the full State ranking.Click here to see the full State ranking.
Health Inspection Info Based on the results of the facility's three most recent standard inspections and any complaint investigations. CMS reviews the number, scope, and severity of deficiencies, with more recent findings weighted more heavily.
▼ 63.5% Below SC avg. ▼ 63.5% Below SC avg.SC average: 2.7Click the badge to see the full State ranking.Click here to see the full State ranking.
Staffing Info Measures average nursing staff hours per resident per day, including Registered Nurses (RNs) and total nursing staff. Ratings are adjusted based on the level of care residents require and are compared to state and national benchmarks.
▼ 30.8% Below SC avg. ▼ 30.8% Below SC avg.SC average: 2.9Click the badge to see the full State ranking.Click here to see the full State ranking.
Quality Measures Info Based on clinical and physical health indicators reported to CMS, such as hospital readmissions, falls, pressure ulcers, and improvements in mobility. These measures reflect how well residents' health needs are being managed.
▲ 19.0% Above SC avg. ▲ 19.0% Above SC avg.SC average: 3.4Click the badge to see the full State ranking.Click here to see the full State ranking.

Staffing hours breakdown

Info Daily nursing hours per resident by staff type, reported to CMS. Higher is generally better — compare this facility to state and national averages to see where staffing stands.

Hours per resident per day — compared to South Carolina state averages

Total nursing care / resident Info This home is ranked 89th out of 121 homes in South Carolina for nurse hours. Total adjusted nursing hours per resident per day, combining RN, LPN, and aide time. CMS adjusts this for case-mix so facilities can be fairly compared.
3h 24m per day
Rank #89 / 121Nurse hours — State benchmarkedThis home is ranked 89th out of 121 homes in South Carolina. Shows adjusted nurse hours per resident per day benchmarked to the South Carolina average, with a ranking across 121 South Carolina facilities. More hours mean more direct care. The national average is about 3.5 hrs; below 3.0 is a red flag.Rankings are based only on facilities in South Carolina that report data for that category. Facilities without available data are excluded from the ranking.Click the rank badge to see the full State ranking.Click here to see the full State ranking.
This facility South Carolina avg (4h 0m per day)
vs South Carolina avg
-15%

5 of 6 metrics below state avg

Staff typeHours / Day / Residentvs state avg
Registered Nurse (RN) Info RNs hold the highest nursing license and can assess residents, interpret test results, and direct care plans. More RN hours per day often signals stronger clinical oversight and faster response to health changes. 21m per day ▼ 46% State avg: 38m per day · National avg: 41m per day
LPN / LVN Info Licensed Practical Nurses (LPNs) or Licensed Vocational Nurses (LVNs) deliver routine hands-on care — medication administration, wound dressing, and monitoring vital signs. They work under RN supervision and make up a large share of daily bedside care. 59m per day ■ Avg State avg: 1h 0m per day · National avg: 52m per day
Nurse Aide Info Certified Nurse Aides (CNAs) provide the most direct day-to-day assistance: bathing, dressing, feeding, and mobility. Nurse aide hours are typically the largest staffing category and directly affect residents' quality of life. 1h 53m per day ▼ 15% State avg: 2h 13m per day · National avg: 2h 20m per day
Weekend Total Nursing Info Combined nursing hours (RN + LPN + Nurse Aide) per resident per day on weekends. Staffing often drops on weekends — this figure reveals whether the facility maintains adequate coverage outside of weekday hours. 2h 51m per day ▼ 15% State avg: 3h 22m per day · National avg: 3h 27m per day
Physical Therapist Info Hours per resident per day provided by licensed Physical Therapists (PTs) or PT Assistants. PT services help residents recover mobility after injury or illness and are especially important for post-acute (short-stay) rehabilitation. 2m per day ▼ 63% State avg: 5m per day · National avg: 4m per day
Weekend RN Info Registered nurse hours specifically on weekends. Facilities sometimes reduce RN presence on Saturdays and Sundays — a low weekend RN figure compared to weekday hours can indicate reduced clinical oversight when most administrative staff are absent. 8m per day ▼ 70% State avg: 25m per day · National avg: 29m per day

Capacity and availability

This home usually has limited availability

Higher occupancy than the South Carolina average: 82.1%
Occupancy rate
91.5% Rank #22 / 131Occupancy rate — State benchmarkedThis home is ranked 22nd out of 131 homes in South Carolina. Shows this facility's occupancy rate versus the South Carolina average, with its Statewide rank out of 131. Higher occupancy signals strong local demand and financial stability.Rankings are based only on facilities in South Carolina that report data for that category. Facilities without available data are excluded from the ranking.Click the rank badge to see the full State ranking.Click here to see the full State ranking.
Avg. Length of Stay
138 days
Bed community size
106-bed community Rank #101 / 309Bed count — State benchmarkedThis home is ranked 101st out of 309 homes in South Carolina. Shows this facility's certified or reported bed count compared to other South Carolina facilities. Larger communities may offer more amenities, programs, and on-site services for residents and families.Rankings are based only on facilities in South Carolina that report data for that category. Facilities without available data are excluded from the ranking.Click the rank badge to see the full State ranking.Click here to see the full State ranking.
A larger shared setting that may offer more common spaces and organized community services.
Walk Score
Walk Score: 60 / 100 Rank #19 / 232Walk Score — State benchmarkedThis home is ranked 19th out of 232 homes in South Carolina. Shows how walkable this facility's neighborhood is compared to the average Walk Score across South Carolina facilities. Higher scores benefit residents, families, and staff.Rankings are based only on facilities in South Carolina that report data for that category. Facilities without available data are excluded from the ranking.Click the rank badge to see the full State ranking.Click here to see the full State ranking.
Moderately walkable. Some errands can be accomplished on foot, with a mix of nearby amenities.

Therapy & Rehabilitation

2 services
Rehabilitation Services
Respite Care

Additional Services

1 service
Supportive Housing

Amenities & Lifestyle

Specific ProgramsCatered Living

Contact Magnolia Manor – Rock Hill

Staffing Data

Reporting period: October 1 – December 31, 2025 (Q4 2025). Source: CMS Payroll-Based Journal report.

Total staff 211
Employees 87
Contractors 124
Staff to resident ratio 2.11 : 1
15% more staff per resident than South Carolina average
South Carolina average ratio: 1.84 : 1 South Carolina average ratio: 1.84 : 1See full South Carolina ranking
Avg staff/day 44
Average shift 8.2 hours
0% compared with South Carolina average
South Carolina average: 7.9 hours South Carolina average shift: 7.9 hoursSee full South Carolina ranking
Total staff hours (quarter) 33,356

Nursing staff breakdown

Q4 2025 · Oct 1 – Dec 31 More info This data comes from the CMS Payroll-Based Journal report covering October 1 – December 31, 2025.
Registered Nurse

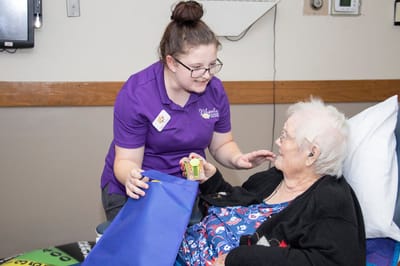
Manages medical care and health needs.

RN Staff Info 9 total: 3 full-time employees and 6 contractors. 9
Average shift length Info Average shift length. Calculated as total hours divided by days worked and average staff per day. 10.7 hours
Licensed Practical Nurse

Assists with medical care and medications.

LPN Staff Info 42 total: 18 full-time employees and 24 contractors. 42
Average shift length Info Average shift length. Calculated as total hours divided by days worked and average staff per day. 9.3 hours
Certified Nursing Assistant

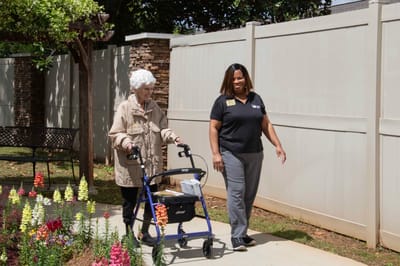
Helps with daily care and mobility.

CNA Staff Info 118 total: 43 full-time employees and 75 contractors. 118
Average shift length Info Average shift length. Calculated as total hours divided by days worked and average staff per day. 8 hours

Contractor staffing

Q4 2025 · Oct 1 – Dec 31 More info This data comes from the CMS Payroll-Based Journal report covering October 1 – December 31, 2025.

Total hours from contractors

16.1%

5,357 contractor hours this quarter

Certified Nursing Assistant: 75 Licensed Practical Nurse: 24 Registered Nurse: 6 Respiratory Therapy Technician: 5 Physical Therapy Aide: 5 Speech Language Pathologist: 3 Physical Therapy Assistant: 3 Qualified Social Worker: 3

Staff by category

Q4 2025 · Oct 1 – Dec 31 More info This data comes from the CMS Payroll-Based Journal report covering October 1 – December 31, 2025.
Certified Nursing Assistant437511816,62992100%8
Licensed Practical Nurse1824428,40292100%9.3
Registered Nurse3691,6478997%10.7
Dental Services Staff2029737379%7.8
Clinical Nurse Specialist3039266470%8
Other Dietary Services Staff110118907278%7.9
Speech Language Pathologist0335346571%8.2
Dietitian1015316571%8.2
Physical Therapy Aide0555226672%7.3
Nurse Practitioner1014725964%8
Administrator1014645863%8
Physical Therapy Assistant0334426166%7.2
RN Director of Nursing3033404549%7.4
Respiratory Therapy Technician0552707480%3.3
Nurse Aide in Training1011692123%8
Qualified Social Worker0331473841%3.9
118 Certified Nursing Assistant
% of Days 100%
42 Licensed Practical Nurse
% of Days 100%
9 Registered Nurse
% of Days 97%
2 Dental Services Staff
% of Days 79%
3 Clinical Nurse Specialist
% of Days 70%
11 Other Dietary Services Staff
% of Days 78%
3 Speech Language Pathologist
% of Days 71%
1 Dietitian
% of Days 71%
5 Physical Therapy Aide
% of Days 72%
1 Nurse Practitioner
% of Days 64%
1 Administrator
% of Days 63%
3 Physical Therapy Assistant
% of Days 66%
3 RN Director of Nursing
% of Days 49%
5 Respiratory Therapy Technician
% of Days 80%
1 Nurse Aide in Training
% of Days 23%
3 Qualified Social Worker
% of Days 41%

Penalties and fines

Includes penalties issued in 2023-2025

Federal penalties imposed by CMS for regulatory violations, including civil money penalties (fines) and denials of payment for new Medicare/Medicaid admissions.

Source: CMS Penalties Database (Data as of Jan 2026)

Total fines amount $127K Rank #123 / 123Federal fines — State benchmarkedThis home is ranked 123rd out of 123 homes in South Carolina. Shows this facility's cumulative CMS federal fine dollars versus the South Carolina average among facilities with fines, and where it ranks among 123 facilities in the pool. Lower total dollars mean a better rank.Rankings are based only on facilities in South Carolina that report data for that category. Facilities without available data are excluded from the ranking.Click the rank badge to see the full State ranking.Click here to see the full State ranking.
279% higher than South Carolina average

South Carolina average: $34K

Number of fines 5
105% more fines than South Carolina average

South Carolina average: 2.4

Payment Denials Info Serious action where Medicare and/or Medicaid temporarily stops payments for new residents until issues are fixed. 0
100% fewer payment denials than South Carolina average

South Carolina average: 0.1

Fines amount comparison
This facility $127K
South Carolina average $34K
Penalty History

Penalties are imposed by CMS for violations of federal nursing home regulations.

5 penalties in the past 3 years

Multiple penalties were reported in the last 3 years.

Civil Money Penalty Info Fines imposed for noncompliance, which can be assessed per day or per instance of violation. Jan 13, 2025
$13K
Civil Money Penalty Info Fines imposed for noncompliance, which can be assessed per day or per instance of violation. Mar 25, 2024
$95K
Civil Money Penalty Info Fines imposed for noncompliance, which can be assessed per day or per instance of violation. Nov 6, 2023
$4K
Civil Money Penalty Info Fines imposed for noncompliance, which can be assessed per day or per instance of violation. Aug 24, 2023
$8K

Last updated: Jan 2026

Quality of care over time

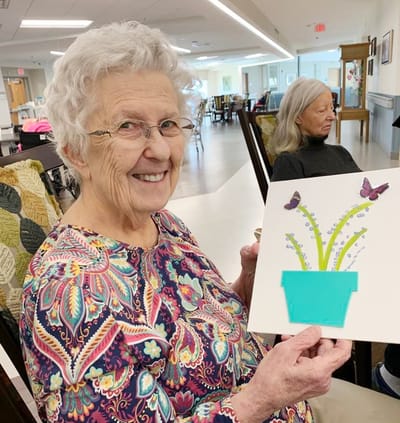
These measures show how residents usually do over time at this home, based on health outcomes and preventive care.

High-risk clinical events score Info A composite score based on pressure ulcers, falls with injury, weight loss, walking ability decline, and activities of daily living decline. 11.6
32% worse than South Carolina average

South Carolina average: 8.7

Functional decline score Info A composite score based on activities of daily living decline, walking ability decline, and incontinence. 19.6
27% worse than South Carolina average

South Carolina average: 15.5

Long-stay resident measures
Need for Help with Daily Activities Increased Info Percent of long-stay residents whose need for help with daily activities has increased 14.9%
14% worse than South Carolina average

South Carolina average: 13.1%

Walking Ability Worsened Info Percent of long-stay residents whose ability to move independently worsened 25.4%
57% worse than South Carolina average

South Carolina average: 16.2%

Low Risk Residents with Bowel/Bladder Incontinence Info Percent of low risk long-stay residents who lose control of their bowels or bladder 18.6%
9% worse than South Carolina average

South Carolina average: 17.0%

Falls with Major Injury Info Percent of long-stay residents experiencing one or more falls with major injury 2.4%
20% better than South Carolina average

South Carolina average: 3.0%

High Risk Residents with Pressure Ulcers Info Percent of long-stay high risk residents with pressure ulcers 8.0%
30% worse than South Carolina average

South Carolina average: 6.1%

Urinary Tract Infection Info Percent of long-stay residents with a urinary tract infection 1.8%
9% worse than South Carolina average

South Carolina average: 1.6%

Lost Too Much Weight Info Percent of long-stay residents who lose too much weight 7.3%
18% worse than South Carolina average

South Carolina average: 6.2%

Depressive Symptoms Info Percent of long-stay residents who have depressive symptoms 0.7%
76% better than South Carolina average

South Carolina average: 2.8%

Antipsychotic Use Info Percent of long-stay residents who received an antipsychotic medication 12.0%
17% better than South Carolina average

South Carolina average: 14.5%

Pneumococcal Vaccine Info Percent of long-stay residents assessed and appropriately given the pneumococcal vaccine 80.4%
11% worse than South Carolina average

South Carolina average: 90.5%

Influenza Vaccine Info Percent of long-stay residents assessed and appropriately given the seasonal influenza vaccine 84.0%
7% worse than South Carolina average

South Carolina average: 90.6%

Short-stay resident measures
Pneumococcal Vaccine Info Percent of short-stay residents assessed and appropriately given the pneumococcal vaccine 40.9%
49% worse than South Carolina average

South Carolina average: 79.5%

Antipsychotic medication increase Info Percent of short-stay residents who newly received an antipsychotic medication 1.8%
6% worse than South Carolina average

South Carolina average: 1.7%

Influenza Vaccine Info Percent of short-stay residents assessed and appropriately given the seasonal influenza vaccine 30.7%
61% worse than South Carolina average

South Carolina average: 78.0%

Breakdown by payment type

Medicare

31% of new residents, usually for short-term rehab.

Typical stay 1 - 2 months

Private pay

63% of new residents, often for short stays.

Typical stay 1 - 2 months

Medicaid

6% of new residents, often for long-term daily care.

Typical stay 5 years

Facility Characteristics

Source: CMS Long-Term Care Facility Characteristics (Data as of Jan 2026)

Total residents 100
Medicare
4
4% of residents
Medicaid
84
84% of residents
Private pay or other
12
12% of residents
Programs & Services
Residents Group

Residents meet regularly to discuss policies, care quality, and activities

Active Resident Council

Organized group of residents that meets regularly to discuss facility policies, quality of life, and activities.

Finances and operations

Based on CMS SNF Cost Report for fiscal year ending in 09/2023.

For-profit
Operated by a single business entity.
Net patient revenue Info Net patient revenue — what the home actually collects for resident care, after contractual allowances, bad debt and discounts are subtracted from its gross charges (CMS cost report, Worksheet G-3). It covers resident care only; money the home earns from other sources is shown separately as "Other income."
$10.2M
Net patient income Info Net patient income: net patient revenue minus the home's total operating expenses. A positive figure means it earns more from resident care than it spends to deliver it; a negative figure means the opposite. It excludes non-operating "other income."
$694.5K
For-profit Operated by a single business entity.
Net patient revenue Info Net patient revenue — what the home actually collects for resident care, after contractual allowances, bad debt and discounts are subtracted from its gross charges (CMS cost report, Worksheet G-3). It covers resident care only; money the home earns from other sources is shown separately as "Other income."
$10.2M Rank #55 / 125Revenue — State benchmarkedThis home is ranked 55th out of 125 homes in South Carolina. Shows this facility's annual revenue compared to the South Carolina average. Higher revenue generally means more resources for staffing and capital — read alongside Payroll %.Rankings are based only on facilities in South Carolina that report data for that category. Facilities without available data are excluded from the ranking.Click the rank badge to see the full State ranking.Click here to see the full State ranking.
Net patient income Info Net patient income: net patient revenue minus the home's total operating expenses. A positive figure means it earns more from resident care than it spends to deliver it; a negative figure means the opposite. It excludes non-operating "other income."
$694.5K
Other income Info Money the home earns outside of resident care — such as investments, grants, rentals and other non-operating sources (CMS cost report, Worksheet G-3). It is tracked separately from net patient revenue: it is not part of that figure, and it is not included in net patient income.
$301.0K
Payroll costs Info Staff salaries plus wage-related costs — benefits such as payroll taxes, health insurance and retirement — from the home's own accounting records (CMS cost report, Worksheet A). Contract or agency labor is counted separately, under other operating costs. Rank #80 / 125Payroll — State benchmarkedThis home is ranked 80th out of 125 homes in South Carolina. Shows total annual staff payroll benchmarked to the South Carolina average. Higher payroll investment relative to peers often signals better staffing and less reliance on cheaper contract labor.Rankings are based only on facilities in South Carolina that report data for that category. Facilities without available data are excluded from the ranking.Click the rank badge to see the full State ranking.Click here to see the full State ranking.
$5.1M 50.3% of net patient revenue Info Payroll as a share of revenue: staff salaries and wage-related benefits divided by net patient revenue. A higher figure means more of each revenue dollar goes to staff pay. Rank #108 / 125Payroll % — State benchmarkedThis home is ranked 108th out of 125 homes in South Carolina. Shows payroll as a percentage of revenue versus the South Carolina average. Well-run South Carolina facilities typically land around 53–64% — the top third Statewide. Below 25% may signal understaffing or heavy agency use — read with Staffing ratings.Rankings are based only on facilities in South Carolina that report data for that category. Facilities without available data are excluded from the ranking.Click the rank badge to see the full State ranking.Click here to see the full State ranking.
Other operating costs Info Everything it costs to run the home apart from payroll — food, utilities, supplies, maintenance, contract labor and administration. Calculated as total operating expense minus payroll (staff salaries and wage-related benefits).
$4.4M
Total costs Info The home's total operating expense for the year — all the costs of running it, salaries included (CMS cost report, Worksheet G-3).
$9.5M

Who this home usually serves

TYPE OF STAY

Primarily short stays

Residents typically stay for brief periods, with frequent admissions and discharges throughout the year.

Most new residents arrive under private pay (63% of admissions), and a typical private pay stay runs around 1 - 2 months.

Admissions
239 total

Coverage residents most often arrive under.

Medicare 31%
Private pay 63%
Medicaid 6%
Discharges
257 total

Coverage residents most often leave under.

Medicare 21%
Private pay 54%
Medicaid 25%

Compare Nursing Homes around Rock Hill

The information below is reported by the South Carolina Department of Public Health, Bureau of Healthcare Quality.

5 facilities compared · CMS & SC Dept. of Health data

Rock Hill Post Acute Care Center
NH
Rock Hill
99
Facility 99
SC AVG 90
Rank #118 / 309
85.4%
Facility 85.4%
SC AVG 82.1%
Rank #66 / 131
+4%
3.83
Facility 3.83
SC AVG 4.00
Rank #61 / 121
-41%-4%
$0
Facility $0
SC AVG $34.8k
Rank #1 / 123
7
Facility 7
SC AVG 13.7
Rank #29 / 122
2.3
Facility 2.3
SC AVG 3.4
Rank #30 / 122
-87--Steven Powell
$10.4M
Facility $10.4M
SC AVG $13.0M
Rank #77 / 125
$6.0M
Facility $6.0M
SC AVG $5.4M
Rank #73 / 125
58.1%
Facility 58.1%
SC AVG 44%
Rank #43 / 125
425159
Westminster Towers Residential
NH
AL
IL
Rock Hill
57
Facility 57
SC AVG 90
Rank #229 / 309
84.8%
Facility 84.8%
SC AVG 82.1%
Rank #74 / 131
+3%
4.94
Facility 4.94
SC AVG 4.00
Rank #19 / 121
+50%+24%
$17.0k
Facility $17.0k
SC AVG $34.8k
Rank #96 / 123
8
Facility 8
SC AVG 13.7
Rank #35 / 122
2.7
Facility 2.7
SC AVG 3.4
Rank #40 / 122
26--Kevin Johnson
$11.2M
Facility $11.2M
SC AVG $13.0M
Rank #50 / 125
$5.3M
Facility $5.3M
SC AVG $5.4M
Rank #83 / 125
47.2%
Facility 47.2%
SC AVG 44%
Rank #111 / 125
425291
White Oak Manor Rock Hill
NH
NC
Rock Hill
141
Facility 141
SC AVG 90
Rank #32 / 309
96.1%
Facility 96.1%
SC AVG 82.1%
Rank #6 / 131
+17%
4.38
Facility 4.38
SC AVG 4.00
Rank #32 / 121
-29%+10%
$7.4k
Facility $7.4k
SC AVG $34.8k
Rank #66 / 123
20
Facility 20
SC AVG 13.7
Rank #102 / 122
4.0
Facility 4.0
SC AVG 3.4
Rank #84 / 122
1135A+-Jerrolyn Montgomery-Smalls
$15.0M
Facility $15.0M
SC AVG $13.0M
Rank #48 / 125
$10.0M
Facility $10.0M
SC AVG $5.4M
Rank #17 / 125
66.9%
Facility 66.9%
SC AVG 44%
Rank #27 / 125
425088
Pruitthealth Rock Hill
NH
Rock Hill
132
Facility 132
SC AVG 90
Rank #37 / 309
60.8%
Facility 60.8%
SC AVG 82.1%
Rank #113 / 131
-26%
3.74
Facility 3.74
SC AVG 4.00
Rank #72 / 121
+123%-6%
$0
Facility $0
SC AVG $34.8k
Rank #1 / 123
14
Facility 14
SC AVG 13.7
Rank #74 / 122
3.5
Facility 3.5
SC AVG 3.4
Rank #69 / 122
1103--Pruitthealth Rock Hill LLC
$8.1M
Facility $8.1M
SC AVG $13.0M
Rank #86 / 125
$5.4M
Facility $5.4M
SC AVG $5.4M
Rank #87 / 125
67%
Facility 67%
SC AVG 44%
Rank #59 / 125
425127
Magnolia Manor – Rock Hill
NH
AL
IL
MC
Rock Hill
106
Facility 106
SC AVG 90
Rank #101 / 309
91.5%
Facility 91.5%
SC AVG 82.1%
Rank #22 / 131
+11%
3.41
Facility 3.41
SC AVG 4.00
Rank #89 / 121
-54%-15%
$128.2k
Facility $128.2k
SC AVG $34.8k
Rank #123 / 123
26
Facility 26
SC AVG 13.7
Rank #112 / 122
2.6
Facility 2.6
SC AVG 3.4
Rank #38 / 122
597-
60
Facility 60
SC AVG 32
Rank #19 / 232
Anthony Brice
$10.2M
Facility $10.2M
SC AVG $13.0M
Rank #55 / 125
$5.1M
Facility $5.1M
SC AVG $5.4M
Rank #80 / 125
50.3%
Facility 50.3%
SC AVG 44%
Rank #108 / 125
425165

Financial Assistance for
Nursing Home in South Carolina

Magnolia Manor – Rock Hill is located in Rock Hill, South Carolina.
Here are the financial assistance programs available to residents in South Carolina.

Get Financial aid guidance

Community Long Term Care (CLTC)

SC Medicaid CLTC

Age 65+ or disabled
General South Carolina resident, Medicaid-eligible, nursing home-level care need.
Income Limits (2025) ~$2,829/month 300% FBR, individual
Asset Limits $2,000 (individual), $3,000 (couple).
SC

High rural demand; waitlists possible.

Benefits
Personal care (5-7 hours/day) Respite (240 hours/year) Adult day care ($60/day) Home modifications ($1,500 avg.)

South Carolina Respite Care Program

SC NFCSP Respite

Age Caregiver of someone 60+ (or with dementia)
General South Carolina resident.
Income Limits No strict limit; prioritizes low-income.
Asset Limits Not applicable.
SC

Limited slots; rural/urban balance.

Benefits
In-home respite (4-6 hours/day) Adult day care (~$60/day) Short-term facility care (up to 5 days)

Medicare Savings Program (MSP)

South Carolina Medicare Savings Program

Age 65+ or disabled
General SC resident, Medicare Part A/B.
Income Limits (2025) ~$2,510/month (QMB), ~$3,380/month (SLMB), ~$3,598/month (QI)—individual.
Asset Limits $9,430 (individual), $14,130 (couple).
SC

Three tiers; includes Extra Help for Part D; no waitlist.

Benefits
Covers Part B premiums ($174.70/month) Deductibles ($240/year) Copays (~20%)

VA Aid and Attendance (A&A) and Housebound Benefits

South Carolina VA Aid and Attendance/Housebound

Age 65+ or disabled veteran/spouse
General SC resident, wartime service, need for ADL help (A&A) or homebound.
Income Limits (2025) Net income < ~$1,984/month (veteran with dependent, A&A); pension offsets income.
Asset Limits ~$155,356 net worth limit
SC

High veteran population; supports rural/urban care needs.

Benefits
Cash (~$1,433-$2,642/month veteran, ~$951-$1,318 spouse) for care costs (e.g., in-home, assisted living)

Senior Farmers’ Market Nutrition Program (SFMNP)

South Carolina SFMNP

Age 60+
General SC resident, low-income.
Income Limits (2025) ~$2,322/month individual, 185% FPL
Asset Limits Not assessed.
SC

Vouchers (~$50/season); serves ~20,000 annually via 10 AAAs.

Benefits
Vouchers (~$50/season) for fresh produce at approved markets

Homestead Exemption Program

South Carolina Homestead Exemption

Age 65+ (or disabled/blind)
General SC resident 1+ year, homeowner.
Income Limits (2025) None; tax-based eligibility.
Asset Limits Not assessed; home-focused.
SC

Saves ~$500-$1,000/year avg.; applies to primary residence.

Benefits
Property tax exemption (~$50,000 value, ~$500-$1,000/year savings)

Elderly Simplified Application Project (ESAP)

South Carolina ESAP (SNAP for Seniors)

Age 60+
General SC resident, no earned income, not on SCCAP.
Income Limits (2025) ~$1,732/month 133% FPL, individual
Asset Limits $4,250 individual, higher than standard SNAP
SC

Simplified process; serves ~50,000 seniors annually.

Benefits
EBT card for food (~$100-$300/month based on income)

Frequently Asked Questions about Magnolia Manor – Rock Hill

Is Magnolia Manor – Rock Hill in a walkable area?

Magnolia Manor – Rock Hill has a walk score of 60. Moderately walkable. Some errands can be accomplished on foot, with a mix of nearby amenities.

What is the occupancy rate at Magnolia Manor – Rock Hill?

Magnolia Manor – Rock Hill's occupancy is 91.5%.

Does Magnolia Manor – Rock Hill operate as a for-profit or non-profit?

Magnolia Manor – Rock Hill is registered as a for-profit.

Are there photos of Magnolia Manor – Rock Hill?

Yes — there are 9 photos of Magnolia Manor – Rock Hill in the photo gallery on this page.

What is the phone number of Magnolia Manor – Rock Hill?

(803) 328-6518 will put you in contact with the team at Magnolia Manor – Rock Hill.

Is Magnolia Manor – Rock Hill Medicare or Medicaid certified?

Yes — Magnolia Manor – Rock Hill is a CMS-certified provider of Medicare and Medicaid.

Guides for Better Senior Living

Care Cost Calculator: See Prices in Your Area

Nursing Home Data Explorer

Don’t Wait Too Long: 7 Red Flag Signs Your Parent Needs Assisted Living Now

The True Cost of Assisted Living in 2025 – And How Families Are Paying For It

Understanding Senior Living Costs: Pricing Models, Discounts & Financial Assistance