Martha Franks Baptist Retirement Community
Nursing Home, Assisted Living, Home Care, Independent Living, Memory Care & Respite Care · Laurens, SC
CMS overall rating Info CMS (the Centers for Medicare & Medicaid Services) is the federal agency that rates nursing home quality. Its Overall Rating runs from 1 to 5 stars, combining health inspections, staffing, and quality measures, with inspections weighted most heavily.

Martha Franks Baptist Retirement Community

Nursing Home, Assisted Living, Home Care, Independent Living, Memory Care & Respite Care · Laurens, SC
CMS overall rating Info CMS (the Centers for Medicare & Medicaid Services) is the federal agency that rates nursing home quality. Its Overall Rating runs from 1 to 5 stars, combining health inspections, staffing, and quality measures, with inspections weighted most heavily.
Calculator: See prices in your area
Martha Franks Baptist Retirement Community accepts Medicare, Medicaid, and private pay.

Overview of Martha Franks Baptist Retirement Community

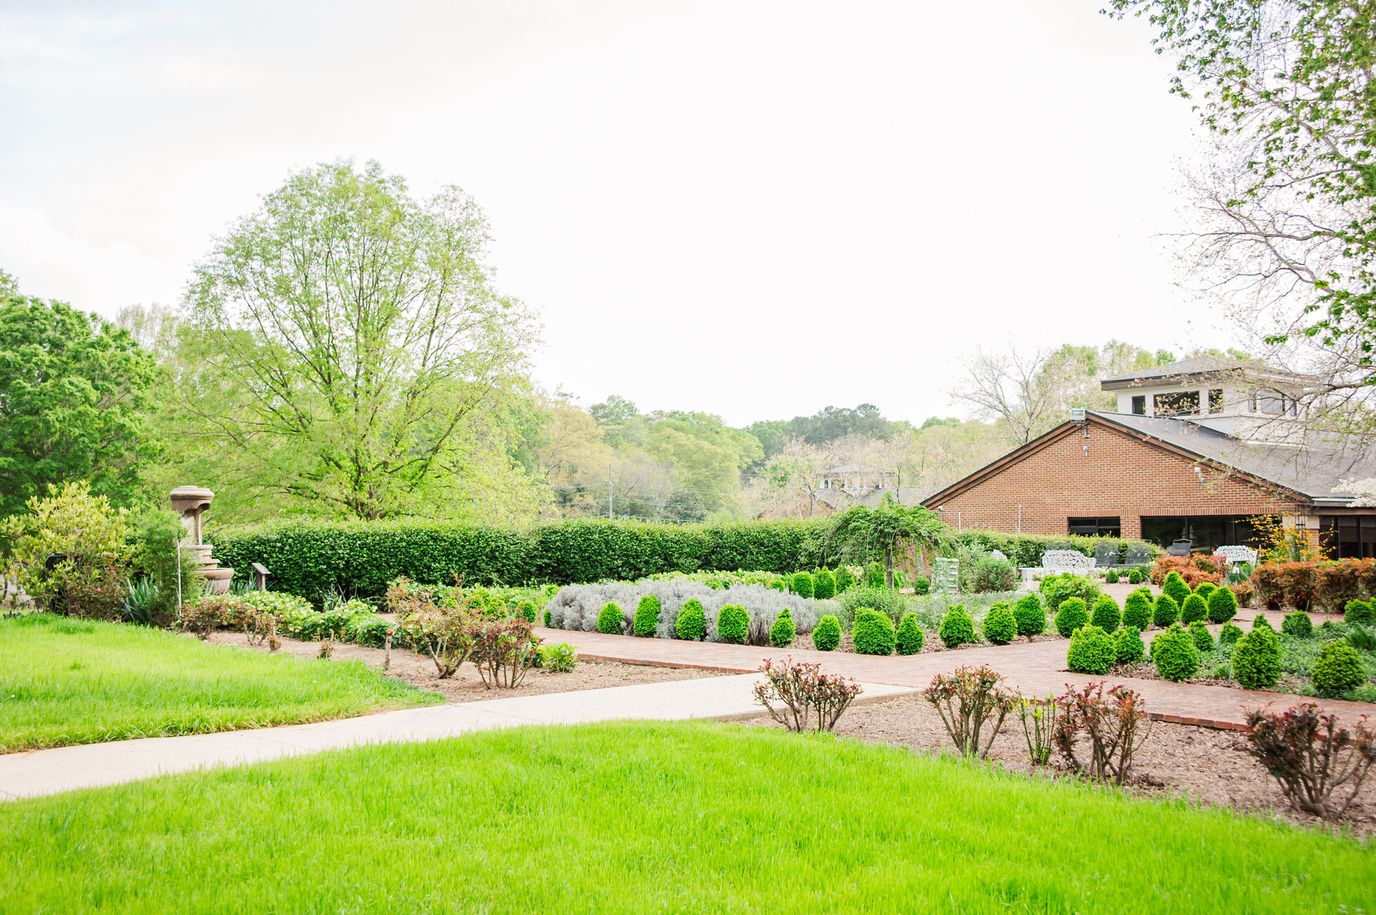
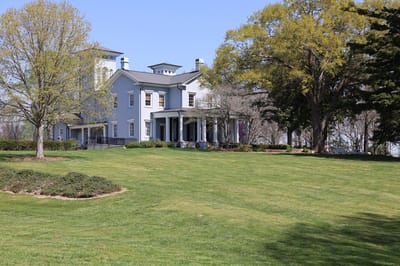
Located in Laurens, South Carolina, Martha Franks Baptist Retirement Community is an 82-bed Life Plan community offering independent living, assisted living, memory care, skilled nursing, and rehabilitation services. South Carolina Baptist Ministries for the Aging Inc. operates the nonprofit community under a Christ-centered mission, one of the few continuing care retirement communities in Laurens County. CMS rates the facility at 2 stars overall, driven by a Health Inspection sub-rating roughly 27% below the South Carolina average. Staffing tells a different story: nurse staffing averages 5 hours and 1 minute per resident per day, about 36% above the state average, ranking it 13th among 112 South Carolina skilled nursing facilities. Quality Measures are also above the state average. The 2-star overall reflects inspection performance, not care delivery. The community accepts Medicare, Medicaid, and private pay. Amenities include a chapel, library, bistro, beauty and barber shop, wellness facilities, and Southern-style dining. Respite care and home care services round out a continuum designed to support residents as their needs shift without requiring relocation to another facility. Its occupancy rate is below the South Carolina average of 82%, suggesting current availability across care levels. Martha Franks Baptist Retirement Community is a good fit for residents and families seeking a faith-based Life Plan community with strong staffing and a full continuum of care, particularly those prioritizing continuity of placement as care needs evolve.

Quality ratings

Measured by Centers for Medicare & Medicaid Services (CMS)

Overall rating Info The Overall CMS Rating combines results from health inspections, staffing levels and quality measures. Health inspections carry the most weight. Staffing and quality scores can increase or decrease the final rating based on performance compared to state and national standards.
Health Inspection Info Based on the results of the facility's three most recent standard inspections and any complaint investigations. CMS reviews the number, scope, and severity of deficiencies, with more recent findings weighted more heavily.
Staffing Info Measures average nursing staff hours per resident per day, including Registered Nurses (RNs) and total nursing staff. Ratings are adjusted based on the level of care residents require and are compared to state and national benchmarks.
Quality Measures Info Based on clinical and physical health indicators reported to CMS, such as hospital readmissions, falls, pressure ulcers, and improvements in mobility. These measures reflect how well residents' health needs are being managed.

Staffing hours breakdown

Info Daily nursing hours per resident by staff type, reported to CMS. Higher is generally better — compare this facility to state and national averages to see where staffing stands.

Hours per resident per day — compared to state averages

Total nursing care / resident Info Total adjusted nursing hours per resident per day, combining RN, LPN, and aide time. CMS adjusts this for case-mix so facilities can be fairly compared.
5h 1m per day
Rank #15 / 121Nurse hours — State benchmarkedThis home is ranked 15th out of 121 homes in South Carolina. Shows adjusted nurse hours per resident per day benchmarked to the South Carolina average, with a ranking across 121 South Carolina facilities. More hours mean more direct care. The national average is about 3.5 hrs; below 3.0 is a red flag.Rankings are based only on facilities in South Carolina that report data for that category. Facilities without available data are excluded from the ranking.Click the rank badge to see the full State ranking.Click here to see the full State ranking.
vs avg
Staff typeHours / Day / Residentvs state avg
Registered Nurse (RN) Info RNs hold the highest nursing license and can assess residents, interpret test results, and direct care plans. More RN hours per day often signals stronger clinical oversight and faster response to health changes. 39m per day
LPN / LVN Info Licensed Practical Nurses (LPNs) or Licensed Vocational Nurses (LVNs) deliver routine hands-on care — medication administration, wound dressing, and monitoring vital signs. They work under RN supervision and make up a large share of daily bedside care. 1h 1m per day
Nurse Aide Info Certified Nurse Aides (CNAs) provide the most direct day-to-day assistance: bathing, dressing, feeding, and mobility. Nurse aide hours are typically the largest staffing category and directly affect residents' quality of life. 2h 32m per day
Weekend Total Nursing Info Combined nursing hours (RN + LPN + Nurse Aide) per resident per day on weekends. Staffing often drops on weekends — this figure reveals whether the facility maintains adequate coverage outside of weekday hours. 3h 36m per day
Physical Therapist Info Hours per resident per day provided by licensed Physical Therapists (PTs) or PT Assistants. PT services help residents recover mobility after injury or illness and are especially important for post-acute (short-stay) rehabilitation. 3m per day
Weekend RN Info Registered nurse hours specifically on weekends. Facilities sometimes reduce RN presence on Saturdays and Sundays — a low weekend RN figure compared to weekday hours can indicate reduced clinical oversight when most administrative staff are absent. 25m per day

Capacity and availability

Avg. Length of Stay
90 days
Bed community size
82-bed community Rank #164 / 309Bed count — State benchmarkedThis home is ranked 164th out of 309 homes in South Carolina. Shows this facility's certified or reported bed count compared to other South Carolina facilities. Larger communities may offer more amenities, programs, and on-site services for residents and families.Rankings are based only on facilities in South Carolina that report data for that category. Facilities without available data are excluded from the ranking.Click the rank badge to see the full State ranking.Click here to see the full State ranking.
A larger shared setting that may offer more common spaces and organized community services.

About this community

Occupancy

Occupancy rate
69%
Rank #108 / 131Occupancy rate — State benchmarkedThis home is ranked 108th out of 131 homes in South Carolina. Shows this facility's occupancy rate versus the South Carolina average, with its Statewide rank out of 131. Higher occupancy signals strong local demand and financial stability.Rankings are based only on facilities in South Carolina that report data for that category. Facilities without available data are excluded from the ranking.Click the rank badge to see the full State ranking.Click here to see the full State ranking.
Lower than the South Carolina average: 82.1%
Occupied beds
56 / 82
Average occupied beds in South Carolina homes 90 beds

License Details

Facility TypeHl- Community Residential Care Facility
StatusActive
CountyLaurens
License NumberCRC-0360
Business TypeCorporation
CMS Certification Number425334

Ownership & Operating Entity

Martha Franks Baptist Retirement Community is legally operated by South Carolina Baptist Ministries For The Aging Inc, and administered by Robert Sprouse.

Owner NameSouth Carolina Baptist Ministries For The Aging Inc

Therapy & Rehabilitation

1 service
Rehabilitation Services

Staffing & Medical

1 service
Licensed Nurses/CNAs

Memory & Specialized Care

1 service
Dedicated Alzheimer's Unit

Contact Information

Amenities & Lifestyle

Library
Beauty/Barber Shop
Bistro
Gift Shop
Chapel
Wellness Facilities
Mail Service
Southern Style Dining
Religious Services

Contact Martha Franks Baptist Retirement Community

Health Inspection History

Inspections since 2021
Total health inspections 5

State average N/A


Last Health inspection on Aug 2024

Total health citations
14 Rank #74 / 122Health citations — State benchmarkedThis home is ranked 74th out of 122 homes in South Carolina. Shows this facility's total health deficiency citations benchmarked to the South Carolina State average, with a ranking across all 122 SC facilities. Lower citation counts earn a better rank.Rankings are based only on facilities in South Carolina that report data for that category. Facilities without available data are excluded from the ranking.Click the rank badge to see the full State ranking.Click here to see the full State ranking.

State average N/A

Citations per inspection
2.8 Rank #48 / 122Citations per inspection — State benchmarkedThis home is ranked 48th out of 122 homes in South Carolina. Shows average deficiency citations per CMS inspection for this facility versus the South Carolina mean across 122 facilities with citation data. Lower is better.Rankings are based only on facilities in South Carolina that report data for that category. Facilities without available data are excluded from the ranking.Click the rank badge to see the full State ranking.Click here to see the full State ranking.

State average N/A


Health citations are formal notices following inspections when they fail to comply with safety and care standards.

11 of 14 citations resulted from standard inspections; and 3 of 14 resulted from complaint investigations.

Breakdown of citation severity (last 5 years)
Critical health citations
2
In line with State average

State average: N/A


Serious health citations
0
In line with State average

State average: N/A

2 critical citations State average: N/A

0 serious citations State average: N/A

12 moderate citations State average: N/A

0 minor citations State average: N/A
Citations history (last 5 years)
Infection Control moderate citation Aug 02, 2024
Corrected

Nutrition moderate citation Aug 02, 2024
Corrected

Quality of Care moderate citation Aug 02, 2024
Corrected

Care Planning moderate citation Aug 02, 2024
Corrected

Staffing Data

Reporting period: October 1 – December 31, 2025 (Q4 2025). Source: CMS Payroll-Based Journal report.

Total staff 115
Employees 109
Contractors 6
Staff to resident ratio 1.46 : 1
0% compared with State average

State average ratio: 0 : 0

Avg staff/day 46
Average shift 8.1 hours
0% compared with State average

State average: 0 hours

Total staff hours (quarter) 34,352

Nursing staff breakdown

Q4 2025 · Oct 1 – Dec 31 More info This data comes from the CMS Payroll-Based Journal report covering October 1 – December 31, 2025.
Registered Nurse

Manages medical care and health needs.

RN Staff Info All 11 RN Staff are full-time employees. No contractors work on this role. 11
Average shift length Info Average shift length. Calculated as total hours divided by days worked and average staff per day. 8.7 hours
Licensed Practical Nurse

Assists with medical care and medications.

LPN Staff Info All 25 LPN Staff are full-time employees. No contractors work on this role. 25
Average shift length Info Average shift length. Calculated as total hours divided by days worked and average staff per day. 8.9 hours
Certified Nursing Assistant

Helps with daily care and mobility.

CNA Staff Info All 64 CNA Staff are full-time employees. No contractors work on this role. 64
Average shift length Info Average shift length. Calculated as total hours divided by days worked and average staff per day. 8 hours

Contractor staffing

Q4 2025 · Oct 1 – Dec 31 More info This data comes from the CMS Payroll-Based Journal report covering October 1 – December 31, 2025.

Total hours from contractors

4.2%

1,436 contractor hours this quarter

Qualified Social Worker: 2 Physical Therapy Aide: 1 Physical Therapy Assistant: 1 Speech Language Pathologist: 1 Respiratory Therapy Technician: 1

Staff by category

Q4 2025 · Oct 1 – Dec 31 More info This data comes from the CMS Payroll-Based Journal report covering October 1 – December 31, 2025.
Certified Nursing Assistant6406418,82292100%8
Licensed Practical Nurse250257,58392100%8.9
Registered Nurse110113,07992100%8.7
Clinical Nurse Specialist3031,2766571%7.7
Nurse Practitioner1014485661%8
Dietitian1014485661%8
Dental Services Staff1014475863%7.7
Physical Therapy Assistant0114257177%6
Speech Language Pathologist0114195358%7.9
Other Dietary Services Staff2024132932%7.5
Administrator1014005054%8
Respiratory Therapy Technician0113475257%6.7
Physical Therapy Aide0112195560%4
Qualified Social Worker0222589%3.2
64 Certified Nursing Assistant
% of Days 100%
25 Licensed Practical Nurse
% of Days 100%
11 Registered Nurse
% of Days 100%
3 Clinical Nurse Specialist
% of Days 71%
1 Nurse Practitioner
% of Days 61%
1 Dietitian
% of Days 61%
1 Dental Services Staff
% of Days 63%
1 Physical Therapy Assistant
% of Days 77%
1 Speech Language Pathologist
% of Days 58%
2 Other Dietary Services Staff
% of Days 32%
1 Administrator
% of Days 54%
1 Respiratory Therapy Technician
% of Days 57%
1 Physical Therapy Aide
% of Days 60%
2 Qualified Social Worker
% of Days 9%

Penalties and fines

Federal penalties imposed by CMS for regulatory violations, including civil money penalties (fines) and denials of payment for new Medicare/Medicaid admissions.

Source: CMS Penalties Database (Data as of Jan 2026)

Total fines amount $85K Rank #1 / 123Federal fines — State benchmarkedThis home is ranked 1st out of 123 homes in South Carolina. Shows this facility's cumulative CMS federal fine dollars versus the South Carolina average among facilities with fines, and where it ranks among 123 facilities in the pool. Lower total dollars mean a better rank.Rankings are based only on facilities in South Carolina that report data for that category. Facilities without available data are excluded from the ranking.Click the rank badge to see the full State ranking.Click here to see the full State ranking.
152% higher than State average

State average: $34K

Number of fines 1
59% fewer fines than State average

State average: 2.4

Payment Denials Info Serious action where Medicare and/or Medicaid temporarily stops payments for new residents until issues are fixed. 0
100% fewer payment denials than State average

State average: 0.1

Fines amount comparison
This facility $85K
State average $34K

No penalties in the past 3 years

No civil money penalties or payment denials were reported in the last 3 years.

Quality of care over time

These measures show how residents usually do over time at this home, based on health outcomes and preventive care.

High-risk clinical events score Info A composite score based on pressure ulcers, falls with injury, weight loss, walking ability decline, and activities of daily living decline. 7.0
20% better than State average

State average: 8.7

Functional decline score Info A composite score based on activities of daily living decline, walking ability decline, and incontinence. 12.0
22% better than State average

State average: 15.5

Long-stay resident measures
Need for Help with Daily Activities Increased Info Percent of long-stay residents whose need for help with daily activities has increased 10.8%
18% better than State average

State average: 13.1%

Walking Ability Worsened Info Percent of long-stay residents whose ability to move independently worsened 10.1%
38% better than State average

State average: 16.2%

Low Risk Residents with Bowel/Bladder Incontinence Info Percent of low risk long-stay residents who lose control of their bowels or bladder 15.1%
11% better than State average

State average: 17.0%

Falls with Major Injury Info Percent of long-stay residents experiencing one or more falls with major injury 4.6%
55% worse than State average

State average: 3.0%

High Risk Residents with Pressure Ulcers Info Percent of long-stay high risk residents with pressure ulcers 2.0%
68% better than State average

State average: 6.1%

Urinary Tract Infection Info Percent of long-stay residents with a urinary tract infection 0.9%
48% better than State average

State average: 1.6%

Lost Too Much Weight Info Percent of long-stay residents who lose too much weight 7.5%
22% worse than State average

State average: 6.2%

Depressive Symptoms Info Percent of long-stay residents who have depressive symptoms 0.4%
84% better than State average

State average: 2.8%

Antipsychotic Use Info Percent of long-stay residents who received an antipsychotic medication 25.6%
76% worse than State average

State average: 14.5%

Pneumococcal Vaccine Info Percent of long-stay residents assessed and appropriately given the pneumococcal vaccine 100.0%
11% better than State average

State average: 90.5%

Influenza Vaccine Info Percent of long-stay residents assessed and appropriately given the seasonal influenza vaccine 100.0%
10% better than State average

State average: 90.6%

Short-stay resident measures
Pneumococcal Vaccine Info Percent of short-stay residents assessed and appropriately given the pneumococcal vaccine 99.4%
25% better than State average

State average: 79.5%

Antipsychotic medication increase Info Percent of short-stay residents who newly received an antipsychotic medication 3.4%
101% worse than State average

State average: 1.7%

Influenza Vaccine Info Percent of short-stay residents assessed and appropriately given the seasonal influenza vaccine 98.0%
26% better than State average

State average: 78.0%

Breakdown by payment type

Medicare

28% of new residents, usually for short-term rehab.

Typical stay 1 - 2 months

Private pay

56% of new residents, often for short stays.

Typical stay 9 - 10 months

Medicaid

16% of new residents, often for long-term daily care.

Typical stay 5 - 6 months

Facility Characteristics

Source: CMS Long-Term Care Facility Characteristics (Data as of Jan 2026)

Total residents 79
Medicare
7
8.9% of residents
Medicaid
33
41.8% of residents
Private pay or other
39
49.4% of residents
Programs & Services
Residents Group

Residents meet regularly to discuss policies, care quality, and activities

CCRC

Part of a Continuing Care Retirement Community offering multiple care levels

Active Resident Council

Organized group of residents that meets regularly to discuss facility policies, quality of life, and activities.

Finances and operations

Based on CMS SNF Cost Report for fiscal year ending in 09/2023.

Nonprofit
Nonprofit Corporation
Net patient revenue Info Net patient revenue — what the home actually collects for resident care, after contractual allowances, bad debt and discounts are subtracted from its gross charges (CMS cost report, Worksheet G-3). It covers resident care only; money the home earns from other sources is shown separately as "Other income."
$11.6M
Net patient income Info Net patient income: net patient revenue minus the home's total operating expenses. A positive figure means it earns more from resident care than it spends to deliver it; a negative figure means the opposite. It excludes non-operating "other income."
-$2.0M
Nonprofit Nonprofit Corporation
Net patient revenue Info Net patient revenue — what the home actually collects for resident care, after contractual allowances, bad debt and discounts are subtracted from its gross charges (CMS cost report, Worksheet G-3). It covers resident care only; money the home earns from other sources is shown separately as "Other income."
$11.6M Rank #66 / 125Revenue — State benchmarkedThis home is ranked 66th out of 125 homes in South Carolina. Shows this facility's annual revenue compared to the South Carolina average. Higher revenue generally means more resources for staffing and capital — read alongside Payroll %.Rankings are based only on facilities in South Carolina that report data for that category. Facilities without available data are excluded from the ranking.Click the rank badge to see the full State ranking.Click here to see the full State ranking.
Net patient income Info Net patient income: net patient revenue minus the home's total operating expenses. A positive figure means it earns more from resident care than it spends to deliver it; a negative figure means the opposite. It excludes non-operating "other income."
-$2.0M
Other income Info Money the home earns outside of resident care — such as investments, grants, rentals and other non-operating sources (CMS cost report, Worksheet G-3). It is tracked separately from net patient revenue: it is not part of that figure, and it is not included in net patient income.
$1.0M
Payroll costs Info Staff salaries plus wage-related costs — benefits such as payroll taxes, health insurance and retirement — from the home's own accounting records (CMS cost report, Worksheet A). Contract or agency labor is counted separately, under other operating costs. Rank #53 / 125Payroll — State benchmarkedThis home is ranked 53rd out of 125 homes in South Carolina. Shows total annual staff payroll benchmarked to the South Carolina average. Higher payroll investment relative to peers often signals better staffing and less reliance on cheaper contract labor.Rankings are based only on facilities in South Carolina that report data for that category. Facilities without available data are excluded from the ranking.Click the rank badge to see the full State ranking.Click here to see the full State ranking.
$7.2M 61.9% of net patient revenue Info Payroll as a share of revenue: staff salaries and wage-related benefits divided by net patient revenue. A higher figure means more of each revenue dollar goes to staff pay. Rank #37 / 125Payroll % — State benchmarkedThis home is ranked 37th out of 125 homes in South Carolina. Shows payroll as a percentage of revenue versus the South Carolina average. Well-run South Carolina facilities typically land around 53–64% — the top third Statewide. Below 25% may signal understaffing or heavy agency use — read with Staffing ratings.Rankings are based only on facilities in South Carolina that report data for that category. Facilities without available data are excluded from the ranking.Click the rank badge to see the full State ranking.Click here to see the full State ranking.
Other operating costs Info Everything it costs to run the home apart from payroll — food, utilities, supplies, maintenance, contract labor and administration. Calculated as total operating expense minus payroll (staff salaries and wage-related benefits).
$6.4M
Total costs Info The home's total operating expense for the year — all the costs of running it, salaries included (CMS cost report, Worksheet G-3).
$13.6M

Who this home usually serves

TYPE OF STAY

Mix of rehab and long-term care

This home supports both short-term rehab and long-term care, with residents staying for a wide range of durations.

Most new residents arrive under private pay (56% of admissions), and a typical private pay stay runs around 9 - 10 months.

Admissions
286 total

Coverage residents most often arrive under.

Medicare 28%
Private pay 56%
Medicaid 16%
Discharges
326 total

Coverage residents most often leave under.

Medicare 30%
Private pay 54%
Medicaid 16%

Places of interest near Martha Franks Baptist Retirement Community

Address 1 Martha Franks Dr, Laurens, SC 29360-1799

Calculate Travel Distance to Martha Franks Baptist Retirement Community

Add your location

Address

Frequently Asked Questions about Martha Franks Baptist Retirement Community

What neighborhood is Martha Franks Baptist Retirement Community in?

Martha Franks Baptist Retirement Community is in the USA neighborhood of LAURENS.

Who is the owner of Martha Franks Baptist Retirement Community?

Martha Franks Baptist Retirement Community is legally operated by South Carolina Baptist Ministries For The Aging Inc, and administered by Robert Sprouse.

What is the license number of Martha Franks Baptist Retirement Community?

According to SC state health department records, Martha Franks Baptist Retirement Community's license number is CRC-0360.

What is the occupancy rate at Martha Franks Baptist Retirement Community?

Martha Franks Baptist Retirement Community's occupancy is 69%.

What is the best email address for Martha Franks Baptist Retirement Community?

The team at Martha Franks Baptist Retirement Community can be reached at AP@SCBMA.COM.

Does Martha Franks Baptist Retirement Community operate as a for-profit or non-profit?

Martha Franks Baptist Retirement Community is registered as a non-profit in SC.

Who is the administrator of Martha Franks Baptist Retirement Community?

Robert Sprouse is the administrator of Martha Franks Baptist Retirement Community.

Guides for Better Senior Living

Care Cost Calculator: See Prices in Your Area

Nursing Home Data Explorer

Don’t Wait Too Long: 7 Red Flag Signs Your Parent Needs Assisted Living Now

The True Cost of Assisted Living in 2025 – And How Families Are Paying For It

Understanding Senior Living Costs: Pricing Models, Discounts & Financial Assistance