Mt. Angel Orchard House
Nursing Home & Assisted Living · Mount Angel, OR
CMS overall rating Info CMS (the Centers for Medicare & Medicaid Services) is the federal agency that rates nursing home quality. Its Overall Rating runs from 1 to 5 stars, combining health inspections, staffing, and quality measures, with inspections weighted most heavily.

Mt. Angel Orchard House

Nursing Home & Assisted Living · Mount Angel, OR
CMS overall rating Info CMS (the Centers for Medicare & Medicaid Services) is the federal agency that rates nursing home quality. Its Overall Rating runs from 1 to 5 stars, combining health inspections, staffing, and quality measures, with inspections weighted most heavily.
Calculator: See prices in your area
Mt. Angel Orchard House accepts Medicare, Medicaid, and private pay.

Overview of Mt. Angel Orchard House

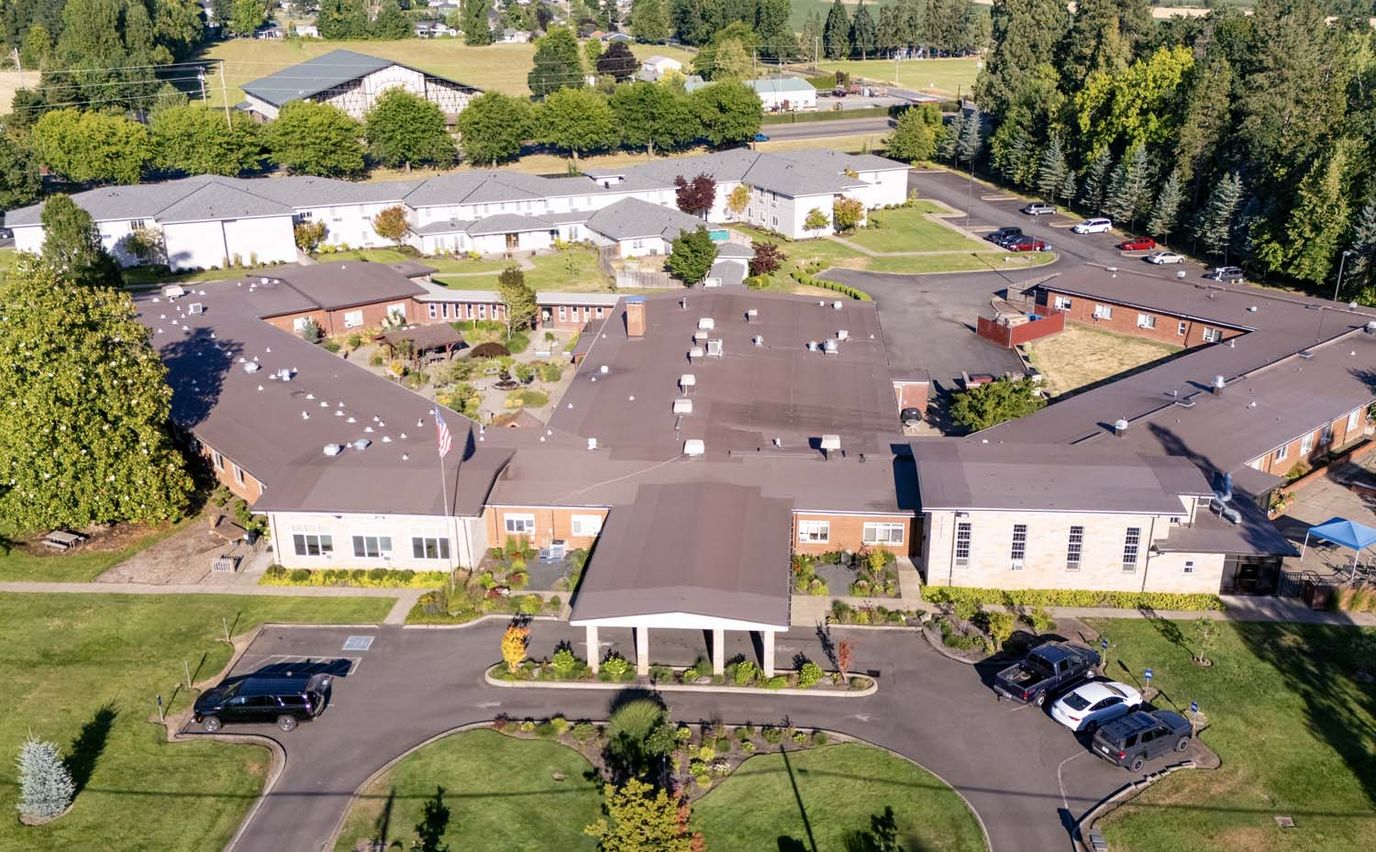
Providing long-term care and short-term rehabilitation, Mt. Angel Orchard House is a skilled nursing community in Mount Angel, Oregon, with a 54-bed capacity. Operated by Providence Health, the community has been serving older adults for 27 years. With a highly walkable setting on Main Street, it has convenient access to most daily errands. Medicare, Medicaid, and private pay are also accepted, offering a variety of payment options.

With an average stay of 24 days, the community features a staffing structure that supports individuals recovering from surgery or hospitalization and those managing ongoing health conditions with continuous care and supervision. An average of 5 hours and 16 minutes of nursing care per resident is provided each day, while nurse aides contribute an additional 4 hours and 43 minutes. Highlighting rehabilitation services, the community also provides round-the-clock care with certified caregivers.

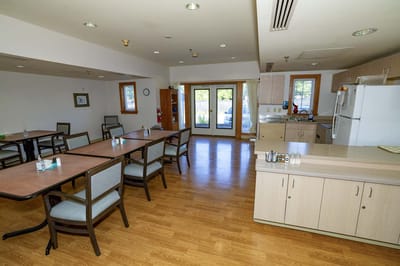
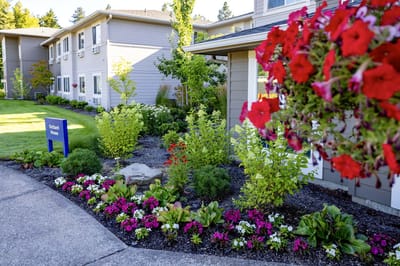
Housekeeping and personal care services are also provided to support comfort and daily living needs. Furthermore, meals with daily entrée selections and alternative menu options are served in a homestyle dining. The monthly activity schedule includes wellness programs, creative activities, spiritual gatherings, and community events. A full-service salon, landscaped gardens, a library, exercise programs, and complimentary Wi-Fi access are also available.

State inspections highlighted meal service and dining practices as areas requiring attention. Medication administration procedures and resident admission assessments were also cited on earlier inspections. However, some of these issues were addressed during the following inspections.

Quality ratings

Measured by Centers for Medicare & Medicaid Services (CMS)

Overall rating Info The Overall CMS Rating combines results from health inspections, staffing levels and quality measures. Health inspections carry the most weight. Staffing and quality scores can increase or decrease the final rating based on performance compared to state and national standards.
Health Inspection Info Based on the results of the facility's three most recent standard inspections and any complaint investigations. CMS reviews the number, scope, and severity of deficiencies, with more recent findings weighted more heavily.
Staffing Info Measures average nursing staff hours per resident per day, including Registered Nurses (RNs) and total nursing staff. Ratings are adjusted based on the level of care residents require and are compared to state and national benchmarks.
Quality Measures Info Based on clinical and physical health indicators reported to CMS, such as hospital readmissions, falls, pressure ulcers, and improvements in mobility. These measures reflect how well residents' health needs are being managed.

Staffing hours breakdown

Info Daily nursing hours per resident by staff type, reported to CMS. Higher is generally better — compare this facility to state and national averages to see where staffing stands.

Hours per resident per day — compared to state averages

Total nursing care / resident Info Total adjusted nursing hours per resident per day, combining RN, LPN, and aide time. CMS adjusts this for case-mix so facilities can be fairly compared.
5h 16m per day
Rank #37 / 97Nurse hours — State benchmarkedThis home is ranked 37th out of 97 homes in Oregon. Shows adjusted nurse hours per resident per day benchmarked to the Oregon average, with a ranking across 97 Oregon facilities. More hours mean more direct care. The national average is about 3.5 hrs; below 3.0 is a red flag.Rankings are based only on facilities in Oregon that report data for that category. Facilities without available data are excluded from the ranking.Click the rank badge to see the full State ranking.Click here to see the full State ranking.
vs avg
Staff type Hours / Day / Resident vs state avg
Registered Nurse (RN) Info RNs hold the highest nursing license and can assess residents, interpret test results, and direct care plans. More RN hours per day often signals stronger clinical oversight and faster response to health changes. 50m per day
LPN / LVN Info Licensed Practical Nurses (LPNs) or Licensed Vocational Nurses (LVNs) deliver routine hands-on care — medication administration, wound dressing, and monitoring vital signs. They work under RN supervision and make up a large share of daily bedside care. 55m per day
Nurse Aide Info Certified Nurse Aides (CNAs) provide the most direct day-to-day assistance: bathing, dressing, feeding, and mobility. Nurse aide hours are typically the largest staffing category and directly affect residents' quality of life. 3h 33m per day
Weekend Total Nursing Info Combined nursing hours (RN + LPN + Nurse Aide) per resident per day on weekends. Staffing often drops on weekends — this figure reveals whether the facility maintains adequate coverage outside of weekday hours. 4h 47m per day
Physical Therapist Info Hours per resident per day provided by licensed Physical Therapists (PTs) or PT Assistants. PT services help residents recover mobility after injury or illness and are especially important for post-acute (short-stay) rehabilitation. 15m per day
Weekend RN Info Registered nurse hours specifically on weekends. Facilities sometimes reduce RN presence on Saturdays and Sundays — a low weekend RN figure compared to weekday hours can indicate reduced clinical oversight when most administrative staff are absent. 34m per day

Capacity and availability

Avg. Length of Stay Info Average number of days residents stay at this facility, based on CMS cost report data. Shorter stays often reflect post-acute or rehab care; longer stays reflect long-term care.
24 days
Bed community size
54-bed community Rank #212 / 351Bed count — State benchmarkedThis home is ranked 212th out of 351 homes in Oregon. Shows this facility's certified or reported bed count compared to other Oregon facilities. Larger communities may offer more amenities, programs, and on-site services for residents and families.Rankings are based only on facilities in Oregon that report data for that category. Facilities without available data are excluded from the ranking.Click the rank badge to see the full State ranking.Click here to see the full State ranking.
A moderately sized community that may balance personal attention with shared amenities and social activities.
Years in operation
27 years in operation Rank #115 / 374Years in operation — State benchmarkedThis home is ranked 115th out of 374 homes in Oregon. Shows how long this facility has been in operation compared to other Oregon facilities. Longer operating histories may benefit residents, families, and staff.Rankings are based only on facilities in Oregon that report data for that category. Facilities without available data are excluded from the ranking.Click the rank badge to see the full State ranking.Click here to see the full State ranking.
A longer operating history, which may indicate experience navigating regulations and delivering ongoing care.
Walk Score
Walk Score: 72 / 100 Rank #149 / 476Walk Score — State benchmarkedThis home is ranked 149th out of 476 homes in Oregon. Shows how walkable this facility's neighborhood is compared to the average Walk Score across Oregon facilities. Higher scores benefit residents, families, and staff.Rankings are based only on facilities in Oregon that report data for that category. Facilities without available data are excluded from the ranking.Click the rank badge to see the full State ranking.Click here to see the full State ranking.
Very walkable. Most errands can be accomplished on foot, and many essentials are within a short walk.

About this community

Occupancy

Occupancy rate
100%
Rank #1 / 95Occupancy rate — State benchmarkedThis home is ranked 1st out of 95 homes in Oregon. Shows this facility's occupancy rate versus the Oregon average, with its Statewide rank out of 95. Higher occupancy signals strong local demand and financial stability.Rankings are based only on facilities in Oregon that report data for that category. Facilities without available data are excluded from the ranking.Click the rank badge to see the full State ranking.Click here to see the full State ranking.
Higher than the Oregon average: 65.7%
Occupied beds
54 / 54
Average occupied beds in Oregon homes 55 beds

License Details

Facility TypeAssisted Living Facility
StatusActive
IssuanceOctober 23, 1998
CountyMarion
License Number70M205

Ownership & Operating Entity

Mt. Angel Orchard House is administered by Melissa Kennelly.

Owner NameRex Road Healthcare LLC

Therapy & Rehabilitation

1 service
Rehabilitation Services

Staffing & Medical

2 services
Nursing Services
24-Hour Staffing

Contact Information

Additional Policies & Features

Pets Allowed

Amenities & Lifestyle

Home-Style Dining
Full-Service Salon
Landscaped Garden
Library
Exercise And Wellness Programs
24-Hour Certified Caregivers
Housekeeping And Personal Care Services
Social Programs
Complimentary Wi-Fi
ActivitiesMonthly activity calendar includes social events, wellness classes, creative workshops, and spiritual gatherings
Specific ProgramsAccommodations, Facility Features, Things To Do

Contact Mt. Angel Orchard House

Inspection History

In Oregon, the Department of Human Services, Aging and People with Disabilities performs unannounced surveys and regular inspections to ensure resident safety in all care settings.

Since 2022 · 4 years of data 5 deficiencies 3 inspections

Inspection Scorecard Info This scorecard compares key inspection, deficiency, and complaint metrics at this facility against the Oregon state average. Metrics rated ≥15% worse than average are highlighted in red; those ≥15% better are highlighted in green.

Since 2022 vs. Oregon state average
Overall vs. OR average 0 Worse No metrics in this bucket. 3 Better Metrics better than Oregon average:
• Total deficiencies (84% below)
• Deficiencies per year (83% below)
• Deficiencies per inspection (61% below)
Latest Inspection June 13, 2024

Deficiencies Info Deficiencies are formal regulatory issues recorded during state inspections.

This Facility OR Average vs. OR Avg
Total deficiencies Info Formal regulatory issues recorded by inspectors across all inspection types. 5 31 This facility has 84% fewer total deficiencies than a typical Oregon assisted living residence (5 vs. OR avg 31).↓ 84% better
Deficiencies per year Info Average deficiencies per year since 2022. 1.3 7.8 This facility has 83% fewer deficiencies per year than a typical Oregon assisted living residence (1.3 vs. OR avg 7.8).↓ 83% better
Deficiencies per inspection Info Average deficiencies per inspection. 1.7 4.4 This facility has 61% fewer deficiencies per inspection than a typical Oregon assisted living residence (1.7 vs. OR avg 4.4).↓ 61% better

Inspections Info State inspections evaluate whether the facility meets health and safety standards.

This Facility OR Average vs. OR Avg
Total inspections Info Combined count of all routine and focused inspections. Excludes complaint investigations. 3 7 This facility has had 57% fewer total inspections than the Oregon average (3 vs. OR avg 7). More inspections can mean more regulatory scrutiny rather than worse care.↓ 57% fewer

Inspection Reports Summary Info An editor-reviewed summary of the themes and findings across this facility's recent inspection reports.

  • The August 21, 2023 re-licensure survey found six deficiencies including resident move-in evaluation, medication administration, psychotropic medication, and fire and life safety issues, with some still uncorrected by October 26.
  • The June 13, 2024 kitchen inspection found the facility in substantial compliance with meal service and food sanitation rules, with only one deficiency related to resident services - meals.
  • The March 23, 2023 kitchen inspection also found one deficiency in resident services - meals despite substantial compliance with food sanitation rules.

Health Inspection History

Inspections since 2022
Total health inspections 7

State average N/A


Last Health inspection on Jun 2025

Total health citations
29 Rank #39 / 95Health citations — State benchmarkedThis home is ranked 39th out of 95 homes in Oregon. Shows this facility's total health deficiency citations benchmarked to the Oregon State average, with a ranking across all 95 OR facilities. Lower citation counts earn a better rank.Rankings are based only on facilities in Oregon that report data for that category. Facilities without available data are excluded from the ranking.Click the rank badge to see the full State ranking.Click here to see the full State ranking.

State average N/A

Citations per inspection
4.14 Rank #15 / 95Citations per inspection — State benchmarkedThis home is ranked 15th out of 95 homes in Oregon. Shows average deficiency citations per CMS inspection for this facility versus the Oregon mean across 95 facilities with citation data. Lower is better.Rankings are based only on facilities in Oregon that report data for that category. Facilities without available data are excluded from the ranking.Click the rank badge to see the full State ranking.Click here to see the full State ranking.

State average N/A


Health citations are formal notices following inspections when they fail to comply with safety and care standards.

21 of 29 citations resulted from standard inspections; 6 of 29 resulted from complaint investigations; and 2 of 29 came from combined inspections (standard and complaint).

Breakdown of citation severity (last 4 years)
Critical health citations
0
In line with State average

State average: N/A


Serious health citations
4
In line with State average

State average: N/A

0 critical citations State average: N/A

4 serious citations State average: N/A

24 moderate citations State average: N/A

1 minor citation State average: N/A
Citations history (last 4 years)
Abuse/Neglect moderate citation Jun 20, 2025
Corrected

Quality of Care moderate citation Feb 14, 2025
Corrected

Resident Rights minor citation Feb 14, 2025
Corrected

Quality of Care moderate citation Sep 19, 2024
Corrected

Staffing Data

Reporting period: October 1 – December 31, 2025 (Q4 2025). Source: CMS Payroll-Based Journal report.

Total staff 190
Employees 125
Contractors 65
Staff to resident ratio 2.57 : 1
0% compared with State average

State average ratio: 0 : 0

Avg staff/day 57
Average shift 8 hours
0% compared with State average

State average: 0 hours

Total staff hours (quarter) 41,872

Nursing staff breakdown

Q4 2025 · Oct 1 – Dec 31 More info This data comes from the CMS Payroll-Based Journal report covering October 1 – December 31, 2025.
Registered Nurse

Manages medical care and health needs.

RN Staff Info 17 total: 10 full-time employees and 7 contractors. 17
Average shift length Info Average shift length. Calculated as total hours divided by days worked and average staff per day. 9.5 hours
Licensed Practical Nurse

Assists with medical care and medications.

LPN Staff Info 34 total: 19 full-time employees and 15 contractors. 34
Average shift length Info Average shift length. Calculated as total hours divided by days worked and average staff per day. 8.6 hours
Certified Nursing Assistant

Helps with daily care and mobility.

CNA Staff Info 106 total: 63 full-time employees and 43 contractors. 106
Average shift length Info Average shift length. Calculated as total hours divided by days worked and average staff per day. 7.8 hours

Contractor staffing

Q4 2025 · Oct 1 – Dec 31 More info This data comes from the CMS Payroll-Based Journal report covering October 1 – December 31, 2025.

Total hours from contractors

7.4%

3,109 contractor hours this quarter

Certified Nursing Assistant: 43 Licensed Practical Nurse: 15 Registered Nurse: 7

Staff by category

Q4 2025 · Oct 1 – Dec 31 More info This data comes from the CMS Payroll-Based Journal report covering October 1 – December 31, 2025.
Certified Nursing Assistant 63 43 106 22,055 92 100% 7.8
Licensed Practical Nurse 19 15 34 6,071 92 100% 8.6
Registered Nurse 10 7 17 4,592 92 100% 9.5
Dental Services Staff 4 0 4 1,676 65 71% 8
Respiratory Therapy Technician 6 0 6 1,643 78 85% 7.2
Medication Aide/Technician 6 0 6 1,437 92 100% 7.4
Physical Therapy Assistant 5 0 5 847 68 74% 7
Qualified Social Worker 3 0 3 665 64 70% 6.2
Administrator 1 0 1 528 66 72% 8
Clinical Nurse Specialist 2 0 2 493 53 58% 8.8
Nurse Practitioner 1 0 1 480 60 65% 8
Dietitian 1 0 1 476 60 65% 7.9
Other Dietary Services Staff 1 0 1 415 54 59% 7.7
Therapeutic Recreation Specialist 1 0 1 387 43 47% 9
Physical Therapy Aide 1 0 1 99 20 22% 4.9
RN Director of Nursing 1 0 1 9 1 1% 9
106 Certified Nursing Assistant
% of Days 100%
34 Licensed Practical Nurse
% of Days 100%
17 Registered Nurse
% of Days 100%
4 Dental Services Staff
% of Days 71%
6 Respiratory Therapy Technician
% of Days 85%
6 Medication Aide/Technician
% of Days 100%
5 Physical Therapy Assistant
% of Days 74%
3 Qualified Social Worker
% of Days 70%
1 Administrator
% of Days 72%
2 Clinical Nurse Specialist
% of Days 58%
1 Nurse Practitioner
% of Days 65%
1 Dietitian
% of Days 65%
1 Other Dietary Services Staff
% of Days 59%
1 Therapeutic Recreation Specialist
% of Days 47%
1 Physical Therapy Aide
% of Days 22%
1 RN Director of Nursing
% of Days 1%

Penalties and fines

Includes penalties issued in 2024

Federal penalties imposed by CMS for regulatory violations, including civil money penalties (fines) and denials of payment for new Medicare/Medicaid admissions.

Source: CMS Penalties Database (Data as of Jan 2026)

Total fines amount $28K Rank #67 / 98Federal fines — State benchmarkedThis home is ranked 67th out of 98 homes in Oregon. Shows this facility's cumulative CMS federal fine dollars versus the Oregon average among facilities with fines, and where it ranks among 98 facilities in the pool. Lower total dollars mean a better rank.Rankings are based only on facilities in Oregon that report data for that category. Facilities without available data are excluded from the ranking.Click the rank badge to see the full State ranking.Click here to see the full State ranking.
53% lower than State average

State average: $60K

Number of fines 2
18% more fines than State average

State average: 1.7

Payment Denials Info Serious action where Medicare and/or Medicaid temporarily stops payments for new residents until issues are fixed. 0
100% fewer payment denials than State average

State average: 0.1

Fines amount comparison
This facility $28K
State average $60K
Penalty History

Penalties are imposed by CMS for violations of federal nursing home regulations.

2 penalties in the past 3 years

Multiple penalties were reported in the last 3 years.

Civil Money Penalty Info Fines imposed for noncompliance, which can be assessed per day or per instance of violation. Sep 19, 2024
$10K
Civil Money Penalty Info Fines imposed for noncompliance, which can be assessed per day or per instance of violation. Mar 22, 2024
$18K

Last updated: Jan 2026

Quality of care over time

These measures show how residents usually do over time at this home, based on health outcomes and preventive care.

High-risk clinical events score Info A composite score based on pressure ulcers, falls with injury, weight loss, walking ability decline, and activities of daily living decline. 12.0
14% worse than State average

State average: 10.5

Functional decline score Info A composite score based on activities of daily living decline, walking ability decline, and incontinence. 24.8
18% worse than State average

State average: 21.1

Long-stay resident measures
Need for Help with Daily Activities Increased Info Percent of long-stay residents whose need for help with daily activities has increased 22.5%
38% worse than State average

State average: 16.3%

Walking Ability Worsened Info Percent of long-stay residents whose ability to move independently worsened 24.1%
In line with State average

State average: 24.9%

Low Risk Residents with Bowel/Bladder Incontinence Info Percent of low risk long-stay residents who lose control of their bowels or bladder 27.8%
23% worse than State average

State average: 22.6%

Falls with Major Injury Info Percent of long-stay residents experiencing one or more falls with major injury 0.0%
100% better than State average

State average: 2.4%

High Risk Residents with Pressure Ulcers Info Percent of long-stay high risk residents with pressure ulcers 8.5%
22% worse than State average

State average: 6.9%

Urinary Tract Infection Info Percent of long-stay residents with a urinary tract infection 4.3%
107% worse than State average

State average: 2.1%

Lost Too Much Weight Info Percent of long-stay residents who lose too much weight 5.0%
5% better than State average

State average: 5.3%

Depressive Symptoms Info Percent of long-stay residents who have depressive symptoms 17.2%
272% worse than State average

State average: 4.6%

Antipsychotic Use Info Percent of long-stay residents who received an antipsychotic medication 25.0%
89% worse than State average

State average: 13.2%

Pneumococcal Vaccine Info Percent of long-stay residents assessed and appropriately given the pneumococcal vaccine 73.1%
24% worse than State average

State average: 95.7%

Influenza Vaccine Info Percent of long-stay residents assessed and appropriately given the seasonal influenza vaccine 90.3%
5% worse than State average

State average: 95.2%

Short-stay resident measures
Pneumococcal Vaccine Info Percent of short-stay residents assessed and appropriately given the pneumococcal vaccine 46.1%
47% worse than State average

State average: 86.2%

Antipsychotic medication increase Info Percent of short-stay residents who newly received an antipsychotic medication 0.9%
53% better than State average

State average: 1.8%

Influenza Vaccine Info Percent of short-stay residents assessed and appropriately given the seasonal influenza vaccine 72.4%
11% worse than State average

State average: 81.2%

Breakdown by payment type

Medicare

23% of new residents, usually for short-term rehab.

Typical stay 3 - 4 months

Private pay

66% of new residents, often for short stays.

Typical stay 7 - 8 months

Medicaid

11% of new residents, often for long-term daily care.

Typical stay 1 - 2 years

Facility Characteristics

Source: CMS Long-Term Care Facility Characteristics (Data as of Jan 2026)

Total residents 74
Medicare
7
9.5% of residents
Medicaid
49
66.2% of residents
Private pay or other
18
24.3% of residents
Programs & Services
Residents Group

Residents meet regularly to discuss policies, care quality, and activities

Active Resident Council

Organized group of residents that meets regularly to discuss facility policies, quality of life, and activities.

Finances and operations

Based on CMS SNF Cost Report for fiscal year ending in 12/2023.

Nonprofit
Nonprofit Corporation
Net patient revenue Info Net patient revenue — what the home actually collects for resident care, after contractual allowances, bad debt and discounts are subtracted from its gross charges (CMS cost report, Worksheet G-3). It covers resident care only; money the home earns from other sources is shown separately as "Other income."
$28.1M
Net patient income Info Net patient income: net patient revenue minus the home's total operating expenses. A positive figure means it earns more from resident care than it spends to deliver it; a negative figure means the opposite. It excludes non-operating "other income."
-$3.7M
Nonprofit Nonprofit Corporation
Net patient revenue Info Net patient revenue — what the home actually collects for resident care, after contractual allowances, bad debt and discounts are subtracted from its gross charges (CMS cost report, Worksheet G-3). It covers resident care only; money the home earns from other sources is shown separately as "Other income."
$28.1M Rank #2 / 93Revenue — State benchmarkedThis home is ranked 2nd out of 93 homes in Oregon. Shows this facility's annual revenue compared to the Oregon average. Higher revenue generally means more resources for staffing and capital — read alongside Payroll %.Rankings are based only on facilities in Oregon that report data for that category. Facilities without available data are excluded from the ranking.Click the rank badge to see the full State ranking.Click here to see the full State ranking.
Net patient income Info Net patient income: net patient revenue minus the home's total operating expenses. A positive figure means it earns more from resident care than it spends to deliver it; a negative figure means the opposite. It excludes non-operating "other income."
-$3.7M
Other income Info Money the home earns outside of resident care — such as investments, grants, rentals and other non-operating sources (CMS cost report, Worksheet G-3). It is tracked separately from net patient revenue: it is not part of that figure, and it is not included in net patient income.
$926.6K
Payroll costs Info Staff salaries plus wage-related costs — benefits such as payroll taxes, health insurance and retirement — from the home's own accounting records (CMS cost report, Worksheet A). Contract or agency labor is counted separately, under other operating costs. Rank #2 / 93Payroll — State benchmarkedThis home is ranked 2nd out of 93 homes in Oregon. Shows total annual staff payroll benchmarked to the Oregon average. Higher payroll investment relative to peers often signals better staffing and less reliance on cheaper contract labor.Rankings are based only on facilities in Oregon that report data for that category. Facilities without available data are excluded from the ranking.Click the rank badge to see the full State ranking.Click here to see the full State ranking.
$17.7M 63% of net patient revenue Info Payroll as a share of revenue: staff salaries and wage-related benefits divided by net patient revenue. A higher figure means more of each revenue dollar goes to staff pay. Rank #18 / 93Payroll % — State benchmarkedThis home is ranked 18th out of 93 homes in Oregon. Shows payroll as a percentage of revenue versus the Oregon average. Well-run Oregon facilities typically land around 51–62% — the top third Statewide. Below 25% may signal understaffing or heavy agency use — read with Staffing ratings.Rankings are based only on facilities in Oregon that report data for that category. Facilities without available data are excluded from the ranking.Click the rank badge to see the full State ranking.Click here to see the full State ranking.
Other operating costs Info Everything it costs to run the home apart from payroll — food, utilities, supplies, maintenance, contract labor and administration. Calculated as total operating expense minus payroll (staff salaries and wage-related benefits).
$14.1M
Total costs Info The home's total operating expense for the year — all the costs of running it, salaries included (CMS cost report, Worksheet G-3).
$31.8M

Who this home usually serves

TYPE OF STAY

Primarily short stays

Residents typically stay for brief periods, with frequent admissions and discharges throughout the year.

Most new residents arrive under private pay (66% of admissions), and a typical private pay stay runs around 7 - 8 months.

Admissions
283 total

Coverage residents most often arrive under.

Medicare 23%
Private pay 66%
Medicaid 11%
Discharges
345 total

Coverage residents most often leave under.

Medicare 14%
Private pay 61%
Medicaid 25%

Places of interest near Mt. Angel Orchard House

Address 0.0 miles from city center Info Estimated distance in miles from Mount Angel's city center to Mt. Angel Orchard House's address, calculated via Google Maps.

Calculate Travel Distance to Mt. Angel Orchard House

Add your location

Address

Compare Nursing Homes around the area

The information below is reported by the Oregon Department of Human Services, Aging and People with Disabilities.

Mirabella Portland
NH
AL
MC
SNF
Portland (Southwest Portland) - 27 A+ 81 1 Bed / 2 Bed
Marquis Autumn Hills
NH
AL
MC
Portland (Raleigh Hills) - 39 - 70 Private Rooms
Mt. Angel Orchard House
NH
AL
Mount Angel - 54 - 72 -

Frequently Asked Questions about Mt. Angel Orchard House

Who is the owner of Mt. Angel Orchard House?

Mt. Angel Orchard House is legally operated by Rex Road Healthcare LLC, and administered by Melissa Kennelly.

Is Mt. Angel Orchard House in a walkable area?

Mt. Angel Orchard House has a walk score of 72. Very walkable. Most errands can be accomplished on foot, and many essentials are within a short walk.

What is the license number of Mt. Angel Orchard House?

According to OR state health department records, Mt. Angel Orchard House's license number is 70M205.

What is the occupancy rate at Mt. Angel Orchard House?

Mt. Angel Orchard House's occupancy is 100%.

What is the best email address for Mt. Angel Orchard House?

The team at Mt. Angel Orchard House can be reached at mkennelly@ensignservices.net.

Does Mt. Angel Orchard House operate as a for-profit or non-profit?

Mt. Angel Orchard House is registered as a non-profit in OR.

Who is the administrator of Mt. Angel Orchard House?

Melissa Kennelly is the administrator of Mt. Angel Orchard House.

Guides for Better Senior Living

Care Cost Calculator: See Prices in Your Area

Nursing Home Data Explorer

Don’t Wait Too Long: 7 Red Flag Signs Your Parent Needs Assisted Living Now

The True Cost of Assisted Living in 2025 – And How Families Are Paying For It

Understanding Senior Living Costs: Pricing Models, Discounts & Financial Assistance