Explore Open Rooms

1 Contact details
2 What type of senior care service are you looking for?
3 What budget do you have in mind for senior care?
4 How soon do you need to find care?
5 Additional details

Thank you for your interest!

Our team will be in touch shortly to help with next steps.

Assisted Living Home

Myrtle Beach Manor

Assisted Living Home

Myrtle Beach Manor

9547 N Kings Hwy, Myrtle Beach, SC 29572 View map
Overview of Myrtle Beach Manor

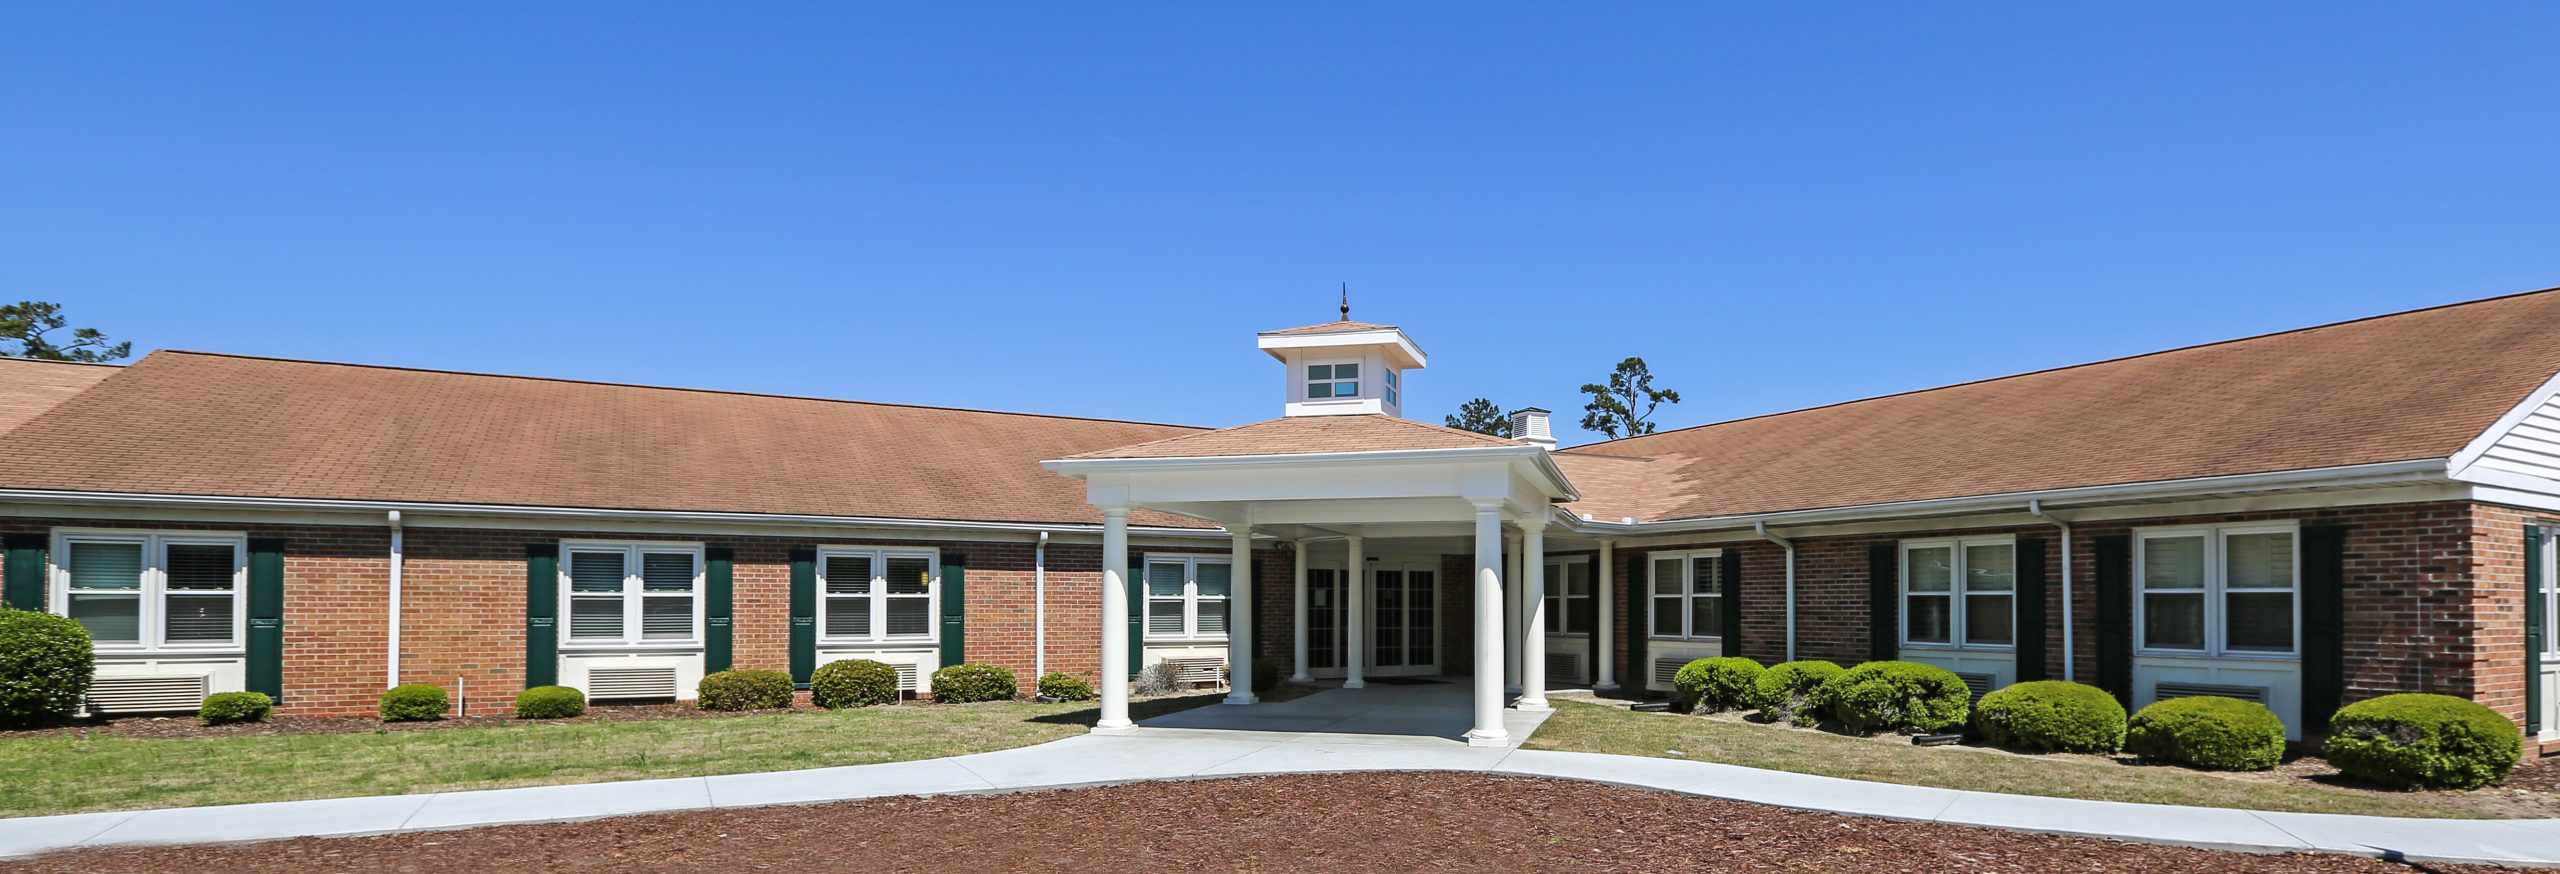
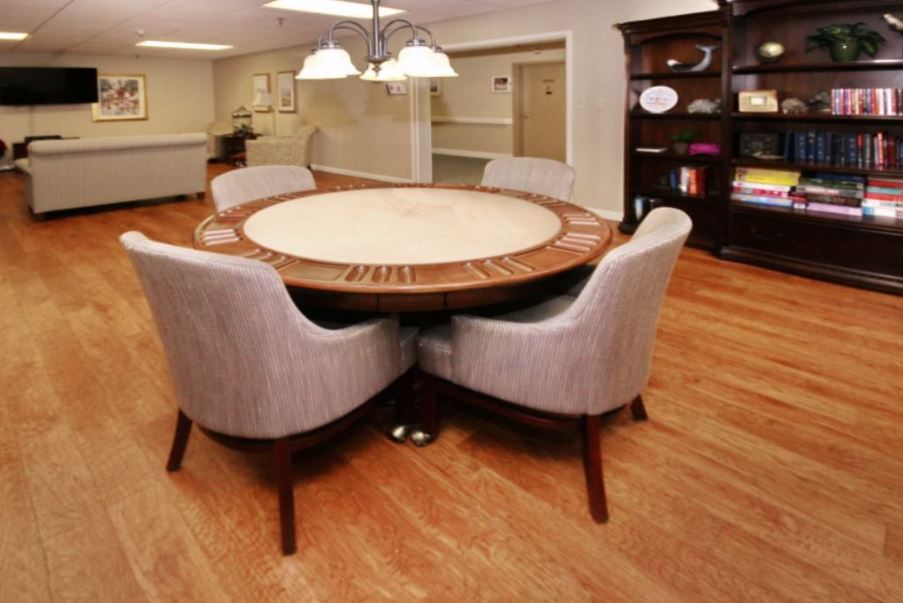
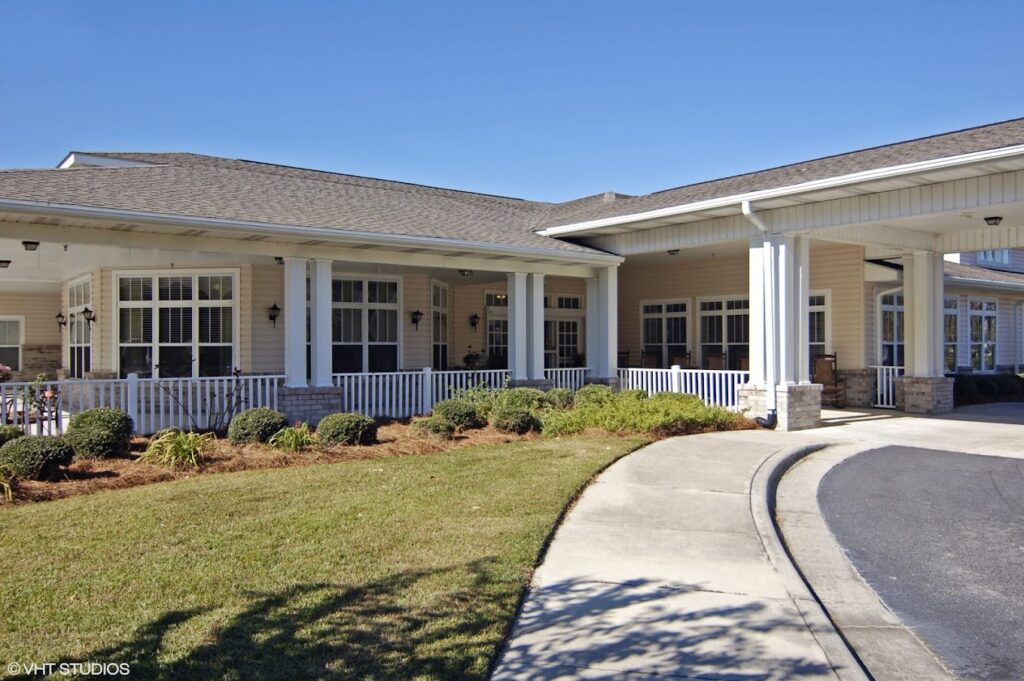
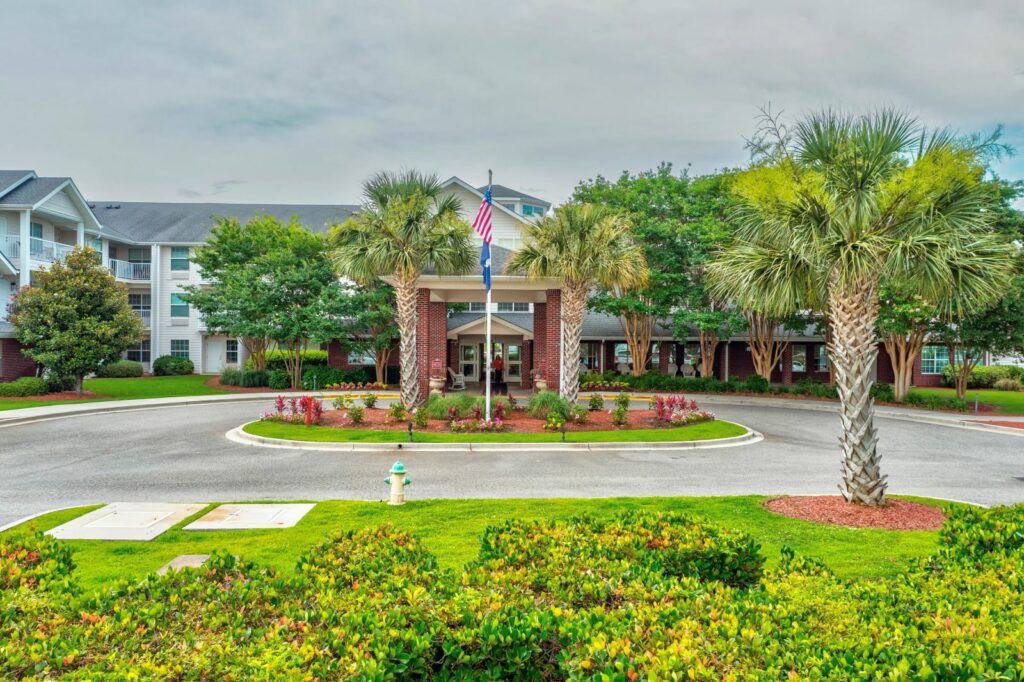
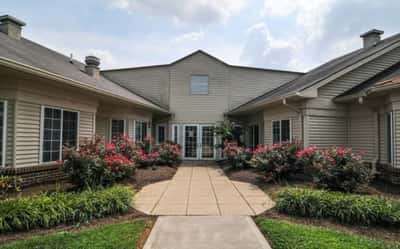
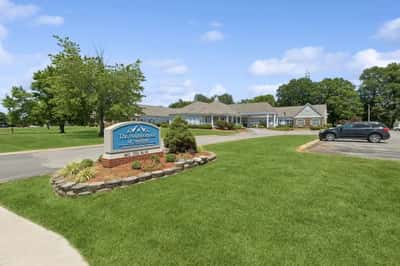
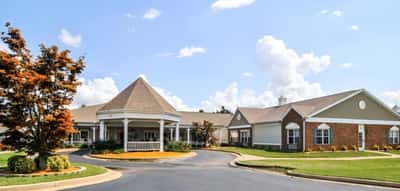
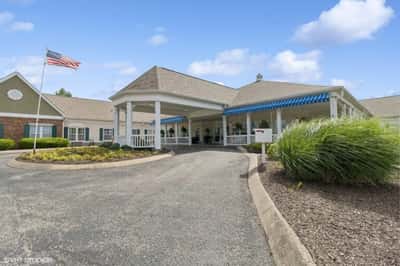
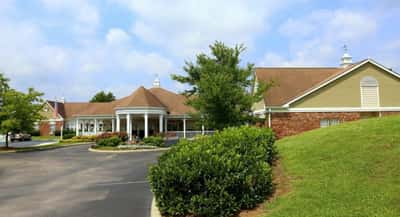
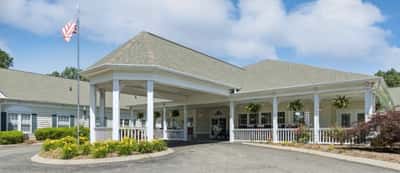
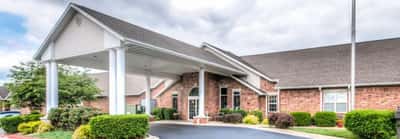
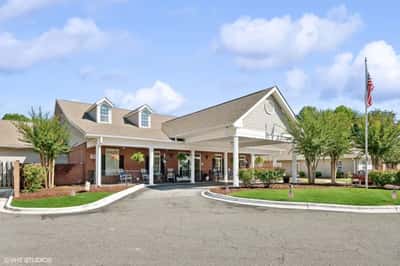
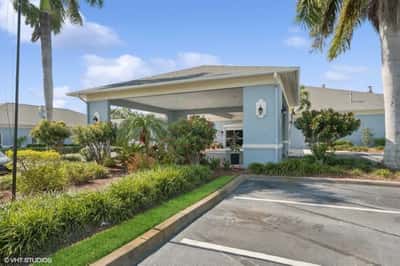
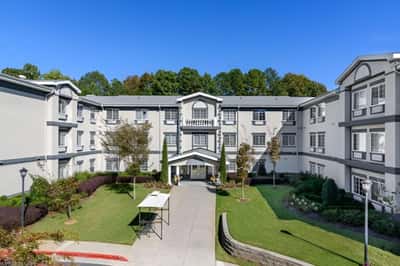
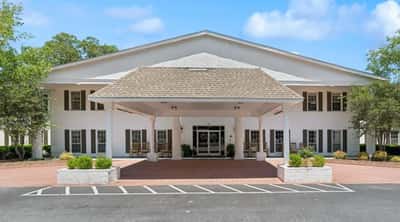
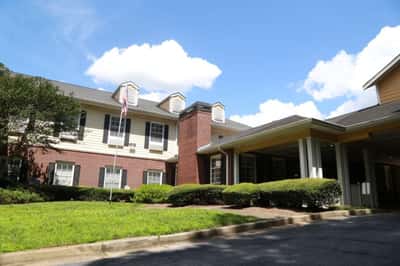
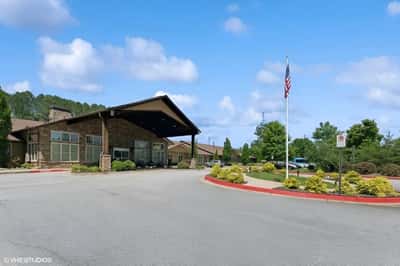
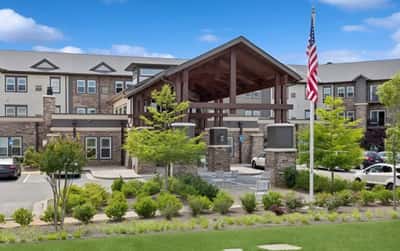
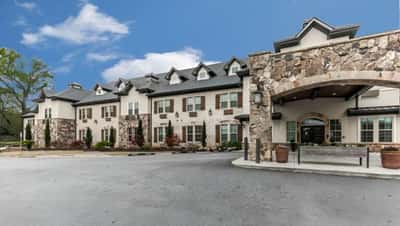
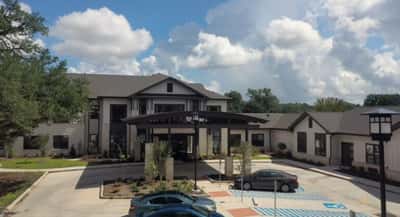
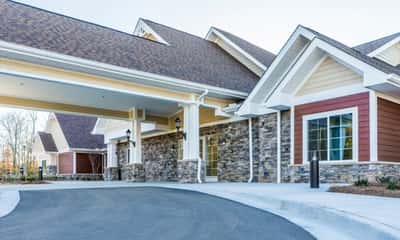
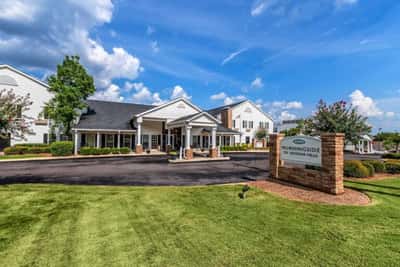
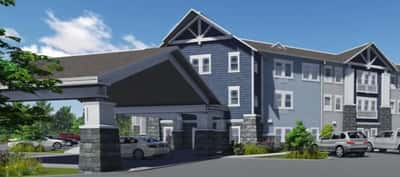
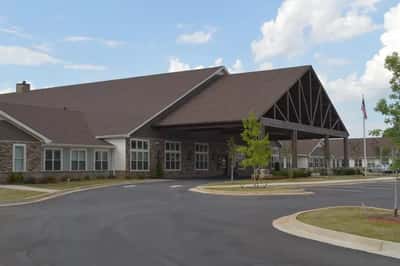
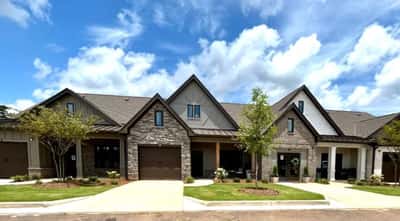
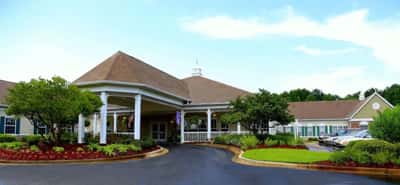
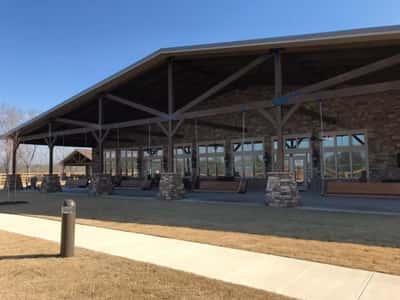
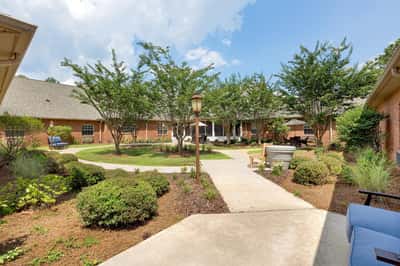
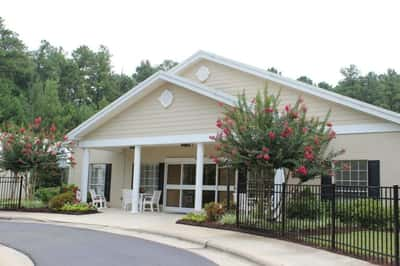
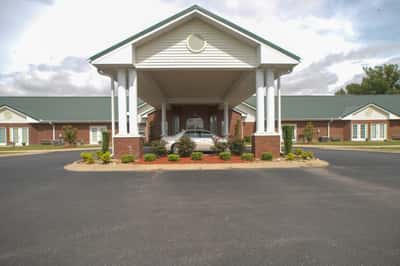
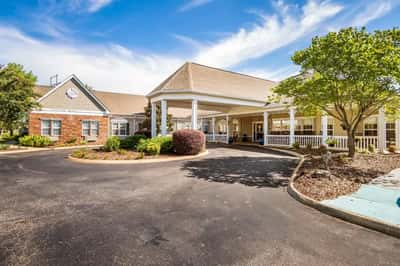
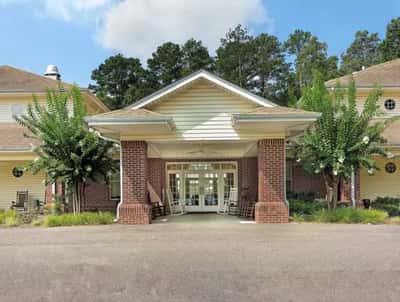
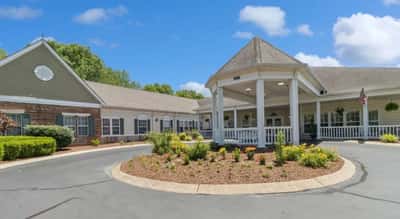
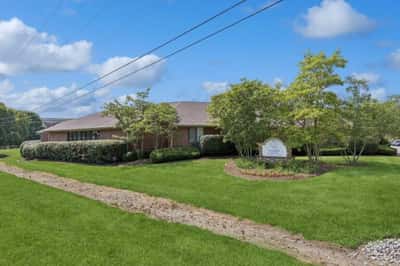
Located in the peaceful community of North Myrtle Beach Manor, the Myrtle Beach Manor is a vibrant senior living community that provides assisted living, memory care, and respite care services. A variety of luxurious accommodations are available ranging from one-bedroom to studio and studio with kitchenette. With its trained and compassionate team, residents can receive personalized care based on their needs. As for its memory care services, the Signature Memory Care Neighborhood is created to give a peaceful and secured community for its residents.

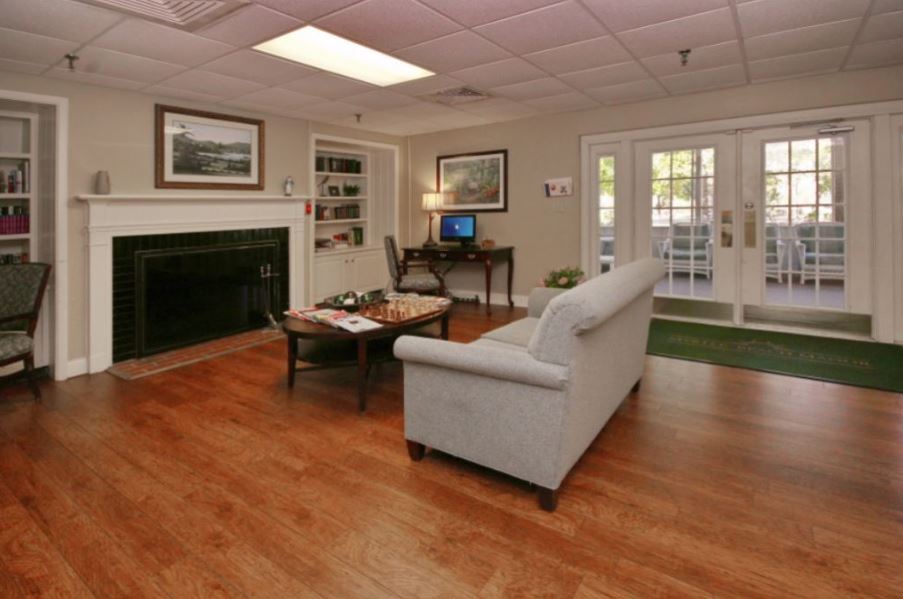
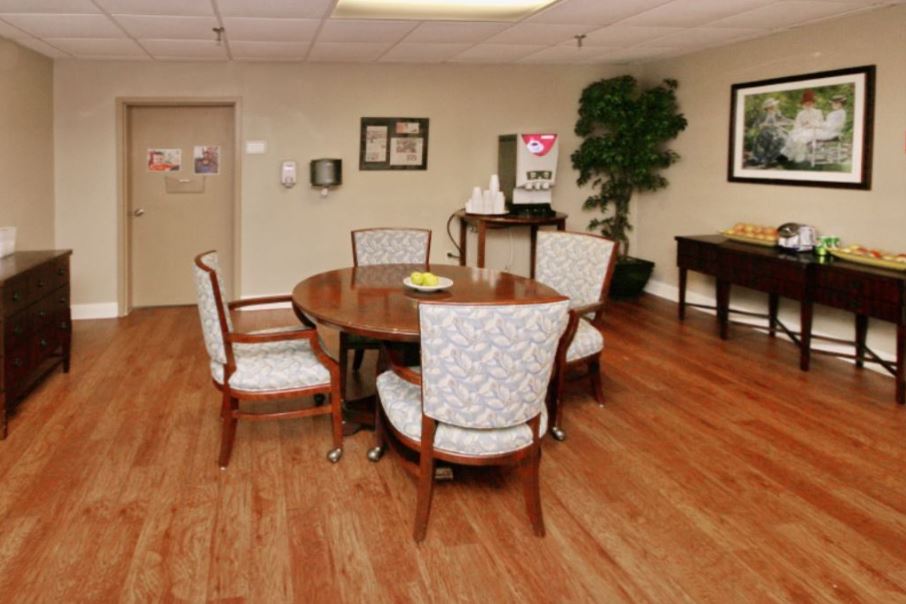
With its top-tier amenities and services, residents can enjoy a full-service salon, an arts and crafts studio, a bistro, activity rooms, a main and private dining room, warm and cozy fireside seating, and many more. True to its dedication to promoting a holistic approach to care and support, seniors are guaranteed a promising retirement.

(843) 429-8465

Quality ratings

Measured by Centers for Medicare & Medicaid Services (CMS)

Overall rating Info The Overall CMS Rating combines results from health inspections, staffing levels and quality measures. Health inspections carry the most weight. Staffing and quality scores can increase or decrease the final rating based on performance compared to state and national standards.
1/5
South Carolina average: 2.9/5
Health Inspection Info Based on the results of the facility's three most recent standard inspections and any complaint investigations. CMS reviews the number, scope, and severity of deficiencies, with more recent findings weighted more heavily.
1/5
South Carolina average: 2.7/5
Staffing Info Measures average nursing staff hours per resident per day, including Registered Nurses (RNs) and total nursing staff. Ratings are adjusted based on the level of care residents require and are compared to state and national benchmarks.
3/5
South Carolina average: 3.0/5
Quality Measures Info Based on clinical and physical health indicators reported to CMS, such as hospital readmissions, falls, pressure ulcers, and improvements in mobility. These measures reflect how well residents' health needs are being managed.
3/5
South Carolina average: 3.5/5

Nursing care per resident

Info This shows how many total hours of nursing staff time are available per resident each day. Higher numbers usually mean more staff support.
4h 20m per day

This home provides 6% more nursing time per resident than the South Carolina average.

South Carolina average: 4h 5m per day

Capacity and availability

Medium-capacity home

Offers a balance of services and community atmosphere.

Total beds 111

This home usually has availability

Lower occupancy suggests more openings may be available.

Lower demand than the South Carolina average
Occupancy rate 44%
Residents per day (avg) 37
Occupancy rate
44%
Residents per day (avg)
37

Who this home usually serves

TYPE OF STAY

Mix of rehab and long-term care

This home supports both short-term rehab and long-term care, with residents staying for a wide range of durations.

Breakdown by payment type

Medicare

45% of new residents, usually for short-term rehab.

Typical stay 17 days

Private pay

55% of new residents, often for short stays.

Typical stay 3 - 4 months

Finances and operations

Privately-owned community
Operated by a business corporation.
Home revenue
$7.4M
Operating loss
-$1.2M
Privately-owned community Operated by a business corporation.
Home revenue
$7,368,865.00
Operating loss
$-1,200,659.00
Payroll costs Info The portion of the home's budget spent on staff, including nurses, caregivers, and other employees who support care and operations.
$4.0M
54.9% of revenue
Other operating costs Info All remaining costs needed to run the home, such as food, utilities, building maintenance, supplies and administrative expenses.
$4.5M
Total costs $8.6M
Bed community size
111-bed community
A larger shared setting that may offer more common spaces and organized community services.
Walk Score
Walk Score: 41 / 100
Somewhat walkable. A few nearby services may be reachable on foot, but most trips require transportation.

About this community

Occupancy

Occupancy rate
44%
In line with South Carolina average
Occupied beds
49 / 111
Average residents 90 per day

License details

Facility type
Community Residential Care Facilities
Expiration January 31, 2026
County: Horry

Additional licensing details

License number: CRC-2123
CMS Certification Number: 425070

Ownership & operating entity

Myrtle Beach Manor is legally operated by SNH SC TENANT LLC, and administrated by SCHMEIZL, ELIZABETH.

Ownership type: Limited Liability

Care Services

Offers Alzheimer's Care
Dedicated Alzheimer's Unit

Contact Information

What does this home offer?

Housing options icon

Housing Options: Studio / 1 Bed

Building type icon
Building type icon

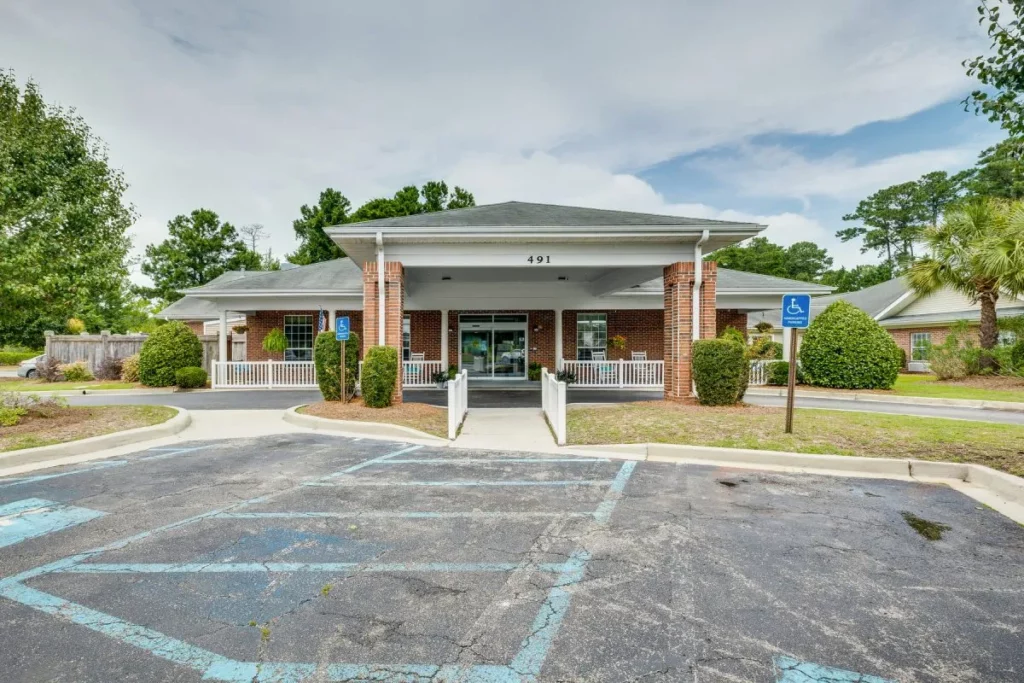
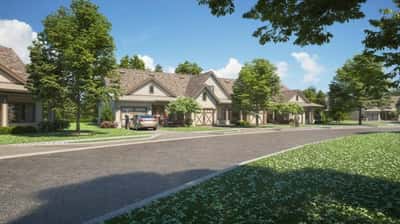
Building Type: Single-story

Transportation services icon

Transportation Services

Fitness and recreation icon

Fitness and Recreation

Types of Care at Myrtle Beach Manor

Assisted Living Memory Care Respite Care Skilled Nursing

Type of Rooms Available

Studio
Studio
1
1 Bed
1 Bed
1 / 4
1 Bed
1
Contact Myrtle Beach Manor

Health Inspection History

Inspections
Total health inspections 6

South Carolina average 3.9


Last Health inspection on Jul 2025

Total health citations 17

South Carolina average 13.7

Citations per inspection
2.83

South Carolina average 3.44


Health citations are formal notices following inspections when they fail to comply with safety and care standards.

13 of 17 citations resulted from standard inspections; and 4 of 17 resulted from complaint investigations.

Breakdown of citation severity (last 3 years)
Critical Health citations More info 1
In line with South Carolina average

South Carolina average: 1


Serious Health citations More info 2
567% worse than South Carolina average

South Carolina average: 0.3

1 critical citation More info South Carolina average: 1

2 serious citations More info South Carolina average: 0.3

14 moderate citations More info South Carolina average: 12.3

0 minor citations More info South Carolina average: 0.1
Citations history (last 3 years)
Pharmacy critical citation Info Issues related to medication management, including how drugs are stored, administered, and monitored. Jul 30, 2025

Nutrition moderate citation Info Issues related to food quality, meal service, and resident's nutritional needs. Aug 29, 2024
Corrected

Resident Rights moderate citation Info Issues related to resident's rights, including dignity, privacy, and the ability to make decisions about their care. Aug 29, 2024
Corrected

Resident Rights moderate citation Info Issues related to resident's rights, including dignity, privacy, and the ability to make decisions about their care. Aug 29, 2024
Corrected

Compare Assisted Living around Myrtle Beach The information below is reported by the South Carolina Department of Public Health, Bureau of Healthcare Quality.

Myrtle Beach Manor
NH

Nursing Home Licensed facility providing 24/7 skilled nursing care for residents with complex, ongoing medical needs. Staffed by RNs, LPNs, and CNAs. Inspected and star-rated annually by CMS. Accepts Medicare (short-term rehab) and Medicaid (long-term care).

AL

Assisted Living A licensed, long-term care setting for seniors or individuals with disabilities who need help with daily activities — like bathing, dressing, and medication management — but not 24-hour skilled nursing. Offers housing, meals, and around-the-clock support while aiming to maximize resident independence.

MC

Memory Care Secured, specialized care for people living with Alzheimer's or dementia. Staff trained in cognitive impairment, with higher staff-to-resident ratios and an environment designed to reduce confusion and wandering risk.

RC

Respite Care Short-term temporary care — days to weeks — to give family caregivers a break. Full care provided during the stay. Often used after hospitalization or to trial a facility before a permanent placement decision.

Myrtle Beach
171
No
41
Studio / 1 Bed
Myrtle Beach Grove Senior Living
AL

Assisted Living A licensed, long-term care setting for seniors or individuals with disabilities who need help with daily activities — like bathing, dressing, and medication management — but not 24-hour skilled nursing. Offers housing, meals, and around-the-clock support while aiming to maximize resident independence.

MC

Memory Care Secured, specialized care for people living with Alzheimer's or dementia. Staff trained in cognitive impairment, with higher staff-to-resident ratios and an environment designed to reduce confusion and wandering risk.

RC

Respite Care Short-term temporary care — days to weeks — to give family caregivers a break. Full care provided during the stay. Often used after hospitalization or to trial a facility before a permanent placement decision.

Myrtle Beach
142
No
22
Studio / 1 Bed
Portside at Grande Dunes
AL

Assisted Living A licensed, long-term care setting for seniors or individuals with disabilities who need help with daily activities — like bathing, dressing, and medication management — but not 24-hour skilled nursing. Offers housing, meals, and around-the-clock support while aiming to maximize resident independence.

IL

Independent Living Lifestyle-focused communities for older adults offering dining, activities, and transportation with minimal personal care. Best for active, independent seniors who want community without medical support.

MC

Memory Care Secured, specialized care for people living with Alzheimer's or dementia. Staff trained in cognitive impairment, with higher staff-to-resident ratios and an environment designed to reduce confusion and wandering risk.

Myrtle Beach
120
Yes
36
Studio / 1 Bed
The Legacy of North Myrtle Beach
AL

Assisted Living A licensed, long-term care setting for seniors or individuals with disabilities who need help with daily activities — like bathing, dressing, and medication management — but not 24-hour skilled nursing. Offers housing, meals, and around-the-clock support while aiming to maximize resident independence.

MC

Memory Care Secured, specialized care for people living with Alzheimer's or dementia. Staff trained in cognitive impairment, with higher staff-to-resident ratios and an environment designed to reduce confusion and wandering risk.

Little River
80
No
33
Studio / 1 Bed
TerraBella Myrtle Beach
AL

Assisted Living A licensed, long-term care setting for seniors or individuals with disabilities who need help with daily activities — like bathing, dressing, and medication management — but not 24-hour skilled nursing. Offers housing, meals, and around-the-clock support while aiming to maximize resident independence.

IL

Independent Living Lifestyle-focused communities for older adults offering dining, activities, and transportation with minimal personal care. Best for active, independent seniors who want community without medical support.

MC

Memory Care Secured, specialized care for people living with Alzheimer's or dementia. Staff trained in cognitive impairment, with higher staff-to-resident ratios and an environment designed to reduce confusion and wandering risk.

NH

Nursing Home Licensed facility providing 24/7 skilled nursing care for residents with complex, ongoing medical needs. Staffed by RNs, LPNs, and CNAs. Inspected and star-rated annually by CMS. Accepts Medicare (short-term rehab) and Medicaid (long-term care).

Myrtle Beach
-
Yes
52
Studio / 1 Bed / 2 Bed

Places of interest near Myrtle Beach Manor

Address 7.4 miles from city center

Address 9547 N Kings Hwy, Myrtle Beach, SC 29572

Calculate Travel Distance to Myrtle Beach Manor

Add your location

Address

Staffing Data (Q2 2025)

This data corresponds to Q2 2025 and is based on CMS Payroll-Based Journal.

Total staff 102
Employees 64
Contractors 38
Staff to resident ratio 3.78:1
110% better than South Carolina average

South Carolina average ratio: 1.80:1

Avg staff/day 28
Average shift 7.8 hours
0% compared with South Carolina average

South Carolina average: 7.9 hours

Total staff hours (quarter) 19,777
Nursing staff breakdown
Registered Nurse

Manages medical care and health needs.

Total count 15
Average shift length Info Average shift length. Calculated as total hours divided by days worked and average staff per day. 8.9 hours

This role is partially covered by contractors.

Licensed Practical Nurse

Assists with medical care and medications.

Total count 17
Average shift length Info Average shift length. Calculated as total hours divided by days worked and average staff per day. 8.8 hours

This role is partially covered by contractors.

Certified Nursing Assistant

Helps with daily care and mobility.

Total count 40
Average shift length Info Average shift length. Calculated as total hours divided by days worked and average staff per day. 9.2 hours

This role is partially covered by contractors.

Contractor staffing

Total hours from contractors

18.1%

3,584 contractor hours this quarter

Certified Nursing Assistant: 8 Registered Nurse: 5 Licensed Practical Nurse: 5 Speech Language Pathologist: 4 Feeding Assistant: 3 Respiratory Therapy Technician: 3 Qualified Social Worker: 2 Physical Therapy Assistant: 2 Physical Therapy Aide: 2 Medical Director: 1 Occupational Therapy Aide: 1 Occupational Therapy Assistant: 1 Other Physician: 1
Staff by category
Certified Nursing Assistant328408,06691100%9.2
Registered Nurse105152,67491100%8.9
Licensed Practical Nurse125171,87191100%8.8
Other Dietary Services Staff5051,2768593%7.7
Speech Language Pathologist0448907987%7.1
Physical Therapy Assistant0227467178%6.7
RN Director of Nursing1016296774%9.4
Nurse Practitioner1016048695%7
Dietitian1015596470%8.7
Physical Therapy Aide0224736167%7.2
Administrator1014645864%8
Mental Health Service Worker1014645864%8
Feeding Assistant0333766673%4
Respiratory Therapy Technician0332206470%3.2
Qualified Social Worker0222136066%3.6
Occupational Therapy Aide0111594752%3.4
Medical Director011463943%1.2
Other Physician011261314%2
Occupational Therapy Assistant0112278%3.1
40 Certified Nursing Assistant
% of Days 100%
15 Registered Nurse
% of Days 100%
17 Licensed Practical Nurse
% of Days 100%
5 Other Dietary Services Staff
% of Days 93%
4 Speech Language Pathologist
% of Days 87%
2 Physical Therapy Assistant
% of Days 78%
1 RN Director of Nursing
% of Days 74%
1 Nurse Practitioner
% of Days 95%
1 Dietitian
% of Days 70%
2 Physical Therapy Aide
% of Days 67%
1 Administrator
% of Days 64%
1 Mental Health Service Worker
% of Days 64%
3 Feeding Assistant
% of Days 73%
3 Respiratory Therapy Technician
% of Days 70%
2 Qualified Social Worker
% of Days 66%
1 Occupational Therapy Aide
% of Days 52%
1 Medical Director
% of Days 43%
1 Other Physician
% of Days 14%
1 Occupational Therapy Assistant
% of Days 8%

Facility Characteristics

Source: CMS Long-Term Care Facility Characteristics (Data as of Jan 2026)

Total census
27 residents
Residents by payment source
Medicare
11 residents (40.7%)
Private pay or other
16 residents (59.3%)
Programs & Services
Residents' Group

Residents meet regularly to discuss policies, care quality, and activities

Active Resident Council

Organized group of residents that meets regularly to discuss facility policies, quality of life, and activities.

Quality of care over time

These measures show how residents usually do over time at this home, based on health outcomes and preventive care.

High-risk clinical events score Info A composite score based on pressure ulcers, falls with injury, weight loss, walking ability decline, and activities of daily living decline. 9.6
10% worse than South Carolina average

South Carolina average: 8.7

Functional decline score Info A composite score based on activities of daily living decline, walking ability decline, and incontinence. 18.1
17% worse than South Carolina average

South Carolina average: 15.5

Long-stay resident measures
Need for Help with Daily Activities Increased Info Percent of long-stay residents whose need for help with daily activities has increased 15.0%
15% worse than South Carolina average

South Carolina average: 13.1%

Low Risk Residents with Bowel/Bladder Incontinence Info Percent of low risk long-stay residents who lose control of their bowels or bladder 21.1%
24% worse than South Carolina average

South Carolina average: 17.0%

Falls with Major Injury Info Percent of long-stay residents experiencing one or more falls with major injury 9.8%
229% worse than South Carolina average

South Carolina average: 3.0%

High Risk Residents with Pressure Ulcers Info Percent of long-stay high risk residents with pressure ulcers 4.1%
33% better than South Carolina average

South Carolina average: 6.1%

Urinary Tract Infection Info Percent of long-stay residents with a urinary tract infection 4.1%
147% worse than South Carolina average

South Carolina average: 1.6%

Depressive Symptoms Info Percent of long-stay residents who have depressive symptoms 4.4%
58% worse than South Carolina average

South Carolina average: 2.8%

Antipsychotic Use Info Percent of long-stay residents who received an antipsychotic medication 23.5%
62% worse than South Carolina average

South Carolina average: 14.5%

Pneumococcal Vaccine Info Percent of long-stay residents assessed and appropriately given the pneumococcal vaccine 94.1%
In line with South Carolina average

South Carolina average: 90.5%

Short-stay resident measures
Pneumococcal Vaccine Info Percent of short-stay residents assessed and appropriately given the pneumococcal vaccine 86.1%
8% better than South Carolina average

South Carolina average: 79.5%

Antipsychotic medication increase Info Percent of short-stay residents who newly received an antipsychotic medication 0.4%
76% better than South Carolina average

South Carolina average: 1.7%

Influenza Vaccine Info Percent of short-stay residents assessed and appropriately given the seasonal influenza vaccine 85.5%
10% better than South Carolina average

South Carolina average: 78.0%

Penalties and fines

Federal penalties imposed by CMS for regulatory violations, including civil money penalties (fines) and denials of payment for new Medicare/Medicaid admissions.

Source: CMS Penalties Database (Data as of Jan 2026)

Total fines amount $36K
7% higher than South Carolina average

South Carolina average: $34K

Number of fines 3
23% more fines than South Carolina average

South Carolina average: 2.4

Payment Denials Info Serious action where Medicare and/or Medicaid temporarily stops payments for new residents until issues are fixed. 1
761% more payment denials than South Carolina average

South Carolina average: 0.1

Fines amount comparison
This facility $36K
South Carolina average $34K
Penalty History

Penalties are imposed by CMS for violations of federal nursing home regulations.

Civil Money Penalty Info Fines imposed for noncompliance, which can be assessed per day or per instance of violation. Jul 30, 2025
$23K
Civil Money Penalty Info Fines imposed for noncompliance, which can be assessed per day or per instance of violation. Apr 9, 2024
$4K
Civil Money Penalty Info Fines imposed for noncompliance, which can be assessed per day or per instance of violation. Apr 9, 2024
$9K
Payment Denial Info Serious action where Medicare and/or Medicaid temporarily stops payments for new residents until issues are fixed. Apr 9, 2024
27 days

Last updated: Jan 2026

Guides for Better Senior Living

Care Cost Calculator: See Prices in Your Area

Nursing Home Data Explorer

Don’t Wait Too Long: 7 Red Flag Signs Your Parent Needs Assisted Living Now

The True Cost of Assisted Living in 2025 – And How Families Are Paying For It

Understanding Senior Living Costs: Pricing Models, Discounts & Financial Assistance

Financial Aid for South Carolina Seniors

Get financial aid guidance

Community Long Term Care (CLTC)

SC Medicaid CLTC

Age 65+ or disabled, South Carolina resident, Medicaid-eligible, nursing home-level care need.

~$2,829/month (300% FBR, individual).

$2,000 (individual), $3,000 (couple).

High rural demand; waitlists possible.

South Carolina Respite Care Program

SC NFCSP Respite

Caregiver of someone 60+ (or with dementia), South Carolina resident.

No strict limit; prioritizes low-income.

Not applicable.

Limited slots; rural/urban balance.

Medicare Savings Program (MSP)

South Carolina Medicare Savings Program

Age 65+ or disabled, SC resident, Medicare Part A/B.

~$2,510/month (QMB), ~$3,380/month (SLMB), ~$3,598/month (QI)—individual.

$9,430 (individual), $14,130 (couple).

Three tiers; includes Extra Help for Part D; no waitlist.

Low-Income Home Energy Assistance Program (LIHEAP)

South Carolina LIHEAP

Age 60+ prioritized, SC resident, low-income household.

~$3,970/month (individual, 185% FPL).

Not assessed; income-focused.

Covers gas, electric, oil; emergency aid via ECAP (~$500 max).

Senior Community Service Employment Program (SCSEP)

South Carolina SCSEP

Age 55+, unemployed, low-income, SC resident.

~$1,983/month (125% FPL).

Not specified; income-focused.

Priority for veterans, rural residents; Goodwill/AARP partnership.

VA Aid and Attendance (A&A) and Housebound Benefits

South Carolina VA Aid and Attendance/Housebound

Age 65+ or disabled veteran/spouse, SC resident, wartime service, need for ADL help (A&A) or homebound.

Net income < ~$1,984/month (veteran with dependent, A&A); pension offsets income.

~$155,356 (net worth limit).

High veteran population; supports rural/urban care needs.

Senior Farmers’ Market Nutrition Program (SFMNP)

South Carolina SFMNP

Age 60+, SC resident, low-income.

~$2,322/month (individual, 185% FPL).

Not assessed.

Vouchers (~$50/season); serves ~20,000 annually via 10 AAAs.

Homestead Exemption Program

South Carolina Homestead Exemption

Age 65+ (or disabled/blind), SC resident 1+ year, homeowner.

None; tax-based eligibility.

Not assessed; home-focused.

Saves ~$500-$1,000/year avg.; applies to primary residence.

Elderly Simplified Application Project (ESAP)

South Carolina ESAP (SNAP for Seniors)

Age 60+, SC resident, no earned income, not on SCCAP.

~$1,732/month (133% FPL, individual).

$4,250 (individual, higher than standard SNAP).

Simplified process; serves ~50,000 seniors annually.

More homes from the same owner

Operated by Phoenix SL
Tour Icon
Planning a tour? Check our touring checklist.
Chat Icon
Thinking of living here? We can help you speak to a current resident