

 Every person who worked here at any point in the quarter, employees and contractors. It is not how many are on site at once: that is the "on an average day" figure.
75
45 employees · 30 contractors · 20 on an average day
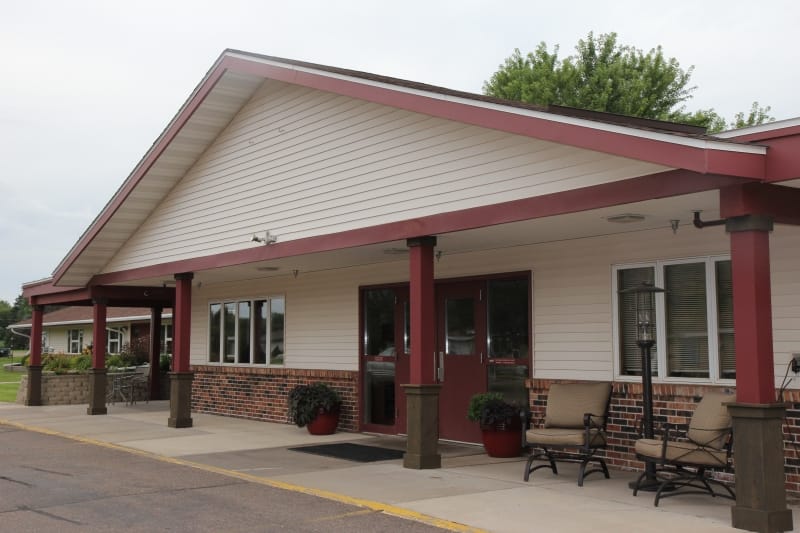
Oakbrook Health and Rehabilitation
Nursing Home & Skilled Nursing · Thorp, WI
CMS overall rating

 2/5
CMS (the Centers for Medicare & Medicaid Services) is the federal agency that rates nursing home quality. Its Overall Rating runs from 1 to 5 stars, combining health inspections, staffing, and quality measures, with inspections weighted most heavily.
2/5
CMS (the Centers for Medicare & Medicaid Services) is the federal agency that rates nursing home quality. Its Overall Rating runs from 1 to 5 stars, combining health inspections, staffing, and quality measures, with inspections weighted most heavily.
Oakbrook Health and Rehabilitation
Nursing Home & Skilled Nursing · Thorp, WI
CMS overall rating
2/5
CMS (the Centers for Medicare & Medicaid Services) is the federal agency that rates nursing home quality. Its Overall Rating runs from 1 to 5 stars, combining health inspections, staffing, and quality measures, with inspections weighted most heavily.
2/5
CMS (the Centers for Medicare & Medicaid Services) is the federal agency that rates nursing home quality. Its Overall Rating runs from 1 to 5 stars, combining health inspections, staffing, and quality measures, with inspections weighted most heavily.
Oakbrook Health and Rehabilitation accepts Medicare, Medicaid, and private pay.
Overview of Oakbrook Health and Rehabilitation

Oakbrook Health and Rehabilitation provides skilled nursing and nursing home care with a 58-bed setting in Thorp, Wisconsin. Residents receive continuous clinical support with nursing services on-site. Recovery support is also provided for those in rehabilitation to help improve their ability to function.
Medicare, Medicaid, and private pay are accepted, giving families several ways to cover care based on the resident’s eligibility and financial arrangements. Moreover, total nurse staffing is 4 hours and 16 minutes per resident per day, representing the daily nursing time allocated to each resident. Tracy Schultze is the administrator, while Thorp Nursing Home operates the community.
Quality ratings
The Overall CMS Rating combines results from health inspections, staffing levels and quality measures. Health inspections carry the most weight. Staffing and quality scores can increase or decrease the final rating based on performance compared to state and national standards.
Based on the results of the facility's three most recent standard inspections and any complaint investigations. CMS reviews the number, scope, and severity of deficiencies, with more recent findings weighted more heavily.
Measures average nursing staff hours per resident per day, including Registered Nurses (RNs) and total nursing staff. Ratings are adjusted based on the level of care residents require and are compared to state and national benchmarks.
Based on clinical and physical health indicators reported to CMS, such as hospital readmissions, falls, pressure ulcers, and improvements in mobility. These measures reflect how well residents' health needs are being managed.
Staffing
Data period: Q2 2026 (April 1 – June 30, 2026).
Nursing care per resident per day and state rankings: CMS Provider Information.
Headcount, shifts and contractors: CMS Payroll-Based Journal (PBJ).
Resident count: CMS Long-Term Care Facility Characteristics (data as of Sep 2026).
Total nursing care per resident / day
This nursing home is ranked 75th out of 164 nursing homes we track in Wisconsin for nurse hours. Total adjusted nursing hours per resident per day, combining RN, LPN, and aide time. CMS adjusts this for case-mix so facilities can be fairly compared.
4h 16m
This nursing home is ranked 75th out of 164 nursing homes we track in Wisconsin for nurse hours. Total adjusted nursing hours per resident per day, combining RN, LPN, and aide time. CMS adjusts this for case-mix so facilities can be fairly compared.
4h 16mStandout metric: LPN / LVN is +15% above Wisconsin average
3 of 6 metrics below Wisconsin average
Daily care time per resident, by role
Registered nurse (RN)
RNs hold the highest nursing license and can assess residents, interpret test results, and direct care plans. More RN hours per day often signals stronger clinical oversight and faster response to health changes. 9 total: 7 of the facility's own employees and 2 agency contractors.
9 staff · 8.6-hour shifts
1h 3m
↑ 9% · WI 58mThis facility: 1h 3m per resident per day, 9% above the Wisconsin average of 58m (among Wisconsin facilities reporting a recent figure).
RNs hold the highest nursing license and can assess residents, interpret test results, and direct care plans. More RN hours per day often signals stronger clinical oversight and faster response to health changes. 9 total: 7 of the facility's own employees and 2 agency contractors.
9 staff · 8.6-hour shiftsUS average: 41m.Green: 5% or more better than the state average. Yellow: within 5%. Red: 5% or more worse. US 41m
LPN / LVN
Licensed Practical Nurses (LPNs) or Licensed Vocational Nurses (LVNs) deliver routine hands-on care — medication administration, wound dressing, and monitoring vital signs. They work under RN supervision and make up a large share of daily bedside care. 8 total: 4 of the facility's own employees and 4 agency contractors.
8 staff · 7.9-hour shifts
44m
↑ 15% · WI 38mThis facility: 44m per resident per day, 15% above the Wisconsin average of 38m (among Wisconsin facilities reporting a recent figure).
Licensed Practical Nurses (LPNs) or Licensed Vocational Nurses (LVNs) deliver routine hands-on care — medication administration, wound dressing, and monitoring vital signs. They work under RN supervision and make up a large share of daily bedside care. 8 total: 4 of the facility's own employees and 4 agency contractors.
8 staff · 7.9-hour shiftsUS average: 52m.Green: 5% or more better than the state average. Yellow: within 5%. Red: 5% or more worse. US 52m
Certified nursing assistant
Certified Nurse Aides (CNAs) provide the most direct day-to-day assistance: bathing, dressing, feeding, and mobility. Nurse aide hours are typically the largest staffing category and directly affect residents' quality of life. All 23 are the facility's own employees; no agency contractors work in this role.
23 staff · 8.4-hour shifts
2h 30m
↓ 4% · WI 2h 35mThis facility: 2h 30m per resident per day, 4% below the Wisconsin average of 2h 35m (among Wisconsin facilities reporting a recent figure).
Certified Nurse Aides (CNAs) provide the most direct day-to-day assistance: bathing, dressing, feeding, and mobility. Nurse aide hours are typically the largest staffing category and directly affect residents' quality of life. All 23 are the facility's own employees; no agency contractors work in this role.
23 staff · 8.4-hour shiftsUS average: 2h 20m.Green: 5% or more better than the state average. Yellow: within 5%. Red: 5% or more worse. US 2h 20m
Physical therapist
Hours per resident per day provided by licensed Physical Therapists (PTs) or PT Assistants. PT services help residents recover mobility after injury or illness and are especially important for post-acute (short-stay) rehabilitation.
3m
↓ 34% · WI 4mThis facility: 3m per resident per day, 34% below the Wisconsin average of 4m (among Wisconsin facilities reporting a recent figure).
Hours per resident per day provided by licensed Physical Therapists (PTs) or PT Assistants. PT services help residents recover mobility after injury or illness and are especially important for post-acute (short-stay) rehabilitation.
US average: 4m.Green: 5% or more better than the state average. Yellow: within 5%. Red: 5% or more worse. US 4m
Total nursing, weekends
Combined nursing hours (RN + LPN + Nurse Aide) per resident per day on weekends. Staffing often drops on weekends — this figure reveals whether the facility maintains adequate coverage outside of weekday hours.
RN + LPN + aide · Sat–Sun
3h 51m
↑ 3% · WI 3h 43mThis facility: 3h 51m per resident per day, 3% above the Wisconsin average of 3h 43m (among Wisconsin facilities reporting a recent figure).
Combined nursing hours (RN + LPN + Nurse Aide) per resident per day on weekends. Staffing often drops on weekends — this figure reveals whether the facility maintains adequate coverage outside of weekday hours.
RN + LPN + aide · Sat–SunUS average: 3h 26m.Green: 5% or more better than the state average. Yellow: within 5%. Red: 5% or more worse. US 3h 26m
RN, weekends
Registered nurse hours specifically on weekends. Facilities sometimes reduce RN presence on Saturdays and Sundays — a low weekend RN figure compared to weekday hours can indicate reduced clinical oversight when most administrative staff are absent.
Sat–Sun
38m
↓ 4% · WI 40mThis facility: 38m per resident per day, 4% below the Wisconsin average of 40m (among Wisconsin facilities reporting a recent figure).
Registered nurse hours specifically on weekends. Facilities sometimes reduce RN presence on Saturdays and Sundays — a low weekend RN figure compared to weekday hours can indicate reduced clinical oversight when most administrative staff are absent.
Sat–SunUS average: 28m.Green: 5% or more better than the state average. Yellow: within 5%. Red: 5% or more worse. US 28m
Headcount
Every person who worked here at any point in the quarter, employees and contractors. It is not how many are on site at once: that is the "on an average day" figure.
75
45 employees · 30 contractors · 20 on an average day
75 total staff / 39 residents. Residents: CMS Long-Term Care Facility Characteristics (data as of Sep 2026); staff: CMS Payroll-Based Journal (Q2 2026).Residents and staff come from two different CMS releases, so the two counts can be a few months apart.
1.92 : 1
↓ 20% · WI 2.40This facility: 1.92 staff per resident, 20% below the Wisconsin average of 2.40 (among Wisconsin facilities reporting a recent figure).Green: 5% or more better than the state average. Yellow: within 5%. Red: 5% or more worse.
75 staff ÷ 39 residents
See full Wisconsin ranking →
Average hours one staff member works on a day they are on shift, across every role.
7.3 h
≈ 0% · WI 7.3 hThis facility: 7.3 h, level with the Wisconsin average of 7.3 h (among Wisconsin facilities reporting a recent figure).Green: 5% or more better than the state average. Yellow: within 5%. Red: 5% or more worse.
13,255 staff hours this quarter
See full Wisconsin ranking →91.4% of staff hours were worked by the facility's own employees
Wisconsin average: 88.4% · Contractors this quarter: Physical Therapy Aide (5), Respiratory Therapy Technician (5), Qualified Social Worker (4), Licensed Practical Nurse (4), Speech Language Pathologist (4), Physical Therapy Assistant (3), Registered Nurse (2), Occupational Therapy Aide (1), Occupational Therapy Assistant (1), Medical Director (1)
Why it matters: employees work here week after week and get to know each resident's routines and needs. Agency contractors often rotate between facilities, so a higher employee share usually means more consistent care.
By The Numbers
Community insights.
Bed count
A smaller, more intimate setting that may offer a quieter environment and closer staff-resident interactions.
58
Rank #111 / 197Bed count — State benchmarked This nursing home is ranked 111th out of 197 nursing homes we track in Wisconsin for bed count. Shows this facility's certified or reported bed count compared to other Wisconsin facilities. Larger communities may offer more amenities, programs, and on-site services for residents and families. Communities with the same value for a metric share the same rank. Rankings compare like with like: every nursing home we track in Wisconsin that reports data for that category. Nursing homes without available data are excluded, so the pool size varies from metric to metric.
A smaller, more intimate setting that may offer a quieter environment and closer staff-resident interactions.
58
Rank #111 / 197Bed count — State benchmarked This nursing home is ranked 111th out of 197 nursing homes we track in Wisconsin for bed count. Shows this facility's certified or reported bed count compared to other Wisconsin facilities. Larger communities may offer more amenities, programs, and on-site services for residents and families. Communities with the same value for a metric share the same rank. Rankings compare like with like: every nursing home we track in Wisconsin that reports data for that category. Nursing homes without available data are excluded, so the pool size varies from metric to metric.Smaller home · May offer a more intimate, personalized care environment.
Walk Score
Somewhat walkable. Some errands can be accomplished on foot, with a mix of nearby amenities.
Rank #63 / 191Walk Score — State benchmarked This nursing home is ranked 63rd out of 191 nursing homes we track in Wisconsin for walk score. Shows how walkable this facility's neighborhood is compared to the average walk score across Wisconsin facilities. Higher scores benefit residents, families, and staff. Communities with the same value for a metric share the same rank. Rankings compare like with like: every nursing home we track in Wisconsin that reports data for that category. Nursing homes without available data are excluded, so the pool size varies from metric to metric.
Somewhat walkable. Some errands can be accomplished on foot, with a mix of nearby amenities.
Rank #63 / 191Walk Score — State benchmarked This nursing home is ranked 63rd out of 191 nursing homes we track in Wisconsin for walk score. Shows how walkable this facility's neighborhood is compared to the average walk score across Wisconsin facilities. Higher scores benefit residents, families, and staff. Communities with the same value for a metric share the same rank. Rankings compare like with like: every nursing home we track in Wisconsin that reports data for that category. Nursing homes without available data are excluded, so the pool size varies from metric to metric.
60
/ 100
Occupancy rate
Occupancy lower than 85% suggests more openings may be available.
Rank #137 / 167Occupancy rate — State benchmarked This nursing home is ranked 137th out of 167 nursing homes we track in Wisconsin for occupancy. Shows this facility's occupancy rate versus the Wisconsin average, with its Statewide rank out of 167. Higher occupancy signals strong local demand and financial stability. Communities with the same value for a metric share the same rank. Rankings compare like with like: every nursing home we track in Wisconsin that reports data for that category. Nursing homes without available data are excluded, so the pool size varies from metric to metric.
Occupancy lower than 85% suggests more openings may be available.
Rank #137 / 167Occupancy rate — State benchmarked This nursing home is ranked 137th out of 167 nursing homes we track in Wisconsin for occupancy. Shows this facility's occupancy rate versus the Wisconsin average, with its Statewide rank out of 167. Higher occupancy signals strong local demand and financial stability. Communities with the same value for a metric share the same rank. Rankings compare like with like: every nursing home we track in Wisconsin that reports data for that category. Nursing homes without available data are excluded, so the pool size varies from metric to metric.
58.3%
This home usually has availability
Based on 33.8 residents and 58 beds. Source: CMS Provider Information, average daily residents (data as of Oct 2026)
 Lower than the Wisconsin average: 72.1%
Avg. Length of Stay
Average number of days residents stay at this facility, based on CMS cost report data. Shorter stays often reflect post-acute or rehab care; longer stays reflect long-term care.
Average number of days residents stay at this facility, based on CMS cost report data. Shorter stays often reflect post-acute or rehab care; longer stays reflect long-term care.
131
days
About This Community
Facility TypeSkilled Care
CountyClark
Certification TypeTitle 18 SNF Title 19 NF
Oakbrook Health and Rehabilitation is administered by Tracy Schultze.
Owner NameThorp Nursing Home Inc
Profit StatusFor-profit
Resident Council
Fax(715) 669-5223
Pets not allowed
CMS Health Inspection History
Total health inspections
6
↓ 3% · WI 6.2This facility: 6, 3% below the WI average of 6.2 (among WI facilities reporting a recent figure).Green: 5% or more better than the state average. Yellow: within 5%. Red: 5% or more worse.
Total health citations
10
Rank #28 / 168Health citations — State benchmarked This nursing home is ranked 28th out of 168 nursing homes we track in Wisconsin for health citations. Shows this facility's total health deficiency citations benchmarked to the Wisconsin State average, with a ranking across all 168 WI facilities. Lower citation counts earn a better rank. Communities with the same value for a metric share the same rank. Rankings compare like with like: every nursing home we track in Wisconsin that reports data for that category. Nursing homes without available data are excluded, so the pool size varies from metric to metric.↓ 65% · WI 28.3This facility: 10, 65% below the WI average of 28.3 (among WI facilities reporting a recent figure).Green: 5% or more better than the state average. Yellow: within 5%. Red: 5% or more worse.
Citations per inspection
1.67
Rank #7 / 168Citations per inspection — State benchmarked This nursing home is ranked 7th out of 168 nursing homes we track in Wisconsin for citations per inspection. Shows average deficiency citations per CMS inspection for this facility versus the Wisconsin mean across 168 facilities with citation data. Lower is better. Communities with the same value for a metric share the same rank. Rankings compare like with like: every nursing home we track in Wisconsin that reports data for that category. Nursing homes without available data are excluded, so the pool size varies from metric to metric.↓ 61% · WI 4.24This facility: 1.67, 61% below the WI average of 4.24 (among WI facilities reporting a recent figure).Green: 5% or more better than the state average. Yellow: within 5%. Red: 5% or more worse.
Citation severity
 100% corrected
10 of 10 citations corrected
Critical
J–L
0
↓ 100% · WI 0.9This facility: 0, 100% below the WI average of 0.9 (among WI facilities reporting a recent figure).Green: 5% or more better than the state average. Yellow: within 5%. Red: 5% or more worse.
Immediate jeopardy
Serious
G–I
0
↓ 100% · WI 1.2This facility: 0, 100% below the WI average of 1.2 (among WI facilities reporting a recent figure).Green: 5% or more better than the state average. Yellow: within 5%. Red: 5% or more worse.
Actual harm
Moderate
D–F
10
↓ 61% · WI 25.8This facility: 10, 61% below the WI average of 25.8 (among WI facilities reporting a recent figure).Green: 5% or more better than the state average. Yellow: within 5%. Red: 5% or more worse.
No harm, more than minimal risk
Minor
A–C
0
↓ 100% · WI 0.5This facility: 0, 100% below the WI average of 0.5 (among WI facilities reporting a recent figure).Green: 5% or more better than the state average. Yellow: within 5%. Red: 5% or more worse.
No harm, minimal riskLatest inspection: May 27, 2026 · 1 citation (Abuse/Neglect, moderate), corrected
Most cited category: Abuse, Neglect & Exploitation, 5 of 10 citations · 3 categories in total
Citations history
Most recent first
May 27, 2026
1 citation
Abuse/Neglect moderate citation
Corrected
Corrected
Mar 10, 2026
1 citation
Abuse/Neglect moderate citation
Corrected
Corrected
Jan 29, 2026
3 citations
Infection Control moderate citation
Corrected
Corrected
Care Planning moderate citation
Corrected
Corrected
Infection Control moderate citation
Corrected
Corrected
Nov 10, 2025
2 citations
Abuse/Neglect moderate citation
Corrected
Corrected
Care Planning moderate citation
Corrected
Corrected
Jun 13, 2025
2 citations
Abuse/Neglect moderate citation
Corrected
Corrected
Abuse/Neglect moderate citation
Corrected
Corrected
Oct 16, 2024
1 citation
Care Planning moderate citation
Corrected
Corrected
Top deficiency categories
Share of 10 citations
Abuse, Neglect & Exploitation
5 deficiencies (50%)
Resident Assessment & Care Planning
3 deficiencies (30%)
Infection Control
2 deficiencies (20%)
How citations are counted
Health citations are formal notices following inspections when they fail to comply with safety and care standards.
4 of 10 citations resulted from standard inspections; and 6 of 10 resulted from complaint investigations.
Includes all CMS health inspection records for this property, which could include management/ownership changes.
Source
Data sourced from CMS Health Deficiencies reports. Citation severity codes range from A (least serious) to L (most serious). Immediate Jeopardy (J-L) citations indicate situations where the facility's noncompliance has placed residents at risk of death or serious harm.
Enforcement
Penalties and fines
Penalties and fines
Federal penalties imposed by CMS for regulatory violations, including civil money penalties (fines) and denials of payment for new Medicare/Medicaid admissions.
Source: CMS Penalties Database · Data as of Oct 2026
No penalties in the past 3 years
No civil money penalties or payment denials on record since Oct 2023.
Total fines
$0
WI avg $107KWisconsin average: $106,807. Average among the 146 Wisconsin facilities with a penalty on record.US avg $66KUS average: $66,281, among the 6,725 US facilities with a penalty on record.
Number of fines
0
WI avg 2.03Wisconsin average: 2.03. Average among the 146 Wisconsin facilities with a penalty on record.US avg 1.88US average: 1.88, among the 6,725 US facilities with a penalty on record.
Payment denials
Serious action where Medicare and/or Medicaid temporarily stops payments for new residents until issues are fixed.
Serious action where Medicare and/or Medicaid temporarily stops payments for new residents until issues are fixed.
0
WI avg 0.71Wisconsin average: 0.71. Average among the 146 Wisconsin facilities with a penalty on record.US avg 0.35US average: 0.35, among the 6,725 US facilities with a penalty on record.
Health Outcomes
Quality of care over time
How residents at this home fare on health outcomes and preventive care, compared with the Wisconsin average.
CMS star rating for the care of long-stay residents, who live at the home for 100 days or more. It is built from the long-stay quality measures below. 5 stars is the best.
4
/ 5
Above average
CMS star rating for the care of short-stay residents, mostly people recovering after a hospital stay for under 100 days. It is built from the short-stay quality measures below. 5 stars is the best.
1
/ 5
Significantly below average
Average of five long-stay measures: pressure ulcers, falls with major injury, unplanned weight loss, worsening ability to walk, and needing more help with daily activities. Each is the % of residents affected, so lower is better.
8.7
Score · lower is better
↓ 3% · WI 9.0This facility: 8.7, 3% below the WI average of 9.0 (among WI facilities reporting a recent figure).Green: 5% or more better than the state average. Yellow: within 5%. Red: 5% or more worse.
Average of three long-stay measures: needing more help with daily activities, worsening ability to walk, and loss of bowel or bladder control. Each is the % of residents affected, so lower is better.
14.8
Score · lower is better
↓ 21% · WI 18.9This facility: 14.8, 21% below the WI average of 18.9 (among WI facilities reporting a recent figure).Green: 5% or more better than the state average. Yellow: within 5%. Red: 5% or more worse.13 long-stay measures: 7 better, 2 worse, 4 near WI average
8 short-stay measures: 2 better, 3 worse, 3 compared with US only
Long-stay residents
People who live at the home · 13 measures
Daily care & independence
Needed more help with daily activities
Percent of long-stay residents whose need for help with daily activities has increased
23.7%
↑ 50% · WI 15.8This facility: 23.7, 50% above the WI average of 15.8 (among WI facilities reporting a recent figure).Green: 5% or more better than the state average. Yellow: within 5%. Red: 5% or more worse.
Percent of long-stay residents whose need for help with daily activities has increased
23.7%
↑ 50% · WI 15.8This facility: 23.7, 50% above the WI average of 15.8 (among WI facilities reporting a recent figure).Green: 5% or more better than the state average. Yellow: within 5%. Red: 5% or more worse.
Walking ability worsened
Percent of long-stay residents whose ability to move independently worsened
11.3%
↓ 34% · WI 17.0This facility: 11.3, 34% below the WI average of 17.0 (among WI facilities reporting a recent figure).Green: 5% or more better than the state average. Yellow: within 5%. Red: 5% or more worse.
Percent of long-stay residents whose ability to move independently worsened
11.3%
↓ 34% · WI 17.0This facility: 11.3, 34% below the WI average of 17.0 (among WI facilities reporting a recent figure).Green: 5% or more better than the state average. Yellow: within 5%. Red: 5% or more worse.
Bowel or bladder incontinence (low-risk residents)
Percent of low risk long-stay residents who lose control of their bowels or bladder
9.6%
↓ 59% · WI 23.6This facility: 9.6, 59% below the WI average of 23.6 (among WI facilities reporting a recent figure).Green: 5% or more better than the state average. Yellow: within 5%. Red: 5% or more worse.
Percent of low risk long-stay residents who lose control of their bowels or bladder
9.6%
↓ 59% · WI 23.6This facility: 9.6, 59% below the WI average of 23.6 (among WI facilities reporting a recent figure).Green: 5% or more better than the state average. Yellow: within 5%. Red: 5% or more worse.Safety & clinical stability
Urinary tract infection
Percent of long-stay residents with a urinary tract infection
0.9%
↓ 65% · WI 2.7This facility: 0.9, 65% below the WI average of 2.7 (among WI facilities reporting a recent figure).Green: 5% or more better than the state average. Yellow: within 5%. Red: 5% or more worse.
Percent of long-stay residents with a urinary tract infection
0.9%
↓ 65% · WI 2.7This facility: 0.9, 65% below the WI average of 2.7 (among WI facilities reporting a recent figure).Green: 5% or more better than the state average. Yellow: within 5%. Red: 5% or more worse.
Falls with major injury
Percent of long-stay residents experiencing one or more falls with major injury
1.8%
↓ 45% · WI 3.3This facility: 1.8, 45% below the WI average of 3.3 (among WI facilities reporting a recent figure).Green: 5% or more better than the state average. Yellow: within 5%. Red: 5% or more worse.
Percent of long-stay residents experiencing one or more falls with major injury
1.8%
↓ 45% · WI 3.3This facility: 1.8, 45% below the WI average of 3.3 (among WI facilities reporting a recent figure).Green: 5% or more better than the state average. Yellow: within 5%. Red: 5% or more worse.
Pressure ulcers (high-risk residents)
Percent of long-stay high risk residents with pressure ulcers
5.9%
↑ 20% · WI 4.9This facility: 5.9, 20% above the WI average of 4.9 (among WI facilities reporting a recent figure).Green: 5% or more better than the state average. Yellow: within 5%. Red: 5% or more worse.
Percent of long-stay high risk residents with pressure ulcers
5.9%
↑ 20% · WI 4.9This facility: 5.9, 20% above the WI average of 4.9 (among WI facilities reporting a recent figure).Green: 5% or more better than the state average. Yellow: within 5%. Red: 5% or more worse.Physical & mental health
Lost too much weight
Percent of long-stay residents who lose too much weight
1.0%
↓ 80% · WI 4.9This facility: 1.0, 80% below the WI average of 4.9 (among WI facilities reporting a recent figure).Green: 5% or more better than the state average. Yellow: within 5%. Red: 5% or more worse.
Percent of long-stay residents who lose too much weight
1.0%
↓ 80% · WI 4.9This facility: 1.0, 80% below the WI average of 4.9 (among WI facilities reporting a recent figure).Green: 5% or more better than the state average. Yellow: within 5%. Red: 5% or more worse.
Depressive symptoms
Percent of long-stay residents who have depressive symptoms
0.0%
↓ 100% · WI 6.0This facility: 0.0, 100% below the WI average of 6.0 (among WI facilities reporting a recent figure).Green: 5% or more better than the state average. Yellow: within 5%. Red: 5% or more worse.
Percent of long-stay residents who have depressive symptoms
0.0%
↓ 100% · WI 6.0This facility: 0.0, 100% below the WI average of 6.0 (among WI facilities reporting a recent figure).Green: 5% or more better than the state average. Yellow: within 5%. Red: 5% or more worse.
Antipsychotic use
Percent of long-stay residents who received an antipsychotic medication
6.2%
↓ 61% · WI 15.9This facility: 6.2, 61% below the WI average of 15.9 (among WI facilities reporting a recent figure).Green: 5% or more better than the state average. Yellow: within 5%. Red: 5% or more worse.
Percent of long-stay residents who received an antipsychotic medication
6.2%
↓ 61% · WI 15.9This facility: 6.2, 61% below the WI average of 15.9 (among WI facilities reporting a recent figure).Green: 5% or more better than the state average. Yellow: within 5%. Red: 5% or more worse.Preventive care
Pneumococcal vaccine
Percent of long-stay residents assessed and appropriately given the pneumococcal vaccine
99.1%
↑ 3% · WI 96.0This facility: 99.1, 3% above the WI average of 96.0 (among WI facilities reporting a recent figure).Green: 5% or more better than the state average. Yellow: within 5%. Red: 5% or more worse.
Percent of long-stay residents assessed and appropriately given the pneumococcal vaccine
99.1%
↑ 3% · WI 96.0This facility: 99.1, 3% above the WI average of 96.0 (among WI facilities reporting a recent figure).Green: 5% or more better than the state average. Yellow: within 5%. Red: 5% or more worse.
Flu vaccine
Percent of long-stay residents assessed and appropriately given the seasonal influenza vaccine
93.8%
↓ 2% · WI 95.6This facility: 93.8, 2% below the WI average of 95.6 (among WI facilities reporting a recent figure).Green: 5% or more better than the state average. Yellow: within 5%. Red: 5% or more worse.
Percent of long-stay residents assessed and appropriately given the seasonal influenza vaccine
93.8%
↓ 2% · WI 95.6This facility: 93.8, 2% below the WI average of 95.6 (among WI facilities reporting a recent figure).Green: 5% or more better than the state average. Yellow: within 5%. Red: 5% or more worse.Hospital & emergency visits
Hospitalizations per 1,000 days
Number of hospitalizations per 1,000 long-stay resident days.
1.64
↑ 2% · WI 1.61This facility: 1.64, 2% above the WI average of 1.61 (among WI facilities reporting a recent figure).Green: 5% or more better than the state average. Yellow: within 5%. Red: 5% or more worse.
Number of hospitalizations per 1,000 long-stay resident days.
1.64
↑ 2% · WI 1.61This facility: 1.64, 2% above the WI average of 1.61 (among WI facilities reporting a recent figure).Green: 5% or more better than the state average. Yellow: within 5%. Red: 5% or more worse.
ER visits per 1,000 days
Number of outpatient emergency department visits per 1,000 long-stay resident days.
2.17
↓ 1% · WI 2.19This facility: 2.17, 1% below the WI average of 2.19 (among WI facilities reporting a recent figure).Green: 5% or more better than the state average. Yellow: within 5%. Red: 5% or more worse.
Number of outpatient emergency department visits per 1,000 long-stay resident days.
2.17
↓ 1% · WI 2.19This facility: 2.17, 1% below the WI average of 2.19 (among WI facilities reporting a recent figure).Green: 5% or more better than the state average. Yellow: within 5%. Red: 5% or more worse.Short-stay residents
Rehab and recovery after a hospital stay · 8 measures
Daily care & independence
Able to care for self at discharge
Percentage of residents at or above expected ability to care for themselves at discharge.
54.3%
↑ 1% · US 53.7This facility: 54.3, 1% above the US average of 53.7 (among US facilities reporting a recent figure).
Percentage of residents at or above expected ability to care for themselves at discharge.
54.3%
↑ 1% · US 53.7This facility: 54.3, 1% above the US average of 53.7 (among US facilities reporting a recent figure).
Returned home or to the community
Rate of successful return to home or community from a skilled nursing facility.
43.2%
↓ 15% · US 50.6This facility: 43.2, 15% below the US average of 50.6 (among US facilities reporting a recent figure).
Rate of successful return to home or community from a skilled nursing facility.
43.2%
↓ 15% · US 50.6This facility: 43.2, 15% below the US average of 50.6 (among US facilities reporting a recent figure).Safety & clinical stability
Falls with major injury
Percentage of SNF residents who experience falls with major injury during their stay.
2.4%
↑ 209% · US 0.8This facility: 2.4, 209% above the US average of 0.8 (among US facilities reporting a recent figure).
Percentage of SNF residents who experience falls with major injury during their stay.
2.4%
↑ 209% · US 0.8This facility: 2.4, 209% above the US average of 0.8 (among US facilities reporting a recent figure).Physical & mental health
New antipsychotic medication
Percent of short-stay residents who newly received an antipsychotic medication
2.7%
↑ 130% · WI 1.2This facility: 2.7, 130% above the WI average of 1.2 (among WI facilities reporting a recent figure).Green: 5% or more better than the state average. Yellow: within 5%. Red: 5% or more worse.
Percent of short-stay residents who newly received an antipsychotic medication
2.7%
↑ 130% · WI 1.2This facility: 2.7, 130% above the WI average of 1.2 (among WI facilities reporting a recent figure).Green: 5% or more better than the state average. Yellow: within 5%. Red: 5% or more worse.Preventive care
Pneumococcal vaccine
Percent of short-stay residents assessed and appropriately given the pneumococcal vaccine
93.2%
↑ 7% · WI 86.9This facility: 93.2, 7% above the WI average of 86.9 (among WI facilities reporting a recent figure).Green: 5% or more better than the state average. Yellow: within 5%. Red: 5% or more worse.
Percent of short-stay residents assessed and appropriately given the pneumococcal vaccine
93.2%
↑ 7% · WI 86.9This facility: 93.2, 7% above the WI average of 86.9 (among WI facilities reporting a recent figure).Green: 5% or more better than the state average. Yellow: within 5%. Red: 5% or more worse.
Flu vaccine
Percent of short-stay residents assessed and appropriately given the seasonal influenza vaccine
76.7%
↓ 7% · WI 82.2This facility: 76.7, 7% below the WI average of 82.2 (among WI facilities reporting a recent figure).Green: 5% or more better than the state average. Yellow: within 5%. Red: 5% or more worse.
Percent of short-stay residents assessed and appropriately given the seasonal influenza vaccine
76.7%
↓ 7% · WI 82.2This facility: 76.7, 7% below the WI average of 82.2 (among WI facilities reporting a recent figure).Green: 5% or more better than the state average. Yellow: within 5%. Red: 5% or more worse.Hospital & emergency visits
Re-hospitalized after admission
Percentage of short-stay residents who were re-hospitalized after their nursing home admission.
11.8%
↓ 48% · WI 22.7This facility: 11.8, 48% below the WI average of 22.7 (among WI facilities reporting a recent figure).Green: 5% or more better than the state average. Yellow: within 5%. Red: 5% or more worse.
Percentage of short-stay residents who were re-hospitalized after their nursing home admission.
11.8%
↓ 48% · WI 22.7This facility: 11.8, 48% below the WI average of 22.7 (among WI facilities reporting a recent figure).Green: 5% or more better than the state average. Yellow: within 5%. Red: 5% or more worse.
ER visits
Percentage of short-stay residents who had an outpatient emergency department visit.
31.3%
↑ 109% · WI 15.0This facility: 31.3, 109% above the WI average of 15.0 (among WI facilities reporting a recent figure).Green: 5% or more better than the state average. Yellow: within 5%. Red: 5% or more worse.
Percentage of short-stay residents who had an outpatient emergency department visit.
31.3%
↑ 109% · WI 15.0This facility: 31.3, 109% above the WI average of 15.0 (among WI facilities reporting a recent figure).Green: 5% or more better than the state average. Yellow: within 5%. Red: 5% or more worse.Arrows show whether a figure is above or below the average. Green is better for residents, red is worse, and yellow means within 5% of the average. Grey compares with the US average only, because CMS publishes no state figure. The line on each bar marks the average.
Quality measures are calculated by CMS from Minimum Data Set (MDS) resident assessments and Medicare claims.
Money and staffing.
Oakbrook Health and Rehabilitation’s finances from its CMS cost report for the fiscal year ending December 2024, compared with 164 Wisconsin nursing homes that filed a recent report. Includes all financial data for this property, which could include management/ownership changes.
FY Dec 2024
Is it financially stable?
Profitable on care
6.3% operating margin
−0.6 pts vs prior year
Positive margin in 3 of the last 8 reported years. Net income $0.3M after other income.
Does it invest in staff?
Spends less on payroll than most Wisconsin homes
54.8% payroll share of revenue
WI average 58.7%Rank #93 / 164Payroll % of net patient revenue — State benchmarked This nursing home is ranked 93rd out of 164 nursing homes we track in Wisconsin for payroll % of net patient revenue. Shows payroll as a percentage of net patient revenue versus the Wisconsin average, among facilities reporting a recent fiscal year. Below 25% may signal understaffing or heavy agency use — read with Staffing ratings. Communities with the same value for a metric share the same rank. Rankings compare like with like: every nursing home we track in Wisconsin that reports data for that category. Nursing homes without available data are excluded, so the pool size varies from metric to metric.
Payroll rose $0.3M while revenue rose $0.5M. A low share can mean leaner staffing; check hours per resident in the staffing section.
FY 2024 scorecard
Each row shows the FY 2024 figure, the change since the prior report, the trend, and how it compares with Wisconsin homes.
Revenue & profit
Profitable on care
| Metric | FY 2024 | vs prior year | Trend 2017 → 2024Trend | WI median | Compared with WI homesRank in WI | In short |
|---|---|---|---|---|---|---|
| Net patient revenue What the home earns from resident care, after discounts and bad debt. | $4.3M | +$0.5M | Trend 20172024 | WI median $8.3M | Rank in WI Rank #152 / 164Net patient revenue — State benchmarked This nursing home is ranked 152nd out of 164 nursing homes we track in Wisconsin for net patient revenue. Shows this facility's net patient revenue compared to the Wisconsin average, among facilities reporting a recent fiscal year. Higher revenue generally means more resources for staffing and capital — read alongside Payroll %. Communities with the same value for a metric share the same rank. Rankings compare like with like: every nursing home we track in Wisconsin that reports data for that category. Nursing homes without available data are excluded, so the pool size varies from metric to metric. Higher than 7% of homes | Below WI median Higher net patient revenue than 7% of WI homes that filed a recent report. Revenue mostly follows how big a home is. |
| Operating expenses Everything it costs to run the home: staff, supplies, rent, admin. | $4.1M | +$0.5M | Trend 20172024 | WI median $8.4M | Rank in WI Rank #159 / 164Operating expenses — State benchmarked This nursing home is ranked 159th out of 164 nursing homes we track in Wisconsin for operating expenses. Shows everything it cost to run the home — staff, supplies, rent, admin — compared with other Wisconsin homes reporting a recent fiscal year. Expenses in dollars mostly follow how big a home is, so this compares size, not efficiency; read it next to operating margin. Communities with the same value for a metric share the same rank. Rankings compare like with like: every nursing home we track in Wisconsin that reports data for that category. Nursing homes without available data are excluded, so the pool size varies from metric to metric. Higher than 3% of homes | Within revenue Operating expenses are lower than net patient revenue, so resident care covers its costs. |
| Net patient income Revenue minus operating expenses. Negative means care loses money. | $0.3M | +$0.0M | Trend 20172024 | WI median −$0.1M | Rank in WI Rank #53 / 164Net patient income — State benchmarked This nursing home is ranked 53rd out of 164 nursing homes we track in Wisconsin for net patient income. Shows net patient revenue minus operating expenses, compared with other Wisconsin homes reporting a recent fiscal year. Homes that lost money on care are in the pool too, so a rank in the bottom half usually means a loss. Communities with the same value for a metric share the same rank. Rankings compare like with like: every nursing home we track in Wisconsin that reports data for that category. Nursing homes without available data are excluded, so the pool size varies from metric to metric. Higher than 68% of homes | Profit, growing Resident care made money this year, more than in the prior report. |
| Operating margin Net patient income as a share of revenue. The clearest health signal. | 6.3% | −0.6 pts | Trend 20172024 | WI median −1.0% | Rank in WI Rank #32 / 164Operating margin — State benchmarked This nursing home is ranked 32nd out of 164 nursing homes we track in Wisconsin for operating margin. Shows net patient income as a share of net patient revenue, compared with other Wisconsin homes reporting a recent fiscal year. Unlike the dollar figures it does not follow size, so it is the fairest comparison of financial health between a small home and a large one. Communities with the same value for a metric share the same rank. Rankings compare like with like: every nursing home we track in Wisconsin that reports data for that category. Nursing homes without available data are excluded, so the pool size varies from metric to metric. Higher than 81% of homes | Healthy margin More than 5% of revenue is left after operating expenses. |
| Other income Money not from resident care: investments, grants, services. | $0.0M | — | Trend — | WI median $0.1M | Rank in WI Rank #150 / 162Other income — State benchmarked This nursing home is ranked 150th out of 162 nursing homes we track in Wisconsin for other income. Shows income from outside resident care — investments, grants, rentals, services — compared with other Wisconsin homes reporting a recent fiscal year. It is not part of net patient revenue; a high rank here can offset a loss on care. Communities with the same value for a metric share the same rank. Rankings compare like with like: every nursing home we track in Wisconsin that reports data for that category. Nursing homes without available data are excluded, so the pool size varies from metric to metric. Higher than 7% of homes | Adds to profit Income from outside resident care, on top of the profit from care. |
| Net income The bottom line after other income. | $0.3M | +$0.0M | Trend — | WI median $0.2M | Rank in WI Rank #69 / 164Net income — State benchmarked This nursing home is ranked 69th out of 164 nursing homes we track in Wisconsin for net income. Shows the bottom line after other income, compared with other Wisconsin homes reporting a recent fiscal year. Homes with a net loss are in the pool too, so a rank in the bottom half usually means a loss. Communities with the same value for a metric share the same rank. Rankings compare like with like: every nursing home we track in Wisconsin that reports data for that category. Nursing homes without available data are excluded, so the pool size varies from metric to metric. Higher than 58% of homes | Profit The bottom line is above zero after other income. |
Staffing spend
Spends less of revenue on staff than most Wisconsin homes
| Metric | FY 2024 | vs prior year | Trend 2017 → 2024Trend | WI median | Compared with WI homesRank in WI | In short |
|---|---|---|---|---|---|---|
| Payroll costs Salaries and wage-related benefits, not counting contract labor. | $2.4M | +$0.3M | Trend 20172024 | WI median $4.4M | Rank in WI Rank #150 / 164Payroll costs — State benchmarked This nursing home is ranked 150th out of 164 nursing homes we track in Wisconsin for payroll costs. Shows total staff payroll — salaries plus wage-related benefits — benchmarked to the Wisconsin average, among facilities reporting a recent fiscal year. Higher payroll relative to peers often signals better staffing and less reliance on contract labor. Communities with the same value for a metric share the same rank. Rankings compare like with like: every nursing home we track in Wisconsin that reports data for that category. Nursing homes without available data are excluded, so the pool size varies from metric to metric. Higher than 9% of homes | Below WI median Higher payroll than 9% of WI homes. Payroll in dollars mostly follows how big a home is, so this compares size, not staffing levels. |
| Payroll share of revenue Payroll divided by revenue. Higher usually means more staff per resident. | 54.8% | +1.9 pts | Trend 20172024 | WI median 56.9% | Rank in WI Rank #93 / 164Payroll % of net patient revenue — State benchmarked This nursing home is ranked 93rd out of 164 nursing homes we track in Wisconsin for payroll % of net patient revenue. Shows payroll as a percentage of net patient revenue versus the Wisconsin average, among facilities reporting a recent fiscal year. Below 25% may signal understaffing or heavy agency use — read with Staffing ratings. Communities with the same value for a metric share the same rank. Rankings compare like with like: every nursing home we track in Wisconsin that reports data for that category. Nursing homes without available data are excluded, so the pool size varies from metric to metric. Higher than 44% of homes | 3.9 pts under WI average The WI average is 58.7% of revenue. Within 3 points of it reads as near the average. |
Charts, 2017–2024 2 charts · WI benchmark drawn as a dashed line
Revenue, expenses and income
What the home earned from resident care (net patient revenue), what it cost to run (operating expenses) and the difference between the two (net patient income), for each fiscal year it filed a CMS cost report.
USD, millions
Net patient revenue Operating expenses Net patient income
Where revenue goes
Both lines are a share of net patient revenue. Payroll share is what goes to salaries and wage-related benefits; operating margin is what is left after every operating cost (below 0%, resident care lost money). The dashed line is the Wisconsin payroll average.
% of net patient revenue
Payroll share Operating margin WI payroll average
Year-by-year data, 2017–2024 every reported year · latest first, scroll sideways
| Metric | 2017 | 2018 | 2019 | 2020 | 2021 | 2022 | 2023 | 2024 |
|---|---|---|---|---|---|---|---|---|
| Net patient revenue | $3.2M | $2.9M | $3.1M | $2.7M | $2.6M | $3.2M | $3.9M | $4.3M |
| Operating expenses | $3.2M | $3.2M | $3.3M | $3.1M | $3.0M | $3.1M | $3.6M | $4.1M |
| Net patient income | −$0.0M | −$0.3M | −$0.2M | −$0.5M | −$0.3M | $0.1M | $0.3M | $0.3M |
| Operating margin | −0.3% | −9.1% | −6.1% | −17.7% | −12.7% | 2.9% | 6.9% | 6.3% |
| Net income | −$0.0M | −$0.3M | −$0.2M | −$0.1M | $0.1M | $0.1M | $0.3M | $0.3M |
| Payroll costs | $1.9M | $1.9M | $1.9M | $1.8M | $1.5M | $1.7M | $2.0M | $2.4M |
| Payroll share of revenue | 59.6% | 64.0% | 61.4% | 67.6% | 57.3% | 54.2% | 52.9% | 54.8% |
| Beds | 58 | 58 | 58 | 58 | 58 | 58 | 58 | 58 |
| Gross revenue | $3.7M | $3.3M | $3.3M | $2.7M | $2.7M | $3.6M | $4.0M | $4.9M |
| Salaries | $1.5M | $1.6M | $1.6M | $1.5M | $1.3M | $1.4M | $1.7M | $1.9M |
| Wage-related costs | $0.4M | $0.3M | $0.3M | $0.3M | $0.2M | $0.3M | $0.3M | $0.4M |
| Contract labor | $0.2M | $0.2M | $0.2M | $0.2M | $0.3M | $0.2M | $0.2M | $0.2M |
| Other operating costs | $1.3M | $1.3M | $1.4M | $1.3M | $1.5M | $1.4M | $1.5M | $1.7M |
| Net patient revenue per day | $210 | $203 | $220 | $235 | $274 | $322 | $337 | $333 |
| Cost per day | $211 | $222 | $233 | $276 | $309 | $313 | $314 | $312 |
| Average length of stay | 235.5 days | 226.8 days | 290.8 days | 188.5 days | 191.3 days | 154.0 days | 76.1 days | 131.5 days |
Showing 2024–2022 · scroll sideways for 5 earlier years
Who this home usually serves
Residents split by who pays for their care: Medicare, Medicaid, or private pay and other sources.
Over a year: CMS SNF Cost Report, FY2024
Snapshot: CMS Long-Term Care Facility Characteristics (quarterly), Sep 2026
Arriving
145 admissions · FY2024
Residents admitted during the year.
Medicare
71 · 49%
Medicaid
53 · 37%
Private pay & other
21 · 14%
Resident snapshot
39 residents · Sep 2026
Residents counted on the date of the latest CMS report, which updates quarterly.
Medicare
6 · 15%
Medicaid
25 · 64%
Private pay & other
8 · 21%
Leaving
99 discharges · FY2024
Residents discharged during the year.
Medicare
28 · 28%
Medicaid
52 · 53%
Private pay & other
19 · 19%
Mostly short-term rehab stays
Most residents typically stay for a few weeks or months before returning home or moving on.
Places of interest near Oakbrook Health and Rehabilitation
 0.0 miles from city center
Estimated distance in miles from Thorp's city center to Oakbrook Health and Rehabilitation's address, calculated via Google Maps.
Calculate Travel Distance to Oakbrook Health and Rehabilitation
Add your location
Compare Nursing Homes around the area
Info below is compiled from CMS reports & the WI Dept. of Health Services (DHS), senior community websites & trusted data sources such as Walk Score & BBB.
Communities are listed from highest-ranked to lowest-ranked based on our methodology.
Official facility name used in federal/state reporting (may differ slightly from the marketing name).
|
Care Types in This Table
AL (Assisted Living):
Housing with help for daily activities like bathing, dressing, and medication, without 24-hour skilled nursing.
NH (Nursing Home):
24/7 skilled nursing care for residents with complex, ongoing medical needs.
SNF (Skilled Nursing Facility):
Round-the-clock nursing care, often for recovery after surgery, injury, or illness.
MC (Memory Care):
Secured, specialized care for people living with Alzheimer's or dementia.
RC (Respite Care):
Short-term temporary care that gives family caregivers a break.
IL (Independent Living):
Community living with dining, activities, and transportation for active seniors who need little personal care.
HOS (Hospice Care):
Comfort-focused care for those with a terminal illness, prioritizing quality of life over treatment.
PC (Palliative Care):
Comfort-focused care for serious illness at any stage, including alongside curative treatment.
|
City and state of the facility. Used for mapping and state-average comparisons.
|
Estimated monthly cost range for the facility.
|
Licensed bed capacity (maximum allowed). Not the same as how many beds are currently filled.
|
Better Business Bureau grade for the operating company. Reflects complaint handling and business practices, not clinical care quality.
|
Third-party neighborhood walkability score (0–100). Convenience/context metric, not a healthcare quality measure.
|
Housing or bed configuration options (e.g. studio, shared), often from facility-reported amenities and licensing details.
|
|---|---|---|---|---|---|---|---|
| Woodside Lutheran Home | NH AL MC RC SNF | Green Bay | - | 118
Facility
118
WI AVG
78
Rank
#29 / 197 | - |
67
Facility
67
WI AVG
48
Rank
#47 / 191 | - |
| Harbor Haven Health & Rehabilitation | NH HOS MC PC SNF | Fond Du Lac | - | 85
Facility
85
WI AVG
78
Rank
#81 / 197 | - |
57
Facility
57
WI AVG
48
Rank
#69 / 191 | Private / Semi-Private Rooms |
| Badger Prairie Health Care Center | NH SNF | Verona | - | 120
Facility
120
WI AVG
78
Rank
#23 / 197 | - |
31
Facility
31
WI AVG
48
Rank
#139 / 191 | - |
| Morrow Memorial Home | NH AL IL MC SNF | Sparta | - | 80
Facility
80
WI AVG
78
Rank
#91 / 197 | A+ |
68
Facility
68
WI AVG
48
Rank
#42 / 191 | - |
| Oakbrook Health and Rehabilitation | NH SNF | Thorp | - | 58
Facility
58
WI AVG
78
Rank
#111 / 197 | - |
60
Facility
60
WI AVG
48
Rank
#63 / 191 | - |
Rank badges are statewide and care-type specific: each nursing home is ranked against every other WI nursing home we track that reports that metric, not just the 5 on this page. See how we rank facilities
Know before you visit
Frequently Asked Questions about Oakbrook Health and Rehabilitation
Quick answers from public records and the community's own listing.01 Who is the owner of Oakbrook Health and Rehabilitation?

Oakbrook Health and Rehabilitation is legally operated by Thorp Nursing Home Inc, and administered by Tracy Schultze.
02 Is Oakbrook Health and Rehabilitation in a walkable area?
Oakbrook Health and Rehabilitation has a walk score of 60. Somewhat walkable. Some errands can be accomplished on foot, with a mix of nearby amenities.
03 What is the occupancy rate at Oakbrook Health and Rehabilitation?
Oakbrook Health and Rehabilitation's occupancy is 58.3%.
04 Are pets allowed at Oakbrook Health and Rehabilitation?
No, Oakbrook Health and Rehabilitation has a no-pet policy.
05 Does Oakbrook Health and Rehabilitation operate as a for-profit or non-profit?
Oakbrook Health and Rehabilitation is registered as a for-profit in WI.
06 Who is the administrator of Oakbrook Health and Rehabilitation?
Tracy Schultze is the administrator of Oakbrook Health and Rehabilitation.
07 What is the overall rating for Oakbrook Health and Rehabilitation?
Oakbrook Health and Rehabilitation received a 2-star overall rating from the CMS (Centers for Medicare and Medicaid Services). This score combines results from staffing levels, quality measures, and health inspections.


Updated on