Oakwood Care Center
Nursing Home, Hospice Care, Memory Care & Skilled Nursing · Middle River, MD
CMS overall rating Info CMS (the Centers for Medicare & Medicaid Services) is the federal agency that rates nursing home quality. Its Overall Rating runs from 1 to 5 stars, combining health inspections, staffing, and quality measures, with inspections weighted most heavily.

Oakwood Care Center

Nursing Home, Hospice Care, Memory Care & Skilled Nursing · Middle River, MD
CMS overall rating Info CMS (the Centers for Medicare & Medicaid Services) is the federal agency that rates nursing home quality. Its Overall Rating runs from 1 to 5 stars, combining health inspections, staffing, and quality measures, with inspections weighted most heavily.
Calculator: See prices in your area
Oakwood Care Center accepts Medicare, Medicaid, and private pay.

Overview of Oakwood Care Center

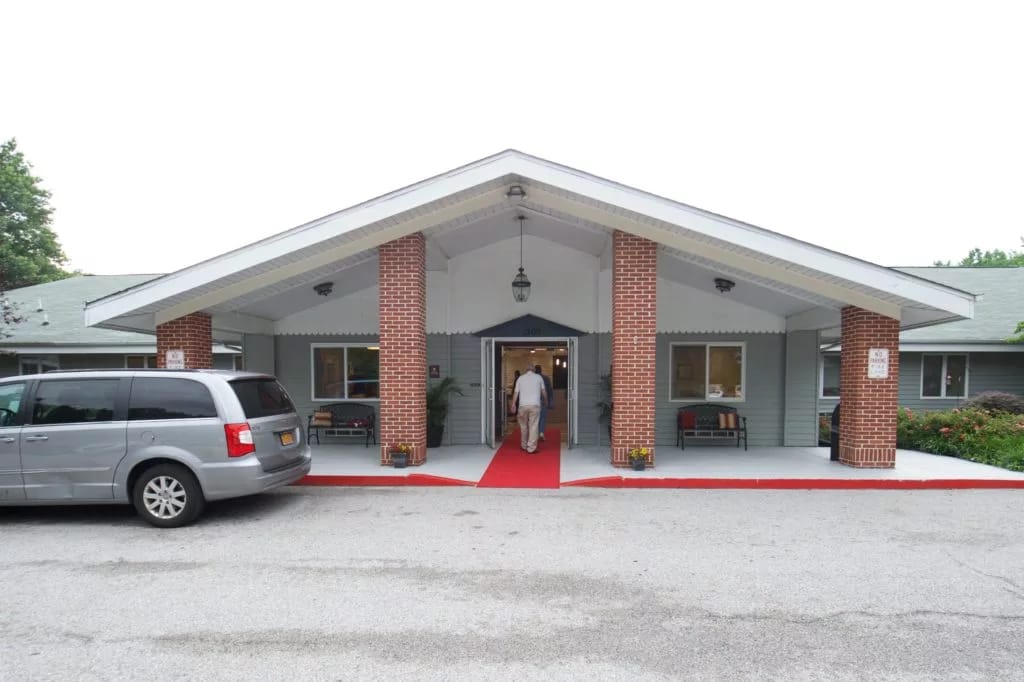
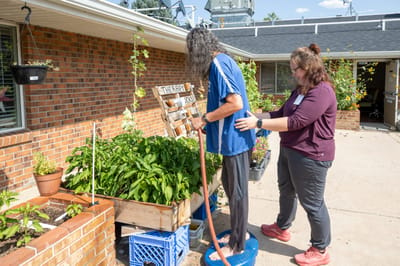
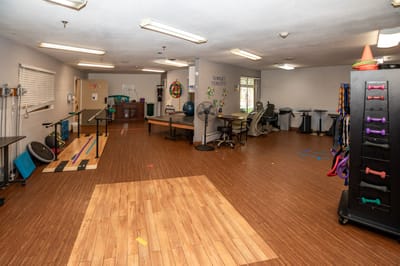
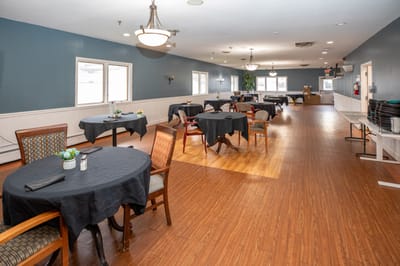
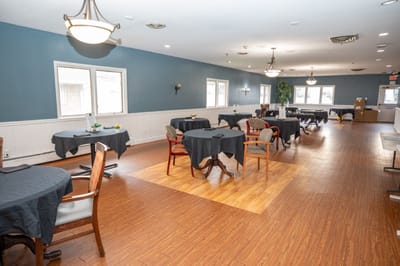
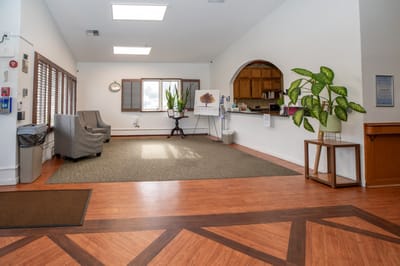
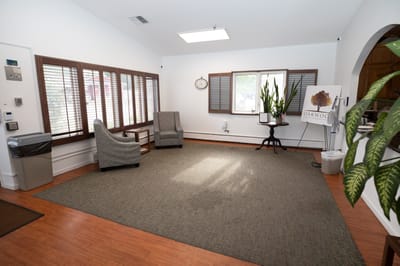
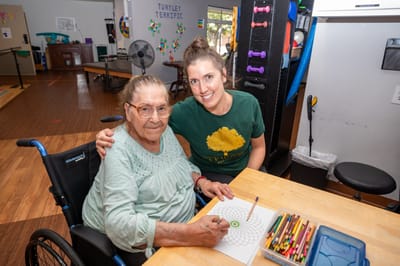
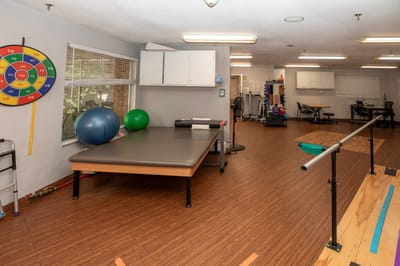
Oakwood Care Center excels in delivering post-acute rehabilitation and nursing to its residents as they deserve an exceptional level of service. The health staff strives to promote a fast recovery so residents could be back with their families as soon as possible. They boast their Peak Rehab program that successfully cares for even challenging medical conditions. Oakwood Care Center strives to enhance the holistic wellness of each resident. 
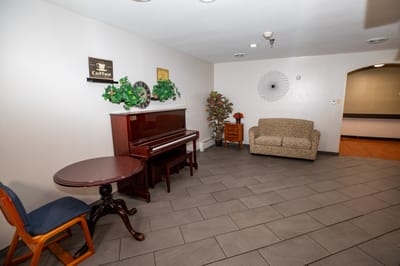
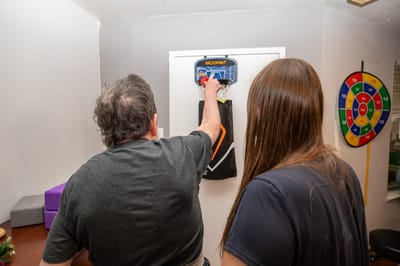
Aside from its exclusive Peak Rehab program, they inclusively offer sign language and oral interpreters for the deaf. Other services that they provide include 24/7 skilled nursing for wound care, long-term and short-term care, 24/7 supervision, a list of recreational and social activities to keep residents stimulated and active.

Quality ratings

Measured by Centers for Medicare & Medicaid Services (CMS)

Overall rating Info The Overall CMS Rating combines results from health inspections, staffing levels and quality measures. Health inspections carry the most weight. Staffing and quality scores can increase or decrease the final rating based on performance compared to state and national standards.
▼ 34.2% Below MD avg. ▼ 34.2% Below MD avg.MD average: 3.0Click the badge to see the full State ranking.Click here to see the full State ranking.
Health Inspection Info Based on the results of the facility's three most recent standard inspections and any complaint investigations. CMS reviews the number, scope, and severity of deficiencies, with more recent findings weighted more heavily.
▼ 29.0% Below MD avg. ▼ 29.0% Below MD avg.MD average: 2.8Click the badge to see the full State ranking.Click here to see the full State ranking.
Staffing Info Measures average nursing staff hours per resident per day, including Registered Nurses (RNs) and total nursing staff. Ratings are adjusted based on the level of care residents require and are compared to state and national benchmarks.
▼ 67.2% Below MD avg. ▼ 67.2% Below MD avg.MD average: 3.0Click the badge to see the full State ranking.Click here to see the full State ranking.
Quality Measures Info Based on clinical and physical health indicators reported to CMS, such as hospital readmissions, falls, pressure ulcers, and improvements in mobility. These measures reflect how well residents' health needs are being managed.
▲ 35.3% Above MD avg. ▲ 35.3% Above MD avg.MD average: 3.7Click the badge to see the full State ranking.Click here to see the full State ranking.

Staffing hours breakdown

Info Daily nursing hours per resident by staff type, reported to CMS. Higher is generally better — compare this facility to state and national averages to see where staffing stands.

Hours per resident per day — compared to Maryland state averages

Total nursing care / resident Info Total adjusted nursing hours per resident per day, combining RN, LPN, and aide time. CMS adjusts this for case-mix so facilities can be fairly compared.
3h 43m per day
This facility Maryland avg (3h 46m per day)
vs Maryland avg
-2%

1 of 1 metrics below state avg

Staff typeHours / Day / Residentvs state avg
Weekend Total Nursing Info Combined nursing hours (RN + LPN + Nurse Aide) per resident per day on weekends. Staffing often drops on weekends — this figure reveals whether the facility maintains adequate coverage outside of weekday hours. 3h 19m per day ▼ 6% State avg: 3h 31m per day · National avg: 3h 27m per day

Capacity and availability

This home usually has limited availability

Higher occupancy than the Maryland average: 82.4%
Occupancy rate
86.4%
Avg. Length of Stay Info Average number of days residents stay at this facility, based on CMS cost report data. Shorter stays often reflect post-acute or rehab care; longer stays reflect long-term care.
113 days
Bed community size
130-bed community Rank #66 / 697Bed count — State benchmarkedThis home is ranked 66th out of 697 homes in Maryland. Shows this facility's certified or reported bed count compared to other Maryland facilities. Larger communities may offer more amenities, programs, and on-site services for residents and families.Rankings are based only on facilities in Maryland that report data for that category. Facilities without available data are excluded from the ranking.Click the rank badge to see the full State ranking.Click here to see the full State ranking.
A larger shared setting that may offer more common spaces and organized community services.
Walk Score
Walk Score: 48 / 100 Rank #448 / 985Walk Score — State benchmarkedThis home is ranked 448th out of 985 homes in Maryland. Shows how walkable this facility's neighborhood is compared to the average Walk Score across Maryland facilities. Higher scores benefit residents, families, and staff.Rankings are based only on facilities in Maryland that report data for that category. Facilities without available data are excluded from the ranking.Click the rank badge to see the full State ranking.Click here to see the full State ranking.
Somewhat walkable. A few nearby services may be reachable on foot, but most trips require transportation.

Payment & Insurance

1 service
Accept Medicare

Therapy & Rehabilitation

2 services
Rehabilitation Services
Short-Term Rehab

Staffing & Medical

1 service
Doctor on Staff

Amenities & Lifestyle

170 Beds
Beautiful Spacious Rooms In Either Private Or Semi-Private Settings
Housekeeping And Laundry Services
Beautifully Landscaped Grounds
Activities
Wellness Programin-house therapy program
Specific ProgramsMore Information, In-House Therapy, Stay Active, Videos & Photos, MenuMenu

Contact Oakwood Care Center

Staffing Data

Reporting period: October 1 – December 31, 2025 (Q4 2025). Source: CMS Payroll-Based Journal report.

Total staff 255
Employees 161
Contractors 94
Staff to resident ratio 2.22 : 1
22% more staff per resident than Maryland average
Maryland average ratio: 1.81 : 1 Maryland average ratio: 1.81 : 1See full Maryland ranking
Avg staff/day 65
Average shift 7.9 hours
0% compared with Maryland average
Maryland average: 8 hours Maryland average shift: 8 hoursSee full Maryland ranking
Total staff hours (quarter) 47,340

Nursing staff breakdown

Q4 2025 · Oct 1 – Dec 31 More info This data comes from the CMS Payroll-Based Journal report covering October 1 – December 31, 2025.
Registered Nurse

Manages medical care and health needs.

RN Staff Info 34 total: 18 full-time employees and 16 contractors. 34
Average shift length Info Average shift length. Calculated as total hours divided by days worked and average staff per day. 8.2 hours
Licensed Practical Nurse

Assists with medical care and medications.

LPN Staff Info 25 total: 22 full-time employees and 3 contractors. 25
Average shift length Info Average shift length. Calculated as total hours divided by days worked and average staff per day. 8.9 hours
Certified Nursing Assistant

Helps with daily care and mobility.

CNA Staff Info 131 total: 56 full-time employees and 75 contractors. 131
Average shift length Info Average shift length. Calculated as total hours divided by days worked and average staff per day. 7.9 hours

Contractor staffing

Q4 2025 · Oct 1 – Dec 31 More info This data comes from the CMS Payroll-Based Journal report covering October 1 – December 31, 2025.

Total hours from contractors

8%

3,803 contractor hours this quarter

Certified Nursing Assistant: 75 Registered Nurse: 16 Licensed Practical Nurse: 3

Staff by category

Q4 2025 · Oct 1 – Dec 31 More info This data comes from the CMS Payroll-Based Journal report covering October 1 – December 31, 2025.
Certified Nursing Assistant567513118,83292100%7.9
Licensed Practical Nurse223257,63392100%8.9
Physical Therapist140144,68892100%7
Registered Nurse1816343,83792100%8.2
RN Director of Nursing100102,8658795%8.5
Medication Aide/Technician7072,22092100%7.7
Speech Language Pathologist3031,3927177%7.6
Clinical Nurse Specialist8081,2678693%8.6
Other Dietary Services Staff7071,0759098%7.3
Physical Therapy Assistant4047067986%5.9
Physical Therapy Aide2025695964%7.9
Mental Health Service Worker1015066571%7.8
Administrator1015046368%8
Dietitian1014886166%8
Qualified Social Worker2023496267%4.9
Nurse Practitioner1012723437%8
Respiratory Therapy Technician4041373740%3.7
131 Certified Nursing Assistant
% of Days 100%
25 Licensed Practical Nurse
% of Days 100%
14 Physical Therapist
% of Days 100%
34 Registered Nurse
% of Days 100%
10 RN Director of Nursing
% of Days 95%
7 Medication Aide/Technician
% of Days 100%
3 Speech Language Pathologist
% of Days 77%
8 Clinical Nurse Specialist
% of Days 93%
7 Other Dietary Services Staff
% of Days 98%
4 Physical Therapy Assistant
% of Days 86%
2 Physical Therapy Aide
% of Days 64%
1 Mental Health Service Worker
% of Days 71%
1 Administrator
% of Days 68%
1 Dietitian
% of Days 66%
2 Qualified Social Worker
% of Days 67%
1 Nurse Practitioner
% of Days 37%
4 Respiratory Therapy Technician
% of Days 40%

Penalties and fines

Includes penalties issued in 2024

Federal penalties imposed by CMS for regulatory violations, including civil money penalties (fines) and denials of payment for new Medicare/Medicaid admissions.

Source: CMS Penalties Database (Data as of Jan 2026)

Total fines amount $13K
78% lower than Maryland average

Maryland average: $61K

Number of fines 1
33% fewer fines than Maryland average

Maryland average: 1.5

Payment Denials Info Serious action where Medicare and/or Medicaid temporarily stops payments for new residents until issues are fixed. 0
100% fewer payment denials than Maryland average

Maryland average: 0.1

Fines amount comparison
This facility $13K
Maryland average $61K
Penalty History

Penalties are imposed by CMS for violations of federal nursing home regulations.

1 penalty in the past 3 years

Oct 21, 2024 · $13K

Civil Money Penalty Info Fines imposed for noncompliance, which can be assessed per day or per instance of violation. Oct 21, 2024
$13K

Last updated: Jan 2026

Quality of care over time

These measures show how residents usually do over time at this home, based on health outcomes and preventive care.

High-risk clinical events score Info A composite score based on pressure ulcers, falls with injury, weight loss, walking ability decline, and activities of daily living decline. 6.2
52% better than Maryland average

Maryland average: 12.9

Functional decline score Info A composite score based on activities of daily living decline, walking ability decline, and incontinence. 14.4
44% better than Maryland average

Maryland average: 25.7

Long-stay resident measures
Need for Help with Daily Activities Increased Info Percent of long-stay residents whose need for help with daily activities has increased 9.1%
62% better than Maryland average

Maryland average: 23.7%

Walking Ability Worsened Info Percent of long-stay residents whose ability to move independently worsened 9.9%
64% better than Maryland average

Maryland average: 27.7%

Low Risk Residents with Bowel/Bladder Incontinence Info Percent of low risk long-stay residents who lose control of their bowels or bladder 24.3%
6% better than Maryland average

Maryland average: 25.9%

Falls with Major Injury Info Percent of long-stay residents experiencing one or more falls with major injury 4.6%
102% worse than Maryland average

Maryland average: 2.3%

High Risk Residents with Pressure Ulcers Info Percent of long-stay high risk residents with pressure ulcers 3.6%
44% better than Maryland average

Maryland average: 6.5%

Urinary Tract Infection Info Percent of long-stay residents with a urinary tract infection 0.3%
83% better than Maryland average

Maryland average: 1.6%

Lost Too Much Weight Info Percent of long-stay residents who lose too much weight 4.0%
32% better than Maryland average

Maryland average: 5.8%

Depressive Symptoms Info Percent of long-stay residents who have depressive symptoms 20.2%
In line with Maryland average

Maryland average: 20.2%

Antipsychotic Use Info Percent of long-stay residents who received an antipsychotic medication 20.2%
56% worse than Maryland average

Maryland average: 12.9%

Pneumococcal Vaccine Info Percent of long-stay residents assessed and appropriately given the pneumococcal vaccine 98.2%
7% better than Maryland average

Maryland average: 92.0%

Influenza Vaccine Info Percent of long-stay residents assessed and appropriately given the seasonal influenza vaccine 99.0%
In line with Maryland average

Maryland average: 96.6%

Short-stay resident measures
Pneumococcal Vaccine Info Percent of short-stay residents assessed and appropriately given the pneumococcal vaccine 98.5%
26% better than Maryland average

Maryland average: 78.4%

Antipsychotic medication increase Info Percent of short-stay residents who newly received an antipsychotic medication 0.0%
100% better than Maryland average

Maryland average: 1.4%

Influenza Vaccine Info Percent of short-stay residents assessed and appropriately given the seasonal influenza vaccine 97.3%
21% better than Maryland average

Maryland average: 80.6%

Breakdown by payment type

Medicare

49% of new residents, usually for short-term rehab.

Typical stay 1 months

Private pay

32% of new residents, often for short stays.

Typical stay 1 - 2 months

Medicaid

19% of new residents, often for long-term daily care.

Typical stay 1 years

Facility Characteristics

Source: CMS Long-Term Care Facility Characteristics (Data as of Jan 2026)

Total residents 115
Medicare
115
100% of residents
Programs & Services
Residents Group

Residents meet regularly to discuss policies, care quality, and activities

Active Resident Council

Organized group of residents that meets regularly to discuss facility policies, quality of life, and activities.

Finances and operations

Based on CMS SNF Cost Report for fiscal year ending in 06/2024.

For-profit
Operated by a single business entity.
Net patient revenue Info Net patient revenue — what the home actually collects for resident care, after contractual allowances, bad debt and discounts are subtracted from its gross charges (CMS cost report, Worksheet G-3). It covers resident care only; money the home earns from other sources is shown separately as "Other income."
$15.2M
Net patient income Info Net patient income: net patient revenue minus the home's total operating expenses. A positive figure means it earns more from resident care than it spends to deliver it; a negative figure means the opposite. It excludes non-operating "other income."
-$1.1M
For-profit Operated by a single business entity.
Net patient revenue Info Net patient revenue — what the home actually collects for resident care, after contractual allowances, bad debt and discounts are subtracted from its gross charges (CMS cost report, Worksheet G-3). It covers resident care only; money the home earns from other sources is shown separately as "Other income."
$15.2M
Net patient income Info Net patient income: net patient revenue minus the home's total operating expenses. A positive figure means it earns more from resident care than it spends to deliver it; a negative figure means the opposite. It excludes non-operating "other income."
-$1.1M
Other income Info Money the home earns outside of resident care — such as investments, grants, rentals and other non-operating sources (CMS cost report, Worksheet G-3). It is tracked separately from net patient revenue: it is not part of that figure, and it is not included in net patient income.
$1.2K
Payroll costs Info Staff salaries plus wage-related costs — benefits such as payroll taxes, health insurance and retirement — from the home's own accounting records (CMS cost report, Worksheet A). Contract or agency labor is counted separately, under other operating costs.
$8.0M 53% of net patient revenue Info Payroll as a share of revenue: staff salaries and wage-related benefits divided by net patient revenue. A higher figure means more of each revenue dollar goes to staff pay.
Other operating costs Info Everything it costs to run the home apart from payroll — food, utilities, supplies, maintenance, contract labor and administration. Calculated as total operating expense minus payroll (staff salaries and wage-related benefits).
$8.2M
Total costs Info The home's total operating expense for the year — all the costs of running it, salaries included (CMS cost report, Worksheet G-3).
$16.2M

Who this home usually serves

TYPE OF STAY

Mostly short-term rehab stays

Most residents typically stay for a few weeks or months before returning home or moving on.

New residents most often arrive under Medicare (49% of admissions), and a typical Medicare stay runs around 1 months.

Admissions
400 total

Coverage residents most often arrive under.

Medicare 49%
Private pay 32%
Medicaid 19%
Discharges
364 total

Coverage residents most often leave under.

Medicare 35%
Private pay 35%
Medicaid 31%

Places of interest near Oakwood Care Center

Address 0.6 miles from city center Info Estimated distance in miles from Middle River's city center to Oakwood Care Center's address, calculated via Google Maps.

Calculate Travel Distance to Oakwood Care Center

Add your location

Address

Compare Nursing Homes around Baltimore

The information below is reported by the Maryland Department of Health, Office of Health Care Quality.

5 facilities compared · CMS & MD Dept. of Health data

Advanced Rehab at Autumn Lake Healthcare
NH
HOS
RC
SNF
Lutherville (Rockland)
110
Facility 110
MD AVG 43
Rank #96 / 697
68.8% -16%4.24 -42%+12%$8.0k
40
Facility 40
MD AVG 49.9
Rank #72 / 149
10.0176-
10
Facility 10
MD AVG 43
Rank #837 / 985
515 Brightfield Road Holdco LLC$11.7MFiscal year ending 12/2023$5.5MFiscal year ending 12/202347.2%Fiscal year ending 12/2023215226
Autumn Lake Healthcare at Perring Parkway
NH
RC
SNF
Baltimore (Wentworth Road)
125
Facility 125
MD AVG 43
Rank #74 / 697
83.3% +1%3.36 -32%-11%$32.4k
49
Facility 49
MD AVG 49.9
Rank #96 / 149
16.3191-
65
Facility 65
MD AVG 43
Rank #251 / 985
1801 Wentworth Holdco LLC$13.6MFiscal year ending 12/2023$1.1MFiscal year ending 12/20238%Fiscal year ending 12/2023215081
Autumn Lake Healthcare Post Acute Care Center
NH
MC
PC
RC
SNF
Baltimore (Frankford)
225
Facility 225
MD AVG 43
Rank #7 / 697
92.2% +12%3.48 -39%-8%$0
33
Facility 33
MD AVG 49.9
Rank #47 / 149
8.31197-
68
Facility 68
MD AVG 43
Rank #214 / 985
Pacc Holdco LLC$33.5MFiscal year ending 12/2023$4.2MFiscal year ending 12/202312.6%Fiscal year ending 12/2023215330
Autumn Lake Healthcare at Parkville
NH
RC
SNF
Baltimore (Baynesville)
135
Facility 135
MD AVG 43
Rank #61 / 697
79.7% -3%3.02 -51%-20%$0
47
Facility 47
MD AVG 49.9
Rank #91 / 149
9.43119C
69
Facility 69
MD AVG 43
Rank #199 / 985
8710 Emge Holdco LLC$16.5MFiscal year ending 12/2023$1.4MFiscal year ending 12/20238.4%Fiscal year ending 12/2023215129
Oakwood Care Center
NH
HOS
MC
SNF
Middle River
130
Facility 130
MD AVG 43
Rank #66 / 697
86.4% +5%3.72 -3%-2%$13.3k7218.02114-
48
Facility 48
MD AVG 43
Rank #448 / 985
Oakwood Holdco LLC$15.2MFiscal year ending 06/2024$8.0MFiscal year ending 06/202453%Fiscal year ending 06/2024215181

Financial Assistance for
Nursing Home in Maryland

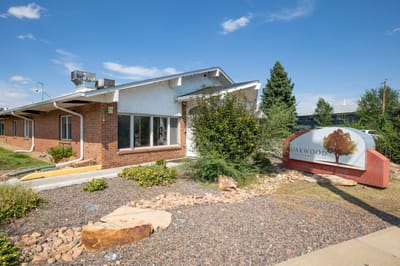
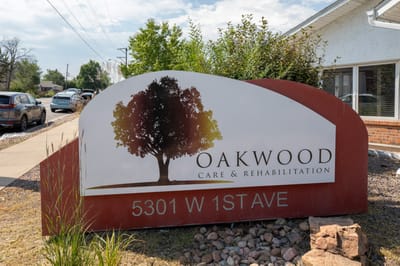
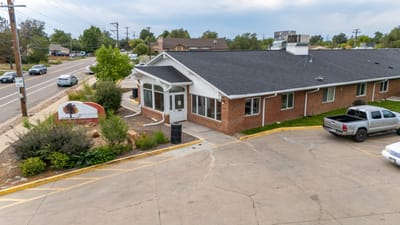
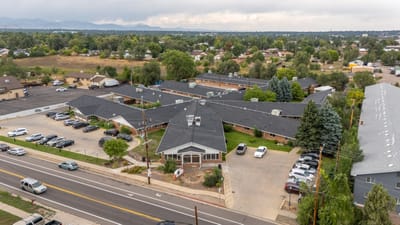
Oakwood Care Center is located in Middle River, Maryland.
Here are the financial assistance programs available to residents in Maryland.

Get Financial aid guidance

Community Options Waiver

Maryland Medicaid Community Options Waiver

Age 65+ or disabled
General Maryland resident, Medicaid- eligible, nursing home-level care need.
Income Limits (2025) ~$2,829/month 300% FBR, individual
Asset Limits $2,000 (individual), $3,000 (couple) (excludes home, car).
MD

High urban demand; rural outreach efforts.

Benefits
Personal care (5-7 hours/day, e.g., bathing, dressing) Respite care (up to 240 hours/year) Adult day care ($70/day) Home modifications ($1,500 avg.)

Senior Care Program

Maryland Senior Care

Age 65+
General Maryland resident, at risk of nursing home placement.
Income Limits ~$2,000/month individual, varies by county
Asset Limits $11,000 individual
MD

Limited funding; waitlists common in high-demand areas.

Benefits
In-home care (3-5 hours/week) Respite care (up to 10 days/year) Meals (~$6/meal) Transportation (~5 trips/month) Case management

Maryland Nursing Home Medicaid

Maryland Medical Assistance (Medicaid) Nursing Home Program

Age 65+
General Maryland resident, Medicaid-eligible, requires nursing home-level care.
Income Limits (2025) $943/month (individual); most income applied to care costs.
Asset Limits $2,500 (individual), $3,000 (couple); spousal protections up to $155,356.
MD

Home equity limit $636,000; estate recovery applies post-55.

Benefits
24/7 nursing care Meals Therapy Medications (unlimited per medical need)

Senior Assisted Living Subsidy Program

Maryland Senior Assisted Living Group Home Subsidy

Age 62+
General Maryland resident, in or moving to approved assisted living, low/moderate income.
Income Limits (2025) ~$34,000/year individual, varies by county
Asset Limits Not strict; prioritizes low-income.
MD

Not available statewide; facility must be licensed by MDH.

Benefits
Personal care Meals 24-hour supervision (up to $1,500/month subsidy typical)

Veterans Aid and Attendance (A&A) Benefit

Maryland VA Aid and Attendance

Age
General Wartime veteran/spouse, age 65+ or disabled, needs ADL help, Maryland resident.
Income Limits (2025) Net income minus medical expenses < $1,984/month individual with A&A
Asset Limits $155,356 net worth limit
MD

High veteran population in suburban/rural areas.

Benefits
Cash benefit ($1,478-$2,471/month, varies by status) for care costs

Senior Prescription Drug Assistance Program (SPDAP)

Maryland Senior Prescription Drug Assistance Program

Age 65+
General Maryland resident (6+ months), Medicare Part D enrolled.
Income Limits (2025) $48,560/year individual, 300% FPL
Asset Limits None specified.
MD

Supplements Medicare Part D; annual enrollment required.

Benefits
Up to $40/month premium subsidy Reducing drug costs

Medicare Savings Programs (MSP)

Maryland Medicare Savings Programs

Age 65+
General Maryland resident, Medicare Part A/B enrollee.
Income Limits (2025) $2,014/month (QMB), $2,706/month (SLMB/QI, individual).
Asset Limits $9,090 (individual), $13,630 (couple).
MD

Includes QMB, SLMB, QI categories.

Benefits
Covers premiums (up to $174.70/month Part B) Co-pays Deductibles

Community Personal Assistance Services (CPAS)

Maryland Medicaid Community Personal Assistance Services

Age 65+
General Maryland resident, Medicaid-eligible, needs ADL assistance.
Income Limits (2025) $943/month (individual); spend-down available.
Asset Limits $2,500 (individual), $3,000 (couple).
MD

Consumer-directed option allows hiring family caregivers.

Benefits
Personal care (hours vary, typically 20-30/week) Chores Nurse supervision

Frequently Asked Questions about Oakwood Care Center

Is Oakwood Care Center in a walkable area?

Oakwood Care Center has a walk score of 48. Somewhat walkable. A few nearby services may be reachable on foot, but most trips require transportation.

What is the occupancy rate at Oakwood Care Center?

Oakwood Care Center's occupancy is 86.4%.
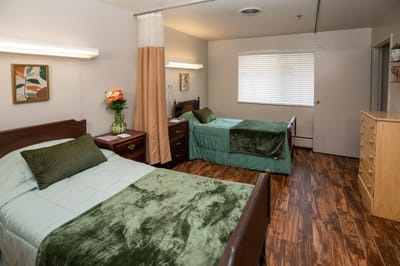
Does Oakwood Care Center operate as a for-profit or non-profit?

Oakwood Care Center is registered as a for-profit.

Are there photos of Oakwood Care Center?

Yes — there are 21 photos of Oakwood Care Center in the photo gallery on this page.

What is the address of Oakwood Care Center?

Oakwood Care Center is located at 1300 Windlass Dr, Middle River, Md 21220, United States1300 Windlass Dr, Middle River, MD 21220.

What is the phone number of Oakwood Care Center?

(410) 687-1383 will put you in contact with the team at Oakwood Care Center.

Is Oakwood Care Center Medicare or Medicaid certified?

Yes — Oakwood Care Center is a CMS-certified provider of Medicare and Medicaid.

Guides for Better Senior Living

Care Cost Calculator: See Prices in Your Area

Nursing Home Data Explorer

Don’t Wait Too Long: 7 Red Flag Signs Your Parent Needs Assisted Living Now

The True Cost of Assisted Living in 2025 – And How Families Are Paying For It

Understanding Senior Living Costs: Pricing Models, Discounts & Financial Assistance