Paramount Health and Rehabilitation
Nursing Home, Assisted Living, Independent Living & Memory Care · Salt Lake City, UT
CMS overall rating Info CMS (the Centers for Medicare & Medicaid Services) is the federal agency that rates nursing home quality. Its Overall Rating runs from 1 to 5 stars, combining health inspections, staffing, and quality measures, with inspections weighted most heavily.

Paramount Health and Rehabilitation

Nursing Home, Assisted Living, Independent Living & Memory Care · Salt Lake City, UT
CMS overall rating Info CMS (the Centers for Medicare & Medicaid Services) is the federal agency that rates nursing home quality. Its Overall Rating runs from 1 to 5 stars, combining health inspections, staffing, and quality measures, with inspections weighted most heavily.
Calculator: See prices in your area
Paramount Health and Rehabilitation accepts Medicaid, Medicare, and private pay.

Overview of Paramount Health and Rehabilitation

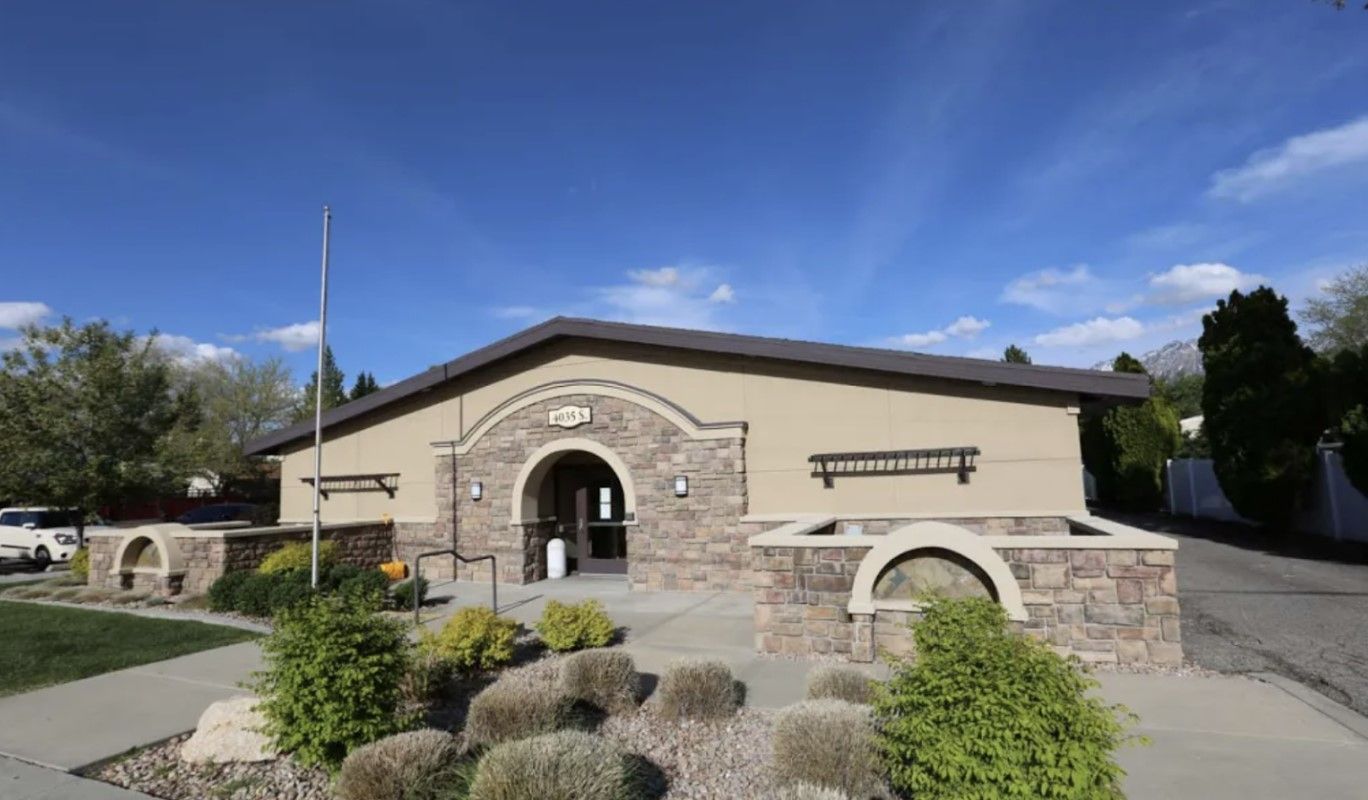
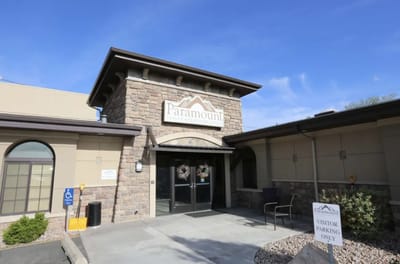
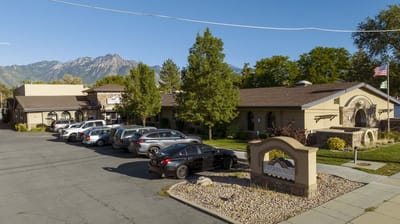
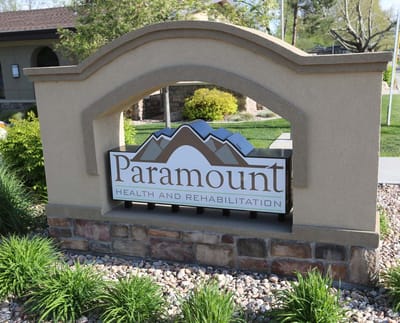
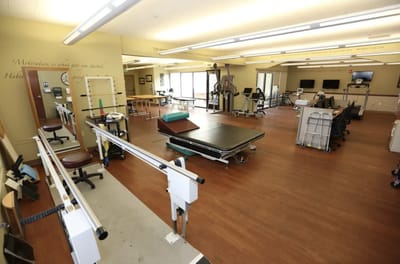
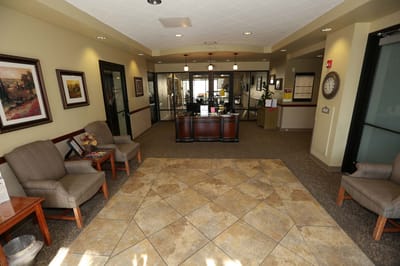
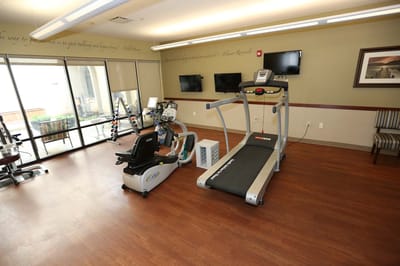
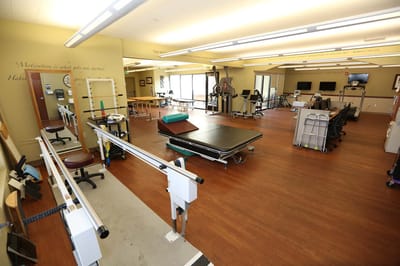
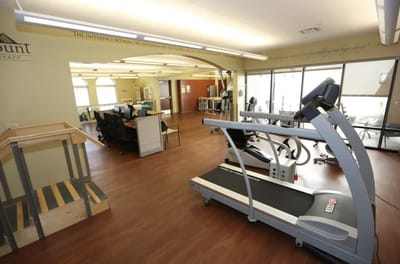
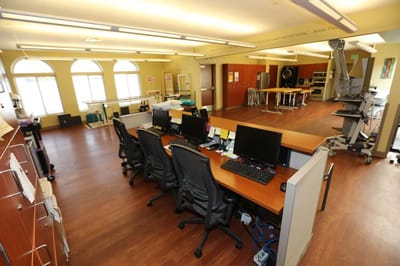
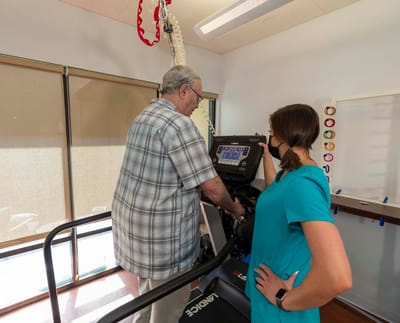
Overlooking the scenic South 500 East, Salt Lake City, UT is the blissful senior living community of Paramount Health and Rehabilitation that focuses on short-term rehabilitation and long-term care. The community boasts a team of dedicated and specially trained professionals who provide top-notch care and assistance to meet seniors’ special needs and aspirations. Moreover, certified therapists focus on various practices including wound care, lymphedema, pulmonary programs, and speech-language therapy, among others.

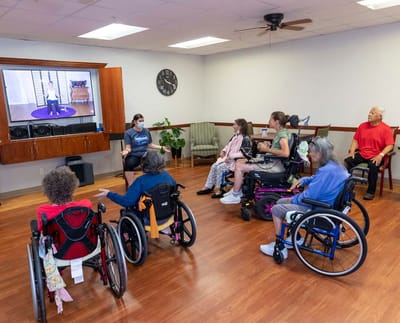
Promoting a bright and friendly environment, the community prepares a well-curated calendar of activities and engaging programs to keep seniors active and happy. With a holistic approach to care, residents can ease their worries and live their lives to the fullest. Paramount Health and Rehabilitation is a safe place for seniors to experience the finest retirement with its incredible spaces and excellent services.

Quality ratings

Measured by Centers for Medicare & Medicaid Services (CMS)

Overall rating Info The Overall CMS Rating combines results from health inspections, staffing levels and quality measures. Health inspections carry the most weight. Staffing and quality scores can increase or decrease the final rating based on performance compared to state and national standards.
▼ 41.0% Below UT avg. ▼ 41.0% Below UT avg.UT average: 3.4Click the badge to see the full State ranking.Click here to see the full State ranking.
Health Inspection Info Based on the results of the facility's three most recent standard inspections and any complaint investigations. CMS reviews the number, scope, and severity of deficiencies, with more recent findings weighted more heavily.
▼ 63.0% Below UT avg. ▼ 63.0% Below UT avg.UT average: 2.7Click the badge to see the full State ranking.Click here to see the full State ranking.
Staffing Info Measures average nursing staff hours per resident per day, including Registered Nurses (RNs) and total nursing staff. Ratings are adjusted based on the level of care residents require and are compared to state and national benchmarks.
▼ 69.0% Below UT avg. ▼ 69.0% Below UT avg.UT average: 3.2Click the badge to see the full State ranking.Click here to see the full State ranking.
Quality Measures Info Based on clinical and physical health indicators reported to CMS, such as hospital readmissions, falls, pressure ulcers, and improvements in mobility. These measures reflect how well residents' health needs are being managed.
▲ 13.9% Above UT avg. ▲ 13.9% Above UT avg.UT average: 4.4Click the badge to see the full State ranking.Click here to see the full State ranking.

Staffing hours breakdown

Info Daily nursing hours per resident by staff type, reported to CMS. Higher is generally better — compare this facility to state and national averages to see where staffing stands.

Hours per resident per day — compared to Utah state averages

Total nursing care / resident Info Total adjusted nursing hours per resident per day, combining RN, LPN, and aide time. CMS adjusts this for case-mix so facilities can be fairly compared.
3h 24m per day
This facility Utah avg (3h 46m per day)
vs Utah avg
-10%

6 of 6 metrics below state avg

Staff typeHours / Day / Residentvs state avg
Registered Nurse (RN) Info RNs hold the highest nursing license and can assess residents, interpret test results, and direct care plans. More RN hours per day often signals stronger clinical oversight and faster response to health changes. 47m per day ▼ 34% State avg: 1h 11m per day · National avg: 41m per day
LPN / LVN Info Licensed Practical Nurses (LPNs) or Licensed Vocational Nurses (LVNs) deliver routine hands-on care — medication administration, wound dressing, and monitoring vital signs. They work under RN supervision and make up a large share of daily bedside care. 18m per day ▼ 40% State avg: 30m per day · National avg: 52m per day
Nurse Aide Info Certified Nurse Aides (CNAs) provide the most direct day-to-day assistance: bathing, dressing, feeding, and mobility. Nurse aide hours are typically the largest staffing category and directly affect residents' quality of life. 2h 11m per day ▼ 8% State avg: 2h 22m per day · National avg: 2h 21m per day
Weekend Total Nursing Info Combined nursing hours (RN + LPN + Nurse Aide) per resident per day on weekends. Staffing often drops on weekends — this figure reveals whether the facility maintains adequate coverage outside of weekday hours. 2h 38m per day ▼ 25% State avg: 3h 31m per day · National avg: 3h 26m per day
Physical Therapist Info Hours per resident per day provided by licensed Physical Therapists (PTs) or PT Assistants. PT services help residents recover mobility after injury or illness and are especially important for post-acute (short-stay) rehabilitation. 5m per day ▼ 29% State avg: 7m per day · National avg: 4m per day
Weekend RN Info Registered nurse hours specifically on weekends. Facilities sometimes reduce RN presence on Saturdays and Sundays — a low weekend RN figure compared to weekday hours can indicate reduced clinical oversight when most administrative staff are absent. 36m per day ▼ 28% State avg: 50m per day · National avg: 29m per day

Capacity and availability

Avg. Length of Stay
93 days
Bed community size
99-bed community Rank #70 / 196Bed count — State benchmarkedThis home is ranked 70th out of 196 homes in Utah. Shows this facility's certified or reported bed count compared to other Utah facilities. Larger communities may offer more amenities, programs, and on-site services for residents and families.Click the rank badge to see the full State ranking.Click here to see the full State ranking.
A larger shared setting that may offer more common spaces and organized community services.
Years in operation
27 years in operation Rank #57 / 196Years in operation — State benchmarkedThis home is ranked 57th out of 196 homes in Utah. Shows how long this facility has been in operation compared to other Utah facilities. Longer operating histories may benefit residents, families, and staff.Click the rank badge to see the full State ranking.Click here to see the full State ranking.
A longer operating history, which may indicate experience navigating regulations and delivering ongoing care.
Walk Score
Walk Score: 47 / 100 Rank #150 / 280Walk Score — State benchmarkedThis home is ranked 150th out of 280 homes in Utah. Shows how walkable this facility's neighborhood is compared to the average Walk Score across Utah facilities. Higher scores benefit residents, families, and staff.Click the rank badge to see the full State ranking.Click here to see the full State ranking.
Somewhat walkable. A few nearby services may be reachable on foot, but most trips require transportation.

About this community

Occupancy

Occupancy rate
67%
Similar to the Utah average: 70.1%
Occupied beds
66 / 99
Average occupied beds in Utah homes 60 beds

License Details

Facility TypeNursing Care Facility
StatusActive
IssuanceSeptember 4, 1998
ExpirationMay 31, 2027
CountySalt Lake

Payment & Insurance

2 services
Accept Medicaid
Accept Medicare

Therapy & Rehabilitation

1 service
Rehabilitation Services

Amenities & Lifestyle

Specific ProgramsIn-house Therapy, Activities & Excursions, Church Services
Religious ServicesYes

Contact Paramount Health and Rehabilitation

Inspection History

In Utah, the Department of Health and Human Services, Health Facility Licensing conducts regular onsite inspections to ensure compliance with state and federal healthcare standards.

Inspection Scorecard Info This scorecard compares key inspection, citation, and complaint metrics at this facility against the Utah state average. Metrics rated ≥15% worse than average are highlighted in red; those ≥15% better are highlighted in green.

Overall vs. UT average 0 Worse No metrics in this bucket. 1 Better Metrics better than Utah average:
• Total inspections (67% below)

Inspections Info State inspections evaluate whether the facility meets health and safety standards.

This FacilityUT Averagevs. UT Avg
Total inspections Info Combined count of all routine and focused inspections. Excludes complaint investigations. 13 This facility has 67% fewer total inspections than a typical Utah nursing home (1 vs. UT avg 3).↓ 67% better

Penalties and fines

Federal penalties imposed by CMS for regulatory violations, including civil money penalties (fines) and denials of payment for new Medicare/Medicaid admissions.

Source: CMS Penalties Database

No penalties in the past 3 years

No civil money penalties or payment denials were reported in the last 3 years.

Quality of care over time

These measures show how residents usually do over time at this home, based on health outcomes and preventive care.

Short-stay resident measures
Significantly above average Info CMS star rating based on short-stay quality measure performance. 5 stars = much above average, 1 star = much below average.
Re-hospitalized after SNF stay Info Percentage of short-stay residents who were re-hospitalized after their nursing home admission. 20.0%
15% worse than Utah average

Utah average: 17.4%

Emergency department visits Info Percentage of short-stay residents who had an outpatient emergency department visit. 8.0%
32% better than Utah average

Utah average: 11.8%

Falls with major injury Info Percentage of SNF residents who experience falls with major injury during their stay. 0.0%
100% better than Utah average

Utah average: 0.8%

Ability to care for self at discharge Info Percentage of residents at or above expected ability to care for themselves at discharge. 65.4%
22% better than Utah average

Utah average: 53.7%

Successful return to home or community Info Rate of successful return to home or community from a skilled nursing facility. 56.3%
11% better than Utah average

Utah average: 50.6%

Breakdown by payment type

Medicare

16% of new residents, usually for short-term rehab.

Typical stay 21 days

Private pay

54% of new residents, often for short stays.

Typical stay 30 days

Medicaid

30% of new residents, often for long-term daily care.

Typical stay 7 - 8 months

Finances and operations

Based on the 2024 CMS SNF Cost Report.

Privately-owned community
Operated by a single business entity.
Home revenue
$8.9M
Profit
$1.1M
Privately-owned community Operated by a single business entity.
Home revenue
$8.9M
Profit
$1.1M
Payroll costs Info The portion of the home's budget spent on staff, including nurses, caregivers, and other employees who support care and operations.
$4.8M
54.5% of revenue
Other operating costs Info All remaining costs needed to run the home, such as food, utilities, building maintenance, supplies and administrative expenses.
$2.9M
Total costs $7.8M

What does this home offer?

Building type icon
Building type icon

Building Type: Single-story

Who this home usually serves

TYPE OF STAY

Mix of rehab and long-term care

This home supports both short-term rehab and long-term care, with residents staying for a wide range of durations.

Most new residents arrive under private pay (54% of admissions), and a typical private pay stay runs around 30 days.

Admissions
233 total

Coverage residents most often arrive under.

Medicare 16%
Private pay 54%
Medicaid 30%
Discharges
223 total

Coverage residents most often leave under.

Medicare 13%
Private pay 57%
Medicaid 30%

Places of interest near Paramount Health and Rehabilitation

Address 0.8 miles from city center Info Estimated distance in miles from Millcreek's city center to Paramount Health and Rehabilitation's address, calculated via Google Maps. — 4.12 miles to nearest hospital (University of Utah Health Care Occupational Medicine)

Calculate Travel Distance to Paramount Health and Rehabilitation

Add your location

Address

Financial Assistance for
Nursing Home in Utah

Paramount Health and Rehabilitation is located in Millcreek, Utah.
Here are the financial assistance programs available to residents in Utah.

Get Financial aid guidance

Aging Waiver

UT Medicaid Aging Waiver

Age 65+
General Utah resident, Medicaid-eligible, nursing home-level care need.
Income Limits (2025) ~$2,829/month 300% FBR, individual
Asset Limits $2,000 (individual), $3,000 (couple).
UT

Rural challenges; waitlists possible.

Benefits
Personal care (5-7 hours/day) Respite (240 hours/year) Adult day care ($65/day) Home modifications ($1,500 avg.)

Utah Alternatives Program

UT Alternatives

Age 60+
General Utah resident, at risk of nursing home.
Income Limits ~$2,000/month individual, varies
Asset Limits $5,000 individual
UT

Limited funding; rural focus.

Benefits
In-home care (3-5 hours/week) Respite (up to 10 days/year) Transportation (~5 trips/month)

Older Americans Act (OAA) Services

Utah OAA Services

Age 60+
General UT resident; no income/asset limits.
Income Limits (2025) None; donations encouraged.
Asset Limits Not assessed.
UT

12 AAAs; includes Meals on Wheels; rural emphasis.

Benefits
Meals (~$5-$7/meal) Transportation Homemaker services (~4 hours/week) Respite (5 days/year) Legal aid

Medicare Savings Program (MSP)

Utah Medicare Savings Program

Age 65+ or disabled
General UT resident, Medicare Part A/B.
Income Limits (2025) ~$2,510/month (QMB), ~$3,380/month (SLMB), ~$3,598/month (QI)—individual.
Asset Limits $9,430 (individual), $14,130 (couple).
UT

Includes Extra Help for Part D; no waitlist.

Benefits
Covers Part B premiums ($174.70/month) Deductibles ($240/year) Copays (~20%)

Home Energy Assistance Target (HEAT) Program

Utah HEAT Program

Age 60+ prioritized
General UT resident, low-income household.
Income Limits (2025) ~$3,970/month 185% FPL
Asset Limits Not assessed.
UT

Covers gas, electric, propane; emergency aid available.

Benefits
Heating/cooling aid ($300-$1,000/season) Crisis aid ($500 max)

Utah Caregiver Support Program

Utah Family Caregiver Support Program (FCSP)

Age
General Caregivers of 60+ needing care or 55+ caregivers of others; UT resident; 2+ ADLs.
Income Limits (2025) No strict cap; prioritizes low-income ~$24,980/year
Asset Limits Not assessed.
UT

Includes grandparent caregivers; serves ~1,500 annually.

Benefits
Respite (4-6 hours/week or 5 days/year) Adult day care ($60/day) Training Supplies (~$500/year)

VA Aid and Attendance (A&A) and Housebound Benefits

Utah VA Aid and Attendance/Housebound

Age 65+ or disabled veteran/spouse
General UT resident, wartime service, ADL help (A&A) or homebound.
Income Limits (2025) Net income < ~$1,984/month (veteran with dependent, A&A); pension offsets income.
Asset Limits ~$155,356 net worth
UT

Supports rural veterans; high demand near VA centers.

Benefits
Cash (~$1,433-$2,642/month veteran, ~$951-$1,318 spouse) for care costs

Property Tax Abatement and Deferral Programs

Utah Circuit Breaker and Deferral Programs

Age 66+ (abatement) or 75+ (deferral)
General UT resident 10+ months/year, homeowner.
Income Limits (2025) ~$40,000/year (household, abatement); no limit for deferral.
Asset Limits Not assessed; home value < ~$500,000 typical.
UT

Abatement up to $1,200; deferral accrues interest (2.5%-5%).

Benefits
Tax relief (~$500-$1,200/year) or deferral (postpones payment)

Senior Farmers’ Market Nutrition Program (SFMNP)

Utah SFMNP

Age 60+
General UT resident, low-income.
Income Limits (2025) ~$2,322/month 185% FPL
Asset Limits Not assessed.
UT

Vouchers (~$50/season); serves ~5,000 via 12 AAAs.

Benefits
Vouchers (~$50/season) for produce at farmers’ markets

Compare Nursing Home around Salt Lake City

The information below is reported by the Utah Department of Health and Human Services, Health Facility Licensing.

4 facilities compared · CMS & UT Dept. of Health data

William E. Christoffersen Salt Lake Veterans Home
NH

Nursing Home Licensed facility providing 24/7 skilled nursing care for residents with complex, ongoing medical needs. Staffed by RNs, LPNs, and CNAs. Inspected and star-rated annually by CMS. Accepts Medicare (short-term rehab) and Medicaid (long-term care).

AL

Assisted Living A licensed, long-term care setting for seniors or individuals with disabilities who need help with daily activities — like bathing, dressing, and medication management — but not 24-hour skilled nursing. Offers housing, meals, and around-the-clock support while aiming to maximize resident independence.

Salt Lake City (University)
81
Facility 81
UT AVG 84
Rank #89 / 196
92.1%
Facility 92.1%
UT AVG 70.1%
Rank #8 / 73
+31%
4.86
Facility 4.86
UT AVG 3.72
Rank #9 / 66
+32%+31%
$12.7k
Facility $12.7k
UT AVG $52.4k
Rank #1 / 66
22
Facility 22
UT AVG 27.7
Rank #32 / 65
5.5
Facility 5.5
UT AVG 7.6
Rank #25 / 65
175-
39
Facility 39
UT AVG 47
Rank #177 / 280
Avalon Va Management LLC
$15.6M
Facility $15.6M
UT AVG $10.3M
Rank #12 / 63
$8.1M
Facility $8.1M
UT AVG $3.8M
Rank #8 / 63
51.9%
Facility 51.9%
UT AVG 38%
Rank #21 / 63
465150
Sandstone Taylorsville
NH

Nursing Home Licensed facility providing 24/7 skilled nursing care for residents with complex, ongoing medical needs. Staffed by RNs, LPNs, and CNAs. Inspected and star-rated annually by CMS. Accepts Medicare (short-term rehab) and Medicaid (long-term care).

NC

Nursing Care

Salt Lake City
120
Facility 120
UT AVG 84
Rank #33 / 196
33.3%
Facility 33.3%
UT AVG 70.1%
Rank #69 / 73
-53%
3.47
Facility 3.47
UT AVG 3.72
Rank #34 / 66
-3%-7%
$7.5k
Facility $7.5k
UT AVG $52.4k
Rank #33 / 66
23
Facility 23
UT AVG 27.7
Rank #35 / 65
7.7
Facility 7.7
UT AVG 7.6
Rank #41 / 65
240-
38
Facility 38
UT AVG 47
Rank #183 / 280
Redwood Nursing & Rehab LLC
$20.1M
Facility $20.1M
UT AVG $10.3M
Rank #9 / 63
$7.0M
Facility $7.0M
UT AVG $3.8M
Rank #13 / 63
34.7%
Facility 34.7%
UT AVG 38%
Rank #55 / 63
465066
City Creek Post Acute
NH

Nursing Home Licensed facility providing 24/7 skilled nursing care for residents with complex, ongoing medical needs. Staffed by RNs, LPNs, and CNAs. Inspected and star-rated annually by CMS. Accepts Medicare (short-term rehab) and Medicaid (long-term care).

Salt Lake City (East Central)
108
Facility 108
UT AVG 84
Rank #55 / 196
70.8%
Facility 70.8%
UT AVG 70.1%
Rank #31 / 73
+1%
3.79
Facility 3.79
UT AVG 3.72
Rank #23 / 66
-54%+2%
$0
Facility $0
UT AVG $52.4k
Rank #1 / 66
18
Facility 18
UT AVG 27.7
Rank #24 / 65
6.0
Facility 6.0
UT AVG 7.6
Rank #29 / 65
268-
75
Facility 75
UT AVG 47
Rank #36 / 280
Avenues Healthcare, Inc.
$7.5M
Facility $7.5M
UT AVG $10.3M
Rank #41 / 63
$4.9M
Facility $4.9M
UT AVG $3.8M
Rank #25 / 63
66.2%
Facility 66.2%
UT AVG 38%
Rank #3 / 63
465072
Pine Creek Rehab and Nursing -
NH

Nursing Home Licensed facility providing 24/7 skilled nursing care for residents with complex, ongoing medical needs. Staffed by RNs, LPNs, and CNAs. Inspected and star-rated annually by CMS. Accepts Medicare (short-term rehab) and Medicaid (long-term care).

HC

Home Care Professional care delivered in the person's own home — from companionship and errands to skilled nursing and therapy. Allows seniors to age in place. Medicare covers skilled home health when medically necessary.

RC

Respite Care Short-term temporary care — days to weeks — to give family caregivers a break. Full care provided during the stay. Often used after hospitalization or to trial a facility before a permanent placement decision.

Salt Lake City (Poplar Grove)
34
Facility 34
UT AVG 84
Rank #168 / 196
--
-
Facility -
UT AVG 3.72
Rank #52 / 66
----56%-
-
Facility -
UT AVG $52.4k
Rank #57 / 66
42
Facility 42
UT AVG 27.7
Rank #53 / 65
10.5
Facility 10.5
UT AVG 7.6
Rank #55 / 65
3--
70
Facility 70
UT AVG 47
Rank #60 / 280
----46A064

Frequently Asked Questions about Paramount Health and Rehabilitation

Is Paramount Health and Rehabilitation in a walkable area?

Paramount Health and Rehabilitation has a walk score of 47. Somewhat walkable. A few nearby services may be reachable on foot, but most trips require transportation.

When does Paramount Health and Rehabilitation's license expire?

According to state health department records, Paramount Health and Rehabilitation's license expires on May 31, 2027.

What is the occupancy rate at Paramount Health and Rehabilitation?

Paramount Health and Rehabilitation's occupancy is 67%.

How many beds does Paramount Health and Rehabilitation have?

Paramount Health and Rehabilitation has 99 beds.

Are there photos of Paramount Health and Rehabilitation?

Yes — there are 12 photos of Paramount Health and Rehabilitation in the photo gallery on this page.

What is the address of Paramount Health and Rehabilitation?

Paramount Health and Rehabilitation is located at 4035 500 E, Millcreek, UT 84107, USA.

What is the phone number of Paramount Health and Rehabilitation?

(801) 262-9181 will put you in contact with the team at Paramount Health and Rehabilitation.

Guides for Better Senior Living

Care Cost Calculator: See Prices in Your Area

Nursing Home Data Explorer

Don’t Wait Too Long: 7 Red Flag Signs Your Parent Needs Assisted Living Now

The True Cost of Assisted Living in 2025 – And How Families Are Paying For It

Understanding Senior Living Costs: Pricing Models, Discounts & Financial Assistance

Explore Open Rooms
1 Contact details
2 What type of senior care service are you looking for?
3 What budget do you have in mind for senior care?
4 How soon do you need to find care?
5 Additional details

Thank you for your interest!

Our team will be in touch shortly to help with next steps.