Pelican Bay Assisted Living Community
Nursing Home, Assisted Living, Memory Care & Respite Care · Texas, TX
CMS overall rating Info CMS (the Centers for Medicare & Medicaid Services) is the federal agency that rates nursing home quality. Its Overall Rating runs from 1 to 5 stars, combining health inspections, staffing, and quality measures, with inspections weighted most heavily.

Pelican Bay Assisted Living Community

Nursing Home, Assisted Living, Memory Care & Respite Care · Texas, TX
CMS overall rating Info CMS (the Centers for Medicare & Medicaid Services) is the federal agency that rates nursing home quality. Its Overall Rating runs from 1 to 5 stars, combining health inspections, staffing, and quality measures, with inspections weighted most heavily.
Calculator: See prices in your area
Pelican Bay Assisted Living Community accepts Medicare, Medicaid, and private pay.

Overview of Pelican Bay Assisted Living Community

Operated by Oakridge Assisted Living Home Inc., Pelican Bay Assisted Living Community maintains 10 beds in Beaumont, Jefferson County, Texas. The resident census is predominantly Medicaid-funded (52 percent), with private-pay residents at 46 percent and Medicare admissions minimal at 2 percent. Typical stays average 128 days; indicating a long-term care orientation.

Inspection findings reveal significant performance concerns. State surveys since 2023 produced 34 citations across six reviews, including one critical violation. CMS issued a $26,000 civil money penalty in May 2025.

The core constraint is staffing: nursing hours at 2 hours 56 minutes per resident daily fall 22 percent below Texas benchmarks, ranking the facility 262 out of 289 statewide. The CMS staffing rating of 1 star captures this shortfall; 58 percent below state average.

Quality measures present a contradictory profile.

Functional decline, fall-related injuries, and urinary tract infection rates surpass state standards. Vaccination compliance for both pneumococcal and influenza reaches 100 percent. Conversely, pressure ulcer incidence in high-risk residents runs 121 percent above state average. Recent financial results show operating losses.

Pelican Bay is positioned for residents requiring assisted living or memory care services in a small facility with private suites and pet accommodation.

(409) 860-3500

Quality ratings

Measured by Centers for Medicare & Medicaid Services (CMS)

Overall rating Info The Overall CMS Rating combines results from health inspections, staffing levels and quality measures. Health inspections carry the most weight. Staffing and quality scores can increase or decrease the final rating based on performance compared to state and national standards.
▼ 28.4% Below TX avg. ▼ 28.4% Below TX avg.TX average: 2.8Click the badge to see the full State ranking.Click here to see the full State ranking.
Health Inspection Info Based on the results of the facility's three most recent standard inspections and any complaint investigations. CMS reviews the number, scope, and severity of deficiencies, with more recent findings weighted more heavily.
▼ 27.6% Below TX avg. ▼ 27.6% Below TX avg.TX average: 2.8Click the badge to see the full State ranking.Click here to see the full State ranking.
Staffing Info Measures average nursing staff hours per resident per day, including Registered Nurses (RNs) and total nursing staff. Ratings are adjusted based on the level of care residents require and are compared to state and national benchmarks.
▼ 52.9% Below TX avg. ▼ 52.9% Below TX avg.TX average: 2.1Click the badge to see the full State ranking.Click here to see the full State ranking.
Quality Measures Info Based on clinical and physical health indicators reported to CMS, such as hospital readmissions, falls, pressure ulcers, and improvements in mobility. These measures reflect how well residents' health needs are being managed.
▲ 33.2% Above TX avg. ▲ 33.2% Above TX avg.TX average: 3.8Click the badge to see the full State ranking.Click here to see the full State ranking.

Staffing hours breakdown

Info Daily nursing hours per resident by staff type, reported to CMS. Higher is generally better — compare this facility to state and national averages to see where staffing stands.

Hours per resident per day — compared to Texas state averages

Total nursing care / resident Info This home is ranked 269th out of 296 homes in Texas for nurse hours. Total adjusted nursing hours per resident per day, combining RN, LPN, and aide time. CMS adjusts this for case-mix so facilities can be fairly compared.
2h 56m per day
Rank #269 / 296Nurse hours — State benchmarkedThis home is ranked 269th out of 296 homes in Texas. Shows adjusted nurse hours per resident per day benchmarked to the Texas average, with a ranking across 296 Texas facilities. More hours mean more direct care. The national average is about 3.5 hrs; below 3.0 is a red flag.Rankings are based only on facilities in Texas that report data for that category. Facilities without available data are excluded from the ranking.Click the rank badge to see the full State ranking.Click here to see the full State ranking.
This facility Texas avg (3h 38m per day)
vs Texas avg
-19%

4 of 6 metrics below state avg

Standout metric Physical Therapist is +18% above state avg
Staff typeHours / Day / Residentvs state avg
Registered Nurse (RN) Info RNs hold the highest nursing license and can assess residents, interpret test results, and direct care plans. More RN hours per day often signals stronger clinical oversight and faster response to health changes. 9m per day ▼ 66% State avg: 25m per day · National avg: 41m per day
LPN / LVN Info Licensed Practical Nurses (LPNs) or Licensed Vocational Nurses (LVNs) deliver routine hands-on care — medication administration, wound dressing, and monitoring vital signs. They work under RN supervision and make up a large share of daily bedside care. 1h 5m per day ▲ 14% State avg: 57m per day · National avg: 52m per day
Nurse Aide Info Certified Nurse Aides (CNAs) provide the most direct day-to-day assistance: bathing, dressing, feeding, and mobility. Nurse aide hours are typically the largest staffing category and directly affect residents' quality of life. 1h 49m per day ▼ 10% State avg: 2h 1m per day · National avg: 2h 20m per day
Weekend Total Nursing Info Combined nursing hours (RN + LPN + Nurse Aide) per resident per day on weekends. Staffing often drops on weekends — this figure reveals whether the facility maintains adequate coverage outside of weekday hours. 2h 49m per day ▼ 6% State avg: 3h 0m per day · National avg: 3h 27m per day
Physical Therapist Info Hours per resident per day provided by licensed Physical Therapists (PTs) or PT Assistants. PT services help residents recover mobility after injury or illness and are especially important for post-acute (short-stay) rehabilitation. 5m per day ▲ 18% State avg: 4m per day · National avg: 4m per day
Weekend RN Info Registered nurse hours specifically on weekends. Facilities sometimes reduce RN presence on Saturdays and Sundays — a low weekend RN figure compared to weekday hours can indicate reduced clinical oversight when most administrative staff are absent. 11m per day ▼ 44% State avg: 20m per day · National avg: 29m per day

Capacity and availability

Avg. Length of Stay
128 days
Bed community size
10-bed community Rank #914 / 988Bed count — State benchmarkedThis home is ranked 914th out of 988 homes in Texas. Shows this facility's certified or reported bed count compared to other Texas facilities. Larger communities may offer more amenities, programs, and on-site services for residents and families.Rankings are based only on facilities in Texas that report data for that category. Facilities without available data are excluded from the ranking.Click the rank badge to see the full State ranking.Click here to see the full State ranking.
A smaller, more intimate setting that may offer a quieter environment and closer staff-resident interactions.
Years in operation
13 years in operation Rank #349 / 583Years in operation — State benchmarkedThis home is ranked 349th out of 583 homes in Texas. Shows how long this facility has been in operation compared to other Texas facilities. Longer operating histories may benefit residents, families, and staff.Rankings are based only on facilities in Texas that report data for that category. Facilities without available data are excluded from the ranking.Click the rank badge to see the full State ranking.Click here to see the full State ranking.
A community with a solid operating history and experience delivering ongoing care.
Walk Score
Walk Score: 16 / 100 Rank #1153 / 1391Walk Score — State benchmarkedThis home is ranked 1153rd out of 1391 homes in Texas. Shows how walkable this facility's neighborhood is compared to the average Walk Score across Texas facilities. Higher scores benefit residents, families, and staff.Rankings are based only on facilities in Texas that report data for that category. Facilities without available data are excluded from the ranking.Click the rank badge to see the full State ranking.Click here to see the full State ranking.
Car-dependent. Most errands require a car, with limited nearby walkable options.
BBB Rating
BBB Rating: A+ (Accredited)
An independent rating from the Better Business Bureau based on factors such as complaint history, transparency, and business practices.
How BBB ratings work

About this community

Occupancy

Occupancy rate
66%
Rank #160 / 304Occupancy rate — State benchmarkedThis home is ranked 160th out of 304 homes in Texas. Shows this facility's occupancy rate versus the Texas average, with its Statewide rank out of 304. Higher occupancy signals strong local demand and financial stability.Rankings are based only on facilities in Texas that report data for that category. Facilities without available data are excluded from the ranking.Click the rank badge to see the full State ranking.Click here to see the full State ranking.
Similar to the Texas average: 63.5%
Occupied beds
7 / 10
Average occupied beds in Texas homes 75 beds

License Details

Facility TypeType B
StatusRenewal In Process
CountyJefferson

Ownership & Operating Entity

Pelican Bay Assisted Living Community is legally operated by Oakridge Assisted Living Home Inc.

Staffing

Key information about the people who lead and staff this community.

Leadership

ContactMs. Meghan Casebolt, Manager

Memory & Specialized Care

1 service
No Alzheimer's certification

Contact Pelican Bay Assisted Living Community

Inspection History

In Texas, the Health and Human Services Commission (HHSC) is the primary regulatory body that conducts unannounced inspections and publishes quality reports for all long-term care homes.

Since 2023 · 3 years of data 5 citations 1 inspection

Inspection Scorecard Info This scorecard compares key inspection, citation, and complaint metrics at this facility against the Texas state average. Metrics rated ≥15% worse than average are highlighted in red; those ≥15% better are highlighted in green.

Since 2023 vs. Texas state average
Overall vs. TX average 0 Worse No metrics in this bucket. 1 At Avg Metrics at Texas average:
• Inspections with citations (at TX avg)
3 Better Metrics better than Texas average:
• Total citations (17% below)
• Life safety citations (17% below)
• Citations per year (15% below)
Latest Inspection June 22, 2023 Life Safety

Citations Info Citations are formal regulatory issues recorded during state inspections.

This FacilityTX Averagevs. TX Avg
Total citations Info Formal regulatory issues recorded by inspectors across all inspection types. 56 This facility has 17% fewer total citations than a typical Texas assisted living residence (5 vs. TX avg 6).↓ 17% better
Life safety citations Info Violations related to building safety — fire prevention, emergency egress, and similar. 56 This facility has 17% fewer life safety citations than a typical Texas assisted living residence (5 vs. TX avg 6).↓ 17% better
Citations per year Info Average citations per year since 2023. 1.72 This facility has 15% fewer citations per year than a typical Texas assisted living residence (1.7 vs. TX avg 2).↓ 15% better

Inspections Info State inspections evaluate whether the facility meets health and safety standards.

This FacilityTX Averagevs. TX Avg
Inspections with citations Info Inspections that resulted in at least one regulatory citation. 11 This facility has inspections with citations in line with the Texas average (1 vs. TX avg 1).— At avg

Inspection Reports Summary Info An editor-reviewed summary of the themes and findings across this facility's recent inspection reports.

  • June 22, 2023 inspection cited 5 life safety code violations related to fire alarm testing, sprinkler maintenance, gas pressure testing, and fire extinguisher inspections.
  • Deficiencies focused exclusively on life safety system documentation and maintenance, with no health code violations or complaints substantiated.
  • No enforcement actions or fines were issued, and no health-related deficiencies were found during the most recent inspection.

Health Inspection History

Inspections since 2023
Total health inspections 6

State average 7.4


Last Health inspection on Aug 2025

Total health citations
34 Rank #236 / 299Health citations — State benchmarkedThis home is ranked 236th out of 299 homes in Texas. Shows this facility's total health deficiency citations benchmarked to the Texas State average, with a ranking across all 299 TX facilities. Lower citation counts earn a better rank.Rankings are based only on facilities in Texas that report data for that category. Facilities without available data are excluded from the ranking.Click the rank badge to see the full State ranking.Click here to see the full State ranking.

State average 25.9

Citations per inspection
5.67 Rank #283 / 299Citations per inspection — State benchmarkedThis home is ranked 283rd out of 299 homes in Texas. Shows average deficiency citations per CMS inspection for this facility versus the Texas mean across 299 facilities with citation data. Lower is better.Rankings are based only on facilities in Texas that report data for that category. Facilities without available data are excluded from the ranking.Click the rank badge to see the full State ranking.Click here to see the full State ranking.

State average 3.67


Health citations are formal notices following inspections when they fail to comply with safety and care standards.

30 of 34 citations resulted from standard inspections; and 4 of 34 resulted from complaint investigations.

Breakdown of citation severity (last 3 years)
Critical health citations
1
50% better than State average

State average: 2


Serious health citations
0
100% better than State average

State average: 0.4

1 critical citation State average: 2

0 serious citations State average: 0.4

33 moderate citations State average: 23

0 minor citations State average: 0.4
Citations history (last 3 years)
Abuse/Neglect moderate citation Aug 28, 2025
Corrected

Administration moderate citation Aug 28, 2025
Corrected

Infection Control moderate citation Aug 28, 2025
Corrected

Nutrition moderate citation Aug 28, 2025
Corrected

Staffing Data

Reporting period: October 1 – December 31, 2025 (Q4 2025). Source: CMS Payroll-Based Journal report.

Total staff 98
Employees 95
Contractors 3
Staff to resident ratio 1.07 : 1
28% fewer staff per resident than Texas average
Texas average ratio: 1.48 : 1 Texas average ratio: 1.48 : 1See full Texas ranking
Avg staff/day 34
Average shift 9.1 hours
12% better than Texas average
Texas average: 8.1 hours Texas average shift: 8.1 hoursSee full Texas ranking
Total staff hours (quarter) 28,347

Nursing staff breakdown

Q4 2025 · Oct 1 – Dec 31 More info This data comes from the CMS Payroll-Based Journal report covering October 1 – December 31, 2025.
Registered Nurse

Manages medical care and health needs.

RN Staff Info All 1 RN Staff are full-time employees. No contractors work on this role. 1
Average shift length Info Average shift length. Calculated as total hours divided by days worked and average staff per day. 5.3 hours
Licensed Practical Nurse

Assists with medical care and medications.

LPN Staff Info No LPN Staff reported this quarter. 0
Average shift length Info Average shift length. Calculated as total hours divided by days worked and average staff per day.
Certified Nursing Assistant

Helps with daily care and mobility.

CNA Staff Info All 57 CNA Staff are full-time employees. No contractors work on this role. 57
Average shift length Info Average shift length. Calculated as total hours divided by days worked and average staff per day. 9 hours

Contractor staffing

Q4 2025 · Oct 1 – Dec 31 More info This data comes from the CMS Payroll-Based Journal report covering October 1 – December 31, 2025.

Total hours from contractors

0.5%

139 contractor hours this quarter

Medical Director: 1 Occupational Therapy Aide: 1 Occupational Therapy Assistant: 1

Staff by category

Q4 2025 · Oct 1 – Dec 31 More info This data comes from the CMS Payroll-Based Journal report covering October 1 – December 31, 2025.
Certified Nursing Assistant5705714,64492100%9
RN Director of Nursing240248,65692100%10.3
Clinical Nurse Specialist3031,09192100%7.8
Administrator2021,0566672%8
Respiratory Therapy Technician1016338592%7.4
Mental Health Service Worker1015286672%8
Physical Therapy Aide1015276470%8.2
Dietitian1014796166%7.8
Speech Language Pathologist2023427278%4.7
Qualified Social Worker1011554347%3.6
Registered Nurse101741415%5.3
Occupational Therapy Aide0115189%6.4
Medical Director0114867%8
Occupational Therapy Assistant0114078%5.7
Physical Therapy Assistant10125910%2.8
57 Certified Nursing Assistant
% of Days 100%
24 RN Director of Nursing
% of Days 100%
3 Clinical Nurse Specialist
% of Days 100%
2 Administrator
% of Days 72%
1 Respiratory Therapy Technician
% of Days 92%
1 Mental Health Service Worker
% of Days 72%
1 Physical Therapy Aide
% of Days 70%
1 Dietitian
% of Days 66%
2 Speech Language Pathologist
% of Days 78%
1 Qualified Social Worker
% of Days 47%
1 Registered Nurse
% of Days 15%
1 Occupational Therapy Aide
% of Days 9%
1 Medical Director
% of Days 7%
1 Occupational Therapy Assistant
% of Days 8%
1 Physical Therapy Assistant
% of Days 10%

Penalties and fines

Includes penalties issued in 2025

Federal penalties imposed by CMS for regulatory violations, including civil money penalties (fines) and denials of payment for new Medicare/Medicaid admissions.

Source: CMS Penalties Database (Data as of Jan 2026)

Total fines amount $26K Rank #126 / 301Federal fines — State benchmarkedThis home is ranked 126th out of 301 homes in Texas. Shows this facility's cumulative CMS federal fine dollars versus the Texas average among facilities with fines, and where it ranks among 301 facilities in the pool. Lower total dollars mean a better rank.Rankings are based only on facilities in Texas that report data for that category. Facilities without available data are excluded from the ranking.Click the rank badge to see the full State ranking.Click here to see the full State ranking.
68% lower than Texas average

Texas average: $80K

Number of fines 1
60% fewer fines than Texas average

Texas average: 2.5

Payment Denials Info Serious action where Medicare and/or Medicaid temporarily stops payments for new residents until issues are fixed. 0
100% fewer payment denials than Texas average

Texas average: 0.2

Fines amount comparison
This facility $26K
Texas average $80K
Penalty History

Penalties are imposed by CMS for violations of federal nursing home regulations.

1 penalty in the past 3 years

May 21, 2025 · $26K

Civil Money Penalty Info Fines imposed for noncompliance, which can be assessed per day or per instance of violation. May 21, 2025
$26K

Last updated: Jan 2026

Quality of care over time

These measures show how residents usually do over time at this home, based on health outcomes and preventive care.

High-risk clinical events score Info A composite score based on pressure ulcers, falls with injury, weight loss, walking ability decline, and activities of daily living decline. 5.4
38% better than Texas average

Texas average: 8.6

Functional decline score Info A composite score based on activities of daily living decline, walking ability decline, and incontinence. 5.6
65% better than Texas average

Texas average: 16.0

Long-stay resident measures
Need for Help with Daily Activities Increased Info Percent of long-stay residents whose need for help with daily activities has increased 7.1%
56% better than Texas average

Texas average: 16.2%

Walking Ability Worsened Info Percent of long-stay residents whose ability to move independently worsened 2.0%
88% better than Texas average

Texas average: 16.2%

Low Risk Residents with Bowel/Bladder Incontinence Info Percent of low risk long-stay residents who lose control of their bowels or bladder 7.6%
51% better than Texas average

Texas average: 15.7%

Falls with Major Injury Info Percent of long-stay residents experiencing one or more falls with major injury 1.9%
40% better than Texas average

Texas average: 3.2%

High Risk Residents with Pressure Ulcers Info Percent of long-stay high risk residents with pressure ulcers 9.8%
121% worse than Texas average

Texas average: 4.4%

Urinary Tract Infection Info Percent of long-stay residents with a urinary tract infection 0.0%
100% better than Texas average

Texas average: 0.8%

Lost Too Much Weight Info Percent of long-stay residents who lose too much weight 6.0%
72% worse than Texas average

Texas average: 3.5%

Depressive Symptoms Info Percent of long-stay residents who have depressive symptoms 0.0%
100% better than Texas average

Texas average: 2.9%

Antipsychotic Use Info Percent of long-stay residents who received an antipsychotic medication 3.1%
60% better than Texas average

Texas average: 7.9%

Pneumococcal Vaccine Info Percent of long-stay residents assessed and appropriately given the pneumococcal vaccine 100.0%
In line with Texas average

Texas average: 97.3%

Influenza Vaccine Info Percent of long-stay residents assessed and appropriately given the seasonal influenza vaccine 100.0%
In line with Texas average

Texas average: 97.9%

Short-stay resident measures
Pneumococcal Vaccine Info Percent of short-stay residents assessed and appropriately given the pneumococcal vaccine 98.9%
9% better than Texas average

Texas average: 90.4%

Antipsychotic medication increase Info Percent of short-stay residents who newly received an antipsychotic medication 0.0%
100% better than Texas average

Texas average: 1.4%

Influenza Vaccine Info Percent of short-stay residents assessed and appropriately given the seasonal influenza vaccine 97.0%
10% better than Texas average

Texas average: 88.0%

Breakdown by payment type

Medicare

25% of new residents, usually for short-term rehab.

Typical stay 19 days

Private pay

35% of new residents, often for short stays.

Typical stay 2 months

Medicaid

40% of new residents, often for long-term daily care.

Typical stay 7 - 8 months

Facility Characteristics

Source: CMS Long-Term Care Facility Characteristics (Data as of Jan 2026)

Total residents 92
Medicare
2
2.2% of residents
Medicaid
48
52.2% of residents
Private pay or other
42
45.7% of residents
Programs & Services
Residents Group

Residents meet regularly to discuss policies, care quality, and activities

Active Resident Council

Organized group of residents that meets regularly to discuss facility policies, quality of life, and activities.

Finances and operations

Based on CMS SNF Cost Report for fiscal year ending in 09/2023.

Voluntary non-profit community
Operated by a church.
Net patient revenue Info Net patient revenue — what the home actually collects for resident care, after contractual allowances, bad debt and discounts are subtracted from its gross charges (CMS cost report, Worksheet G-3). It covers resident care only; money the home earns from other sources is shown separately as "Other income."
$7.6M
Net patient income Info Net patient income: net patient revenue minus the home's total operating expenses. A positive figure means it earns more from resident care than it spends to deliver it; a negative figure means the opposite. It excludes non-operating "other income."
-$972.8K
Voluntary non-profit community Operated by a church.
Net patient revenue Info Net patient revenue — what the home actually collects for resident care, after contractual allowances, bad debt and discounts are subtracted from its gross charges (CMS cost report, Worksheet G-3). It covers resident care only; money the home earns from other sources is shown separately as "Other income."
$7.6M Rank #217 / 304Revenue — State benchmarkedThis home is ranked 217th out of 304 homes in Texas. Shows this facility's annual revenue compared to the Texas average. Higher revenue generally means more resources for staffing and capital — read alongside Payroll %.Rankings are based only on facilities in Texas that report data for that category. Facilities without available data are excluded from the ranking.Click the rank badge to see the full State ranking.Click here to see the full State ranking.
Net patient income Info Net patient income: net patient revenue minus the home's total operating expenses. A positive figure means it earns more from resident care than it spends to deliver it; a negative figure means the opposite. It excludes non-operating "other income."
-$972.8K
Other income Info Money the home earns outside of resident care — such as investments, grants, rentals and other non-operating sources (CMS cost report, Worksheet G-3). It is tracked separately from net patient revenue: it is not part of that figure, and it is not included in net patient income.
$611.7K
Payroll costs Info Staff salaries plus wage-related costs — benefits such as payroll taxes, health insurance and retirement — from the home's own accounting records (CMS cost report, Worksheet A). Contract or agency labor is counted separately, under other operating costs. Rank #190 / 304Payroll — State benchmarkedThis home is ranked 190th out of 304 homes in Texas. Shows total annual staff payroll benchmarked to the Texas average. Higher payroll investment relative to peers often signals better staffing and less reliance on cheaper contract labor.Rankings are based only on facilities in Texas that report data for that category. Facilities without available data are excluded from the ranking.Click the rank badge to see the full State ranking.Click here to see the full State ranking.
$4.0M 52.4% of net patient revenue Info Payroll as a share of revenue: staff salaries and wage-related benefits divided by net patient revenue. A higher figure means more of each revenue dollar goes to staff pay. Rank #101 / 304Payroll % — State benchmarkedThis home is ranked 101st out of 304 homes in Texas. Shows payroll as a percentage of revenue versus the Texas average. Well-run Texas facilities typically land around 51–63% — the top third Statewide. Below 25% may signal understaffing or heavy agency use — read with Staffing ratings.Rankings are based only on facilities in Texas that report data for that category. Facilities without available data are excluded from the ranking.Click the rank badge to see the full State ranking.Click here to see the full State ranking.
Other operating costs Info Everything it costs to run the home apart from payroll — food, utilities, supplies, maintenance, contract labor and administration. Calculated as total operating expense minus payroll (staff salaries and wage-related benefits).
$4.6M
Total costs Info The home's total operating expense for the year — all the costs of running it, salaries included (CMS cost report, Worksheet G-3).
$8.5M

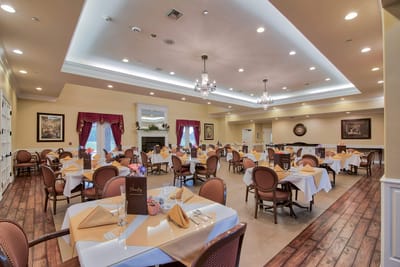
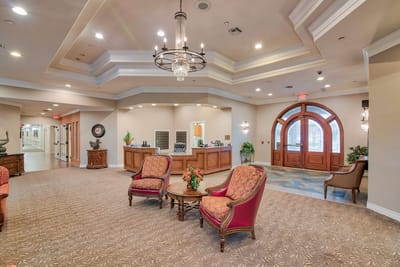
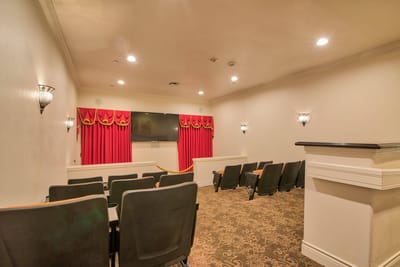
What does this home offer?

Pets allowed icon
Pets allowed icon

Pets Allowed

Housing options icon

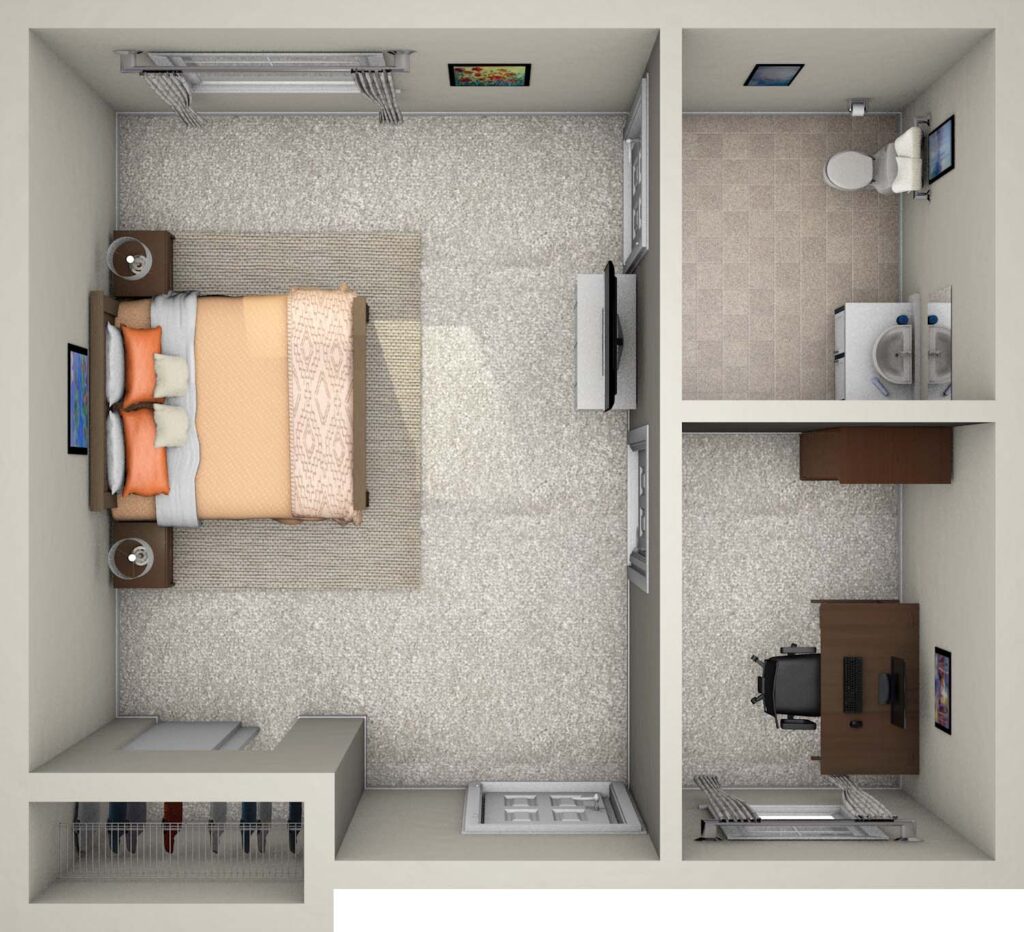
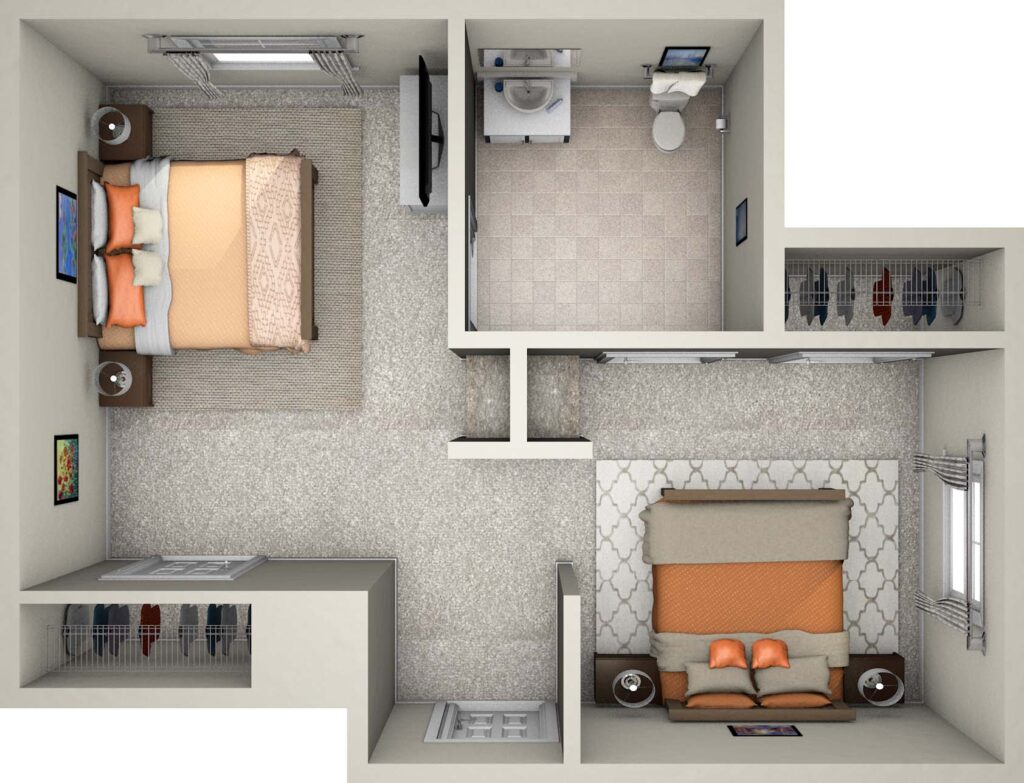
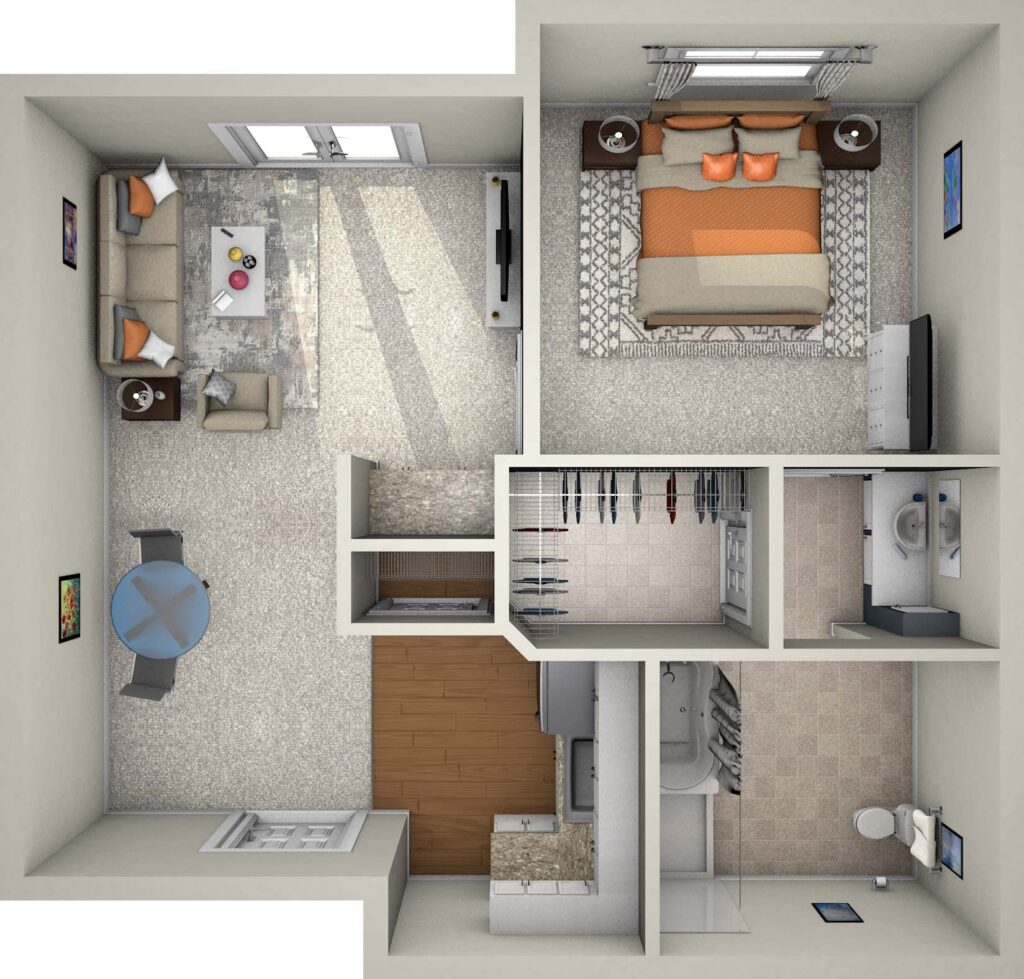
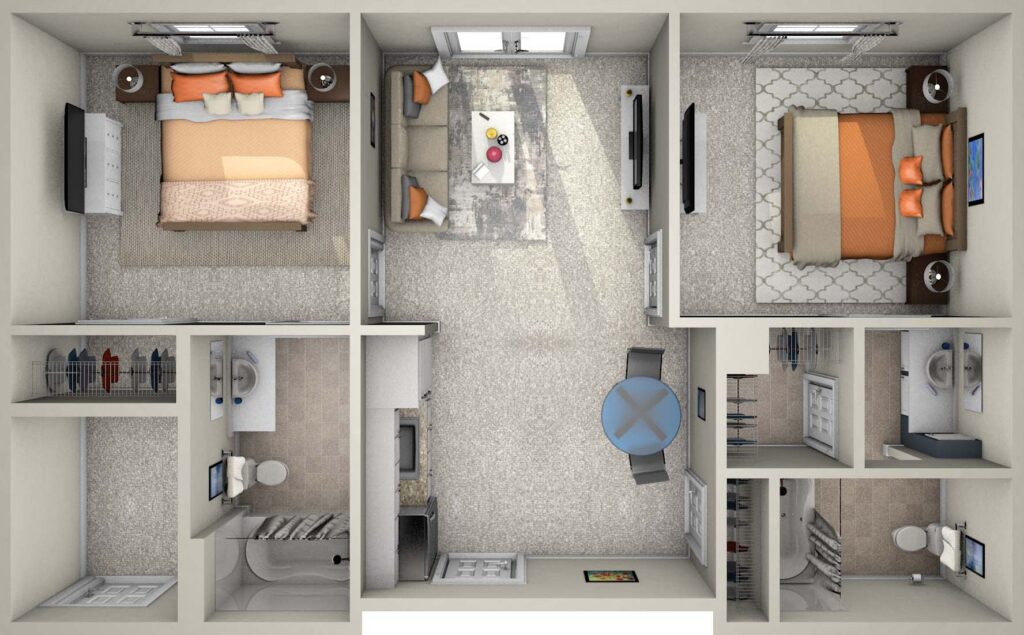
Housing Options: Private / Companion Suites

Building type icon
Building type icon

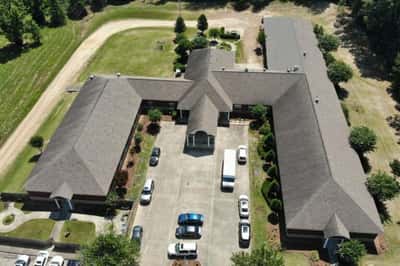
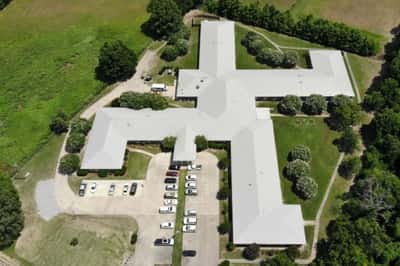
Building Type: Single-story

Fitness and recreation icon

Fitness and Recreation

Who this home usually serves

TYPE OF STAY

Mostly long-term care residents

Most residents stay for extended periods and receive ongoing daily care.

New residents most often arrive under Medicaid (40% of admissions), and a typical Medicaid stay runs around 7 - 8 months.

Admissions
262 total

Coverage residents most often arrive under.

Medicare 25%
Private pay 35%
Medicaid 40%
Discharges
249 total

Coverage residents most often leave under.

Medicare 18%
Private pay 28%
Medicaid 54%

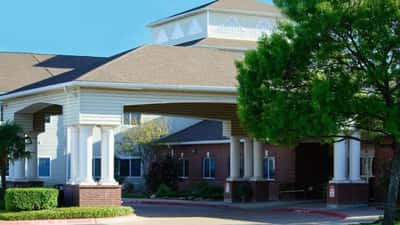
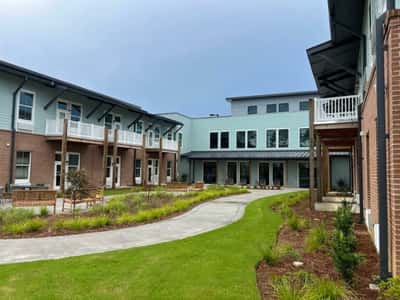
Living Spaces & Floor Plans for Pelican Bay Assisted Living Community

Pelican Bay Assisted Living Community 4
Pelican Bay Assisted Living Community3
Pelican Bay Assisted Living Community2
Pelican Bay Assisted Living Community1

Places of interest near Pelican Bay Assisted Living Community

Address 5.8 miles from city center Info Estimated distance in miles from Beaumont's city center to Pelican Bay Assisted Living Community's address, calculated via Google Maps.

Calculate Travel Distance to Pelican Bay Assisted Living Community

Add your location

Address

Compare Assisted Living around Texas

The information below is reported by the Texas Health and Human Services Commission.

Pelican Bay Assisted Living Community
AL
NH
MC
RC
Beaumont -
10
Facility 10
TX AVG 80
Rank #914 / 988
A+
16
Facility 16
TX AVG 41
Rank #1153 / 1391
Private / Companion Suites
Parkwood Assisted Living
AL
IL
MC
NH
Bedford -
84
Facility 84
TX AVG 80
Rank #465 / 988
-
34
Facility 34
TX AVG 41
Rank #865 / 1391
Studio / Suite / 1 Bed

Financial Assistance for
Assisted Living in Texas

Pelican Bay Assisted Living Community is located in Beaumont, Texas.
Here are the financial assistance programs available to residents in Texas.

Get Financial aid guidance

Community Care for the Aged and Disabled (CCAD)

TX Medicaid CCAD

Age 65+ or disabled
General Texas resident, Medicaid-eligible, care need (not always nursing home level).
Income Limits (2025) ~$2,829/month 300% FBR, individual
Asset Limits $2,000 (individual), $3,000 (couple).
TX

Large state; rural access challenges.

Benefits
Personal care (5-7 hours/day) Respite (240 hours/year) Adult day care (~$60/day) Home aides

Texas Community Care Services

TX CCS

Age 60+
General Texas resident, at risk of decline.
Income Limits ~$2,000/month individual, varies
Asset Limits $5,000 individual
TX

Limited funding; high demand in urban areas.

Benefits
In-home care (3-5 hours/week) Respite (up to 10 days/year) Transportation (~5 trips/month)

Area Agency on Aging (AAA) Services

Texas AAA Services

Age 60+
General TX resident; no income/asset limits.
Income Limits (2025) None; donations encouraged.
Asset Limits Not assessed.
TX

28 AAAs; includes Meals on Wheels in some areas.

Benefits
Meals (~$5-$7/meal) Transportation Homemaker services (~4 hours/week) Respite (~5 days/year) Legal aid

Medicare Savings Program (MSP)

Texas Medicare Savings Program

Age 65+ or disabled
General TX resident, Medicare Part A/B.
Income Limits (2025) ~$2,510/month (QMB), ~$3,380/month (SLMB), ~$3,598/month (QI)—individual.
Asset Limits $9,430 (individual), $14,130 (couple).
TX

Includes Extra Help for Part D; no waitlist.

Benefits
Covers Part B premiums ($174.70/month) Deductibles ($240/year) Copays (~20%)

Family Caregiver Support Program (FCSP)

Texas Family Caregiver Support Program

Age
General Caregivers of 60+ needing care or 55+ caregivers of others; TX resident; 2+ ADLs.
Income Limits (2025) No strict cap; prioritizes low-income ~$24,980/year
Asset Limits Not assessed.
TX

High rural demand; includes grandparent caregivers.

Benefits
Respite (4-6 hours/week or 5 days/year) Adult day care ($60/day) Training Supplies (~$500/year)

VA Aid and Attendance (A&A) and Housebound Benefits

Texas VA Aid and Attendance/Housebound

Age 65+ or disabled veteran/spouse
General TX resident, wartime service, ADL help (A&A) or homebound.
Income Limits (2025) Net income < ~$1,984/month (veteran with dependent, A&A); pension offsets income.
Asset Limits ~$155,356 net worth
TX

High veteran population; supports rural/urban needs.

Benefits
Cash (~$1,433-$2,642/month veteran, ~$951-$1,318 spouse) for care costs

Property Tax Exemption for Seniors

Texas Senior Property Tax Exemption

Age 65+
General TX resident, homeowner (homestead).
Income Limits (2025) None; tax-based eligibility.
Asset Limits Not assessed.
TX

$25,000+ exemption; optional freeze in some counties; saves ~$500-$1,000/year.

Benefits
Tax exemption or freeze (~$500-$1,000/year savings)

Senior Farmers’ Market Nutrition Program (SFMNP)

Texas SFMNP

Age 60+
General TX resident, low-income.
Income Limits (2025) ~$2,322/month 185% FPL
Asset Limits Not assessed.
TX

Vouchers (~$50/season); serves ~20,000 via 28 AAAs.

Benefits
Vouchers (~$50/season) for produce at farmers’ markets

More homes from the same operator

Frequently Asked Questions about Pelican Bay Assisted Living Community

Who is the owner of Pelican Bay Assisted Living Community?

The legal owner and operator of Pelican Bay Assisted Living Community is Oakridge Assisted Living Home Inc.

Is Pelican Bay Assisted Living Community in a walkable area?

Pelican Bay Assisted Living Community has a walk score of 16. Car-dependent. Most errands require a car, with limited nearby walkable options.

What is the occupancy rate at Pelican Bay Assisted Living Community?

Pelican Bay Assisted Living Community's occupancy is 66%.

How many beds does Pelican Bay Assisted Living Community have?

Pelican Bay Assisted Living Community has 10 beds.

Has Pelican Bay Assisted Living Community had any recent deficiencies or citations?

Pelican Bay Assisted Living Community has had 5 recently reported deficiencies.

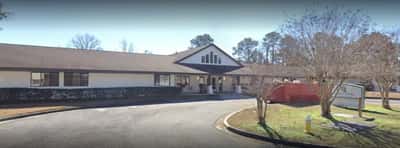
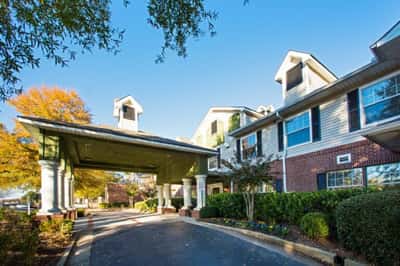
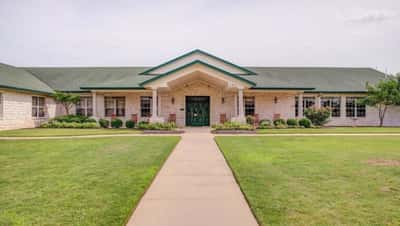
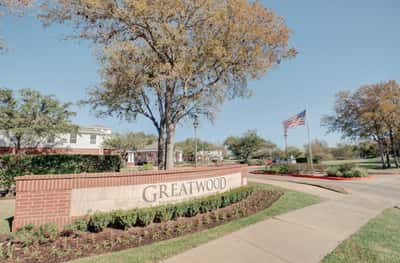
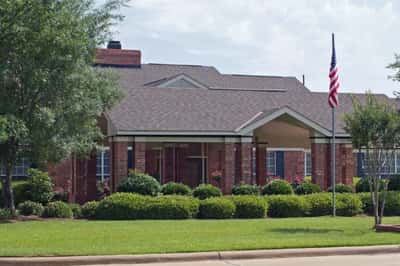
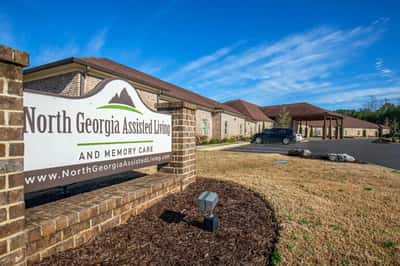
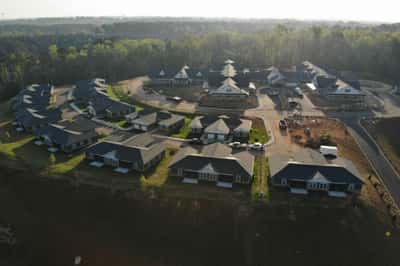
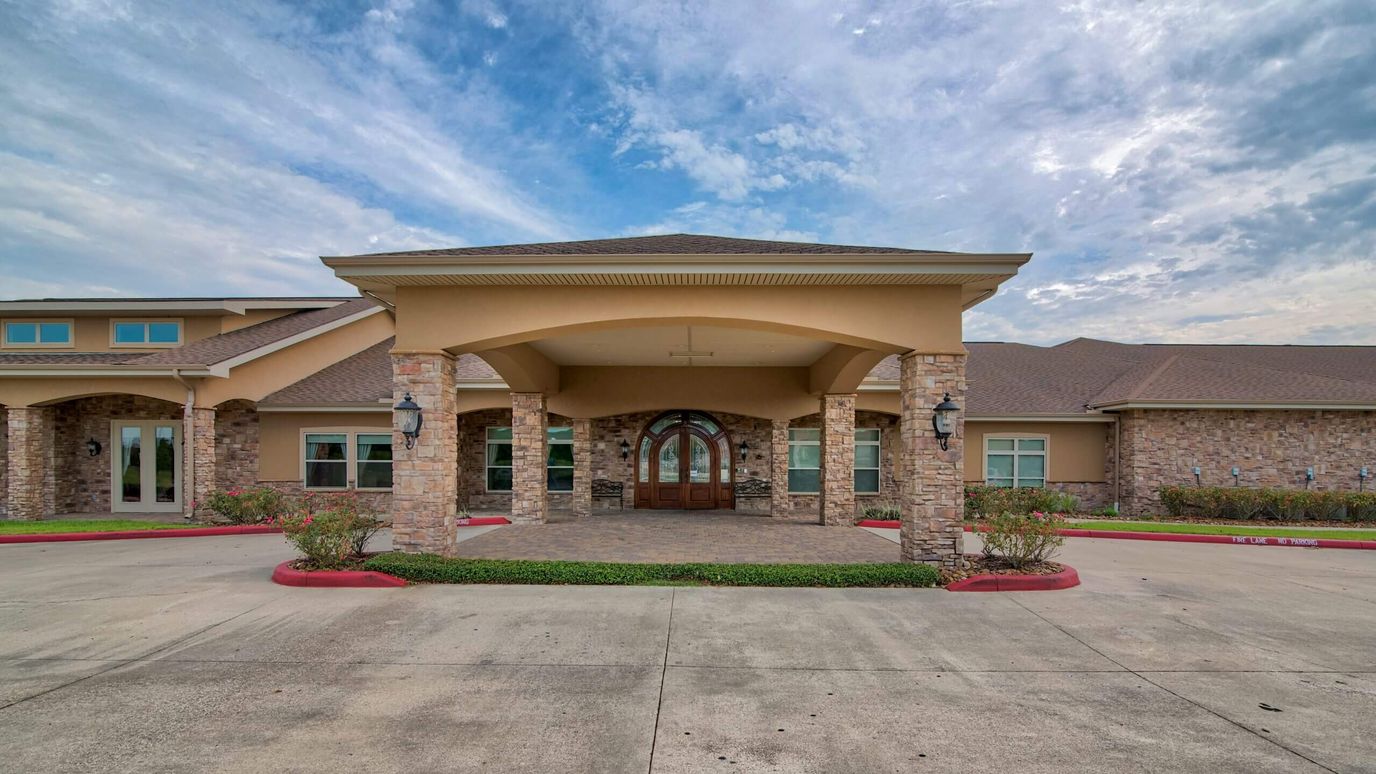
Are there photos of Pelican Bay Assisted Living Community?

Yes — there are 4 photos of Pelican Bay Assisted Living Community in the photo gallery on this page.

What is the address of Pelican Bay Assisted Living Community?

Pelican Bay Assisted Living Community is located at 2501 S Major Dr, Beaumont, TX 77707.

Guides for Better Senior Living

Care Cost Calculator: See Prices in Your Area

Nursing Home Data Explorer

Don’t Wait Too Long: 7 Red Flag Signs Your Parent Needs Assisted Living Now

The True Cost of Assisted Living in 2025 – And How Families Are Paying For It

Understanding Senior Living Costs: Pricing Models, Discounts & Financial Assistance