


Hospitalizations per 1,000 days
 Number of hospitalizations per 1,000 long-stay resident days.
1.00
Number of hospitalizations per 1,000 long-stay resident days.
1.00
South Carolina average: 2.03
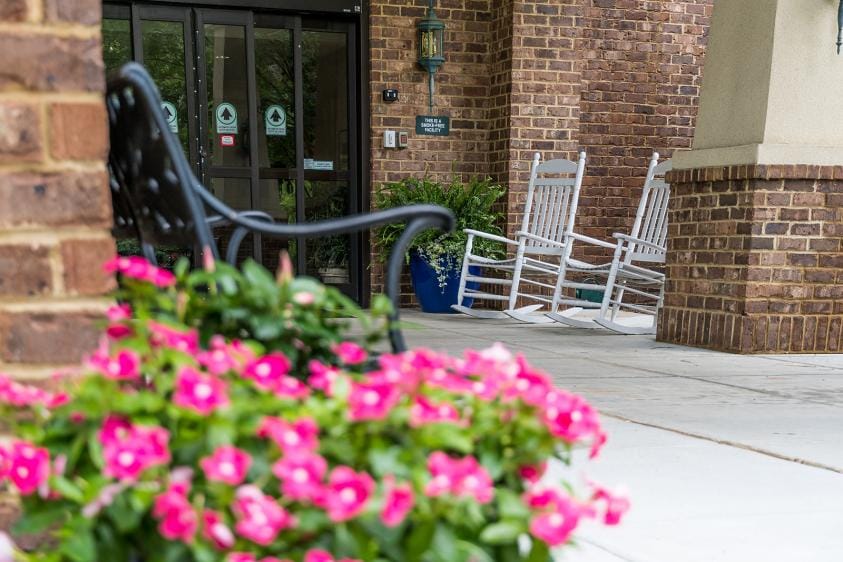
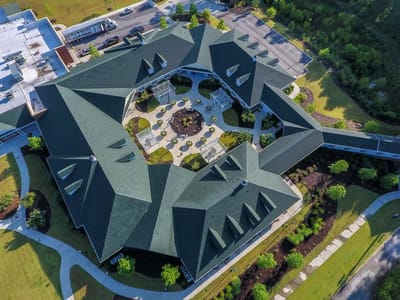
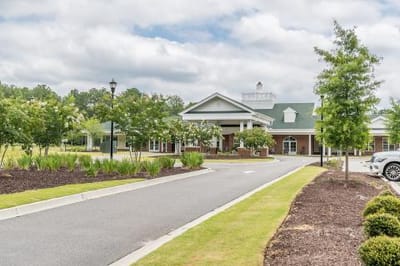


Located on Finley Road, Rice Estate Rehabilitation and Healthcare is a continuing care community in Columbia’s Richland County. Lutheran Homes of South Carolina Inc operates the community, while Daniel John Amodio serves as administrator. It offers independent living, assisted living, memory support, rehabilitation, and long-term nursing care under one roof. Residents can move between care levels as their needs change without relocating to another facility.
The 80-bed community has been operating for 18 years. Its current occupancy rate is 86%. Residents stay an average of about 67 days, which is a pattern that reflects post-acute rehabilitation admissions alongside residents receiving ongoing nursing care. Most new residents use private pay, while Medicare covers shorter-term rehabilitation stays. Families have different ways to fund care based on the type of stay.
Nursing coverage is a notable part of daily life. Total nursing care averages 4 hours and 38 minutes per resident daily. Registered nurses provide 40 minutes of that time, and nurse aides contribute close to 3 hours per resident each day. This staffing gives residents regular clinical oversight and hands-on daily assistance.
Rehabilitation is a main focus, with dedicated short-term rehabilitation services alongside general rehabilitation and nursing programs. The community also offers a memory support program and respite care for families needing temporary care.
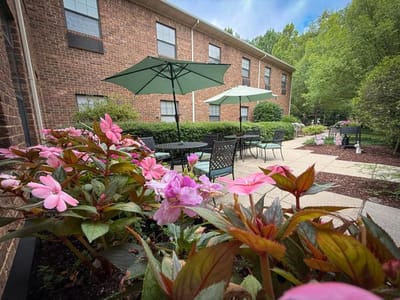
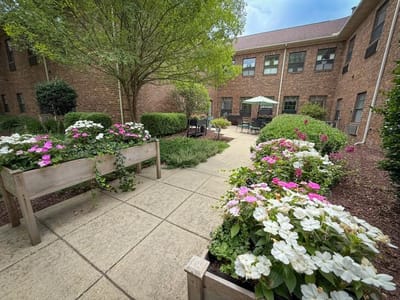
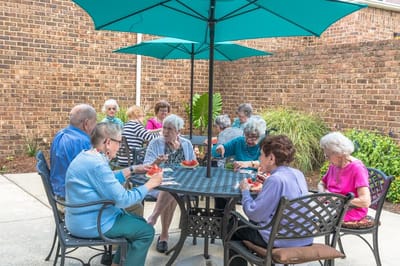
Residents can gather in the Magnolia Dining Room or one of the private dining rooms. They can spend time in the courtyard gardens or use walking paths beside the property’s protected wetlands. Other amenities include a fitness room, card room, common laundry room, and an on-site beauty and barber salon.
Families touring the community may ask how the memory support and short-term rehabilitation programs are structured because both programs are particular strengths within the community.
Staffing hours
![]() Daily nursing hours per resident by staff type, reported to CMS. Higher is generally better — compare this facility to state and national averages to see where staffing stands.
Daily nursing hours per resident by staff type, reported to CMS. Higher is generally better — compare this facility to state and national averages to see where staffing stands.
Hours per resident per day vs South Carolina averages
Total nursing care
![]() This home is ranked 22nd out of 118 homes in South Carolina for nurse hours. Total adjusted nursing hours per resident per day, combining RN, LPN, and aide time. CMS adjusts this for case-mix so facilities can be fairly compared.
This home is ranked 22nd out of 118 homes in South Carolina for nurse hours. Total adjusted nursing hours per resident per day, combining RN, LPN, and aide time. CMS adjusts this for case-mix so facilities can be fairly compared.
4h 38m
16% above state avg1 of 6 metrics below state avg
Rice Estate Rehabilitation and Healthcare is legally operated by Lutheran Homes Of South Carolina Inc, and administered by Daniel John Amodio.
Key information about the people who lead and staff this community.
Federal penalties imposed by CMS for regulatory violations, including civil money penalties (fines) and denials of payment for new Medicare/Medicaid admissions.
Source: CMS Penalties Database
No penalties in the past 3 years
No civil money penalties or payment denials were reported in the last 3 years.
These measures show how residents usually do over time at this home, based on health outcomes and preventive care.
South Carolina average: 2.03
South Carolina average: 1.91
South Carolina average: 24.7%
South Carolina average: 14.1%
South Carolina average: 0.8%
South Carolina average: 53.7%
South Carolina average: 50.6%
Quality measures are calculated from Minimum Data Set (MDS) assessments. For most measures, lower percentages indicate better care quality.
38% of new residents, usually for short-term rehab.
62% of new residents, often for short stays.
Based on CMS SNF Cost Report for fiscal year ending in 09/2023.
Residents typically stay for brief periods, with frequent admissions and discharges throughout the year.
Most new residents arrive under private pay (62% of admissions), and a typical private pay stay runs around 6 months.
Coverage residents most often arrive under.
Coverage residents most often leave under.
![]() 8.4 miles from city center
8.4 miles from city center
![]() Estimated distance in miles from Columbia's city center to Rice Estate Rehabilitation and Healthcare's address, calculated via Google Maps.
Estimated distance in miles from Columbia's city center to Rice Estate Rehabilitation and Healthcare's address, calculated via Google Maps.
Add your location
Info below is compiled from CMS reports & the SC Dept. of Public Health (DPH), senior community websites & trusted data sources such as Walk Score & BBB.
Communities are listed from highest to lowest based on our ranking methodology.
| Still Hopes Episcopal Retirement Community | NH AL IL MC SNF | West Columbia (Still Hopes Drive) | 22
Facility
22
SC AVG
90
Rank
#299 / 305 |
96.4%
Facility
96.4%
SC AVG
84.8
Rank
#11 / 94 | +14% | - | +65% | - | $0
Facility
$0
SC AVG
$34.8k
Rank
#1 / 120 | 5
Facility
5
SC AVG
13.7
Rank
#14 / 119 | 1.3
Facility
1.3
SC AVG
3.4
Rank
#3 / 119 | 1 | 21 | A+ |
63
Facility
63
SC AVG
34
Rank
#14 / 221 | Frances Case | $28.0MFiscal year ending 09/2023
Facility
$28.0MFiscal year ending 09/2023
SC AVG
$12.1M
Rank
#4 / 113 | $23.0MFiscal year ending 09/2023
Facility
$23.0MFiscal year ending 09/2023
SC AVG
$7.3M
Rank
#3 / 113 | 82.2%Fiscal year ending 09/2023
Facility
82.2%Fiscal year ending 09/2023
SC AVG
62.8%
Rank
#10 / 113 | 425401 | ||||
| Nhc Healthcare Parklane | NH HC HOS SNF | Columbia | 180
Facility
180
SC AVG
90
Rank
#7 / 305 | - | - | 5.05
Facility
5.05
SC AVG
4.00
Rank
#14 / 118 | -24% | +26% | $0
Facility
$0
SC AVG
$34.8k
Rank
#1 / 120 | 17
Facility
17
SC AVG
13.7
Rank
#88 / 119 | 5.7
Facility
5.7
SC AVG
3.4
Rank
#110 / 119 | - | 104 | - | - | William Birmingham | $21.1MFiscal year ending 12/2023
Facility
$21.1MFiscal year ending 12/2023
SC AVG
$12.1M
Rank
#12 / 113 | $11.4MFiscal year ending 12/2023
Facility
$11.4MFiscal year ending 12/2023
SC AVG
$7.3M
Rank
#11 / 113 | 54%Fiscal year ending 12/2023
Facility
54%Fiscal year ending 12/2023
SC AVG
62.8%
Rank
#76 / 113 | 425352 | ||||
| Wildewood Downs Retirement Community | NH AL IL MC SNF | Columbia (Williamsburg East) | 57
Facility
57
SC AVG
90
Rank
#227 / 305 |
28.1%
Facility
28.1%
SC AVG
84.8
Rank
#92 / 94 | -67% | 5.41
Facility
5.41
SC AVG
4.00
Rank
#9 / 118 | +300% | +35% | $3.7k
Facility
$3.7k
SC AVG
$34.8k
Rank
#54 / 120 | 13
Facility
13
SC AVG
13.7
Rank
#70 / 119 | 4.3
Facility
4.3
SC AVG
3.4
Rank
#90 / 119 | - | 16 | - |
33
Facility
33
SC AVG
34
Rank
#117 / 221 | Diana Chavis | $6.6MFiscal year ending 12/2023
Facility
$6.6MFiscal year ending 12/2023
SC AVG
$12.1M
Rank
#101 / 113 | $6.1MFiscal year ending 12/2023
Facility
$6.1MFiscal year ending 12/2023
SC AVG
$7.3M
Rank
#68 / 113 | 92.9%Fiscal year ending 12/2023
Facility
92.9%Fiscal year ending 12/2023
SC AVG
62.8%
Rank
#7 / 113 | 425385 | ||||
| Rice Estate – Assisted Living | NH AL HOS IL MC RC SNF | Columbia | 40
Facility
40
SC AVG
90
Rank
#285 / 305 |
35.0%
Facility
35.0%
SC AVG
84.8
Rank
#89 / 94 | -59% | 4.63
Facility
4.63
SC AVG
4.00
Rank
#22 / 118 | -42% | +16% | $0
Facility
$0
SC AVG
$34.8k
Rank
#1 / 120 | 8
Facility
8
SC AVG
13.7
Rank
#35 / 119 | 2.7
Facility
2.7
SC AVG
3.4
Rank
#39 / 119 | - | 14 | A | - | Lutheran Homes Of South Carolina Inc | $12.8MFiscal year ending 09/2023
Facility
$12.8MFiscal year ending 09/2023
SC AVG
$12.1M
Rank
#35 / 113 | $7.1MFiscal year ending 09/2023
Facility
$7.1MFiscal year ending 09/2023
SC AVG
$7.3M
Rank
#45 / 113 | 55.9%Fiscal year ending 09/2023
Facility
55.9%Fiscal year ending 09/2023
SC AVG
62.8%
Rank
#67 / 113 | 425387 |
Rice Estate Rehabilitation and Healthcare is located in COLUMBIA, South Carolina.
Here are the financial assistance programs available to residents in South Carolina.
Rice Estate Rehabilitation and Healthcare is legally operated by Lutheran Homes Of South Carolina Inc, and administered by Daniel John Amodio.
According to SC state health department records, Rice Estate Rehabilitation and Healthcare's license number is NCF-0831.
Rice Estate Rehabilitation and Healthcare's occupancy is 86.0%.
Rice Estate Rehabilitation and Healthcare has been operating for approximately 18 years, based on available licensing and registration records.
No, Rice Estate Rehabilitation and Healthcare has a no-pet policy.
The team at Rice Estate Rehabilitation and Healthcare can be reached at DAMODIO@RICEESTATE.ORG.
Rice Estate Rehabilitation and Healthcare is registered as a non-profit in SC.
Care Cost Calculator: See Prices in Your Area
Nursing Home Data Explorer
Don’t Wait Too Long: 7 Red Flag Signs Your Parent Needs Assisted Living Now
The True Cost of Assisted Living in 2025 – And How Families Are Paying For It
Understanding Senior Living Costs: Pricing Models, Discounts & Financial Assistance


