Still Hopes Episcopal Retirement Community
Nursing Home, Assisted Living, Independent Living & Memory Care · West Columbia, SC
CMS overall rating Info CMS (the Centers for Medicare & Medicaid Services) is the federal agency that rates nursing home quality. Its Overall Rating runs from 1 to 5 stars, combining health inspections, staffing, and quality measures, with inspections weighted most heavily.

Still Hopes Episcopal Retirement Community

Nursing Home, Assisted Living, Independent Living & Memory Care · West Columbia, SC
CMS overall rating Info CMS (the Centers for Medicare & Medicaid Services) is the federal agency that rates nursing home quality. Its Overall Rating runs from 1 to 5 stars, combining health inspections, staffing, and quality measures, with inspections weighted most heavily.
Calculator: See prices in your area
Still Hopes Episcopal Retirement Community accepts Medicare and private pay.

Overview of Still Hopes Episcopal Retirement Community

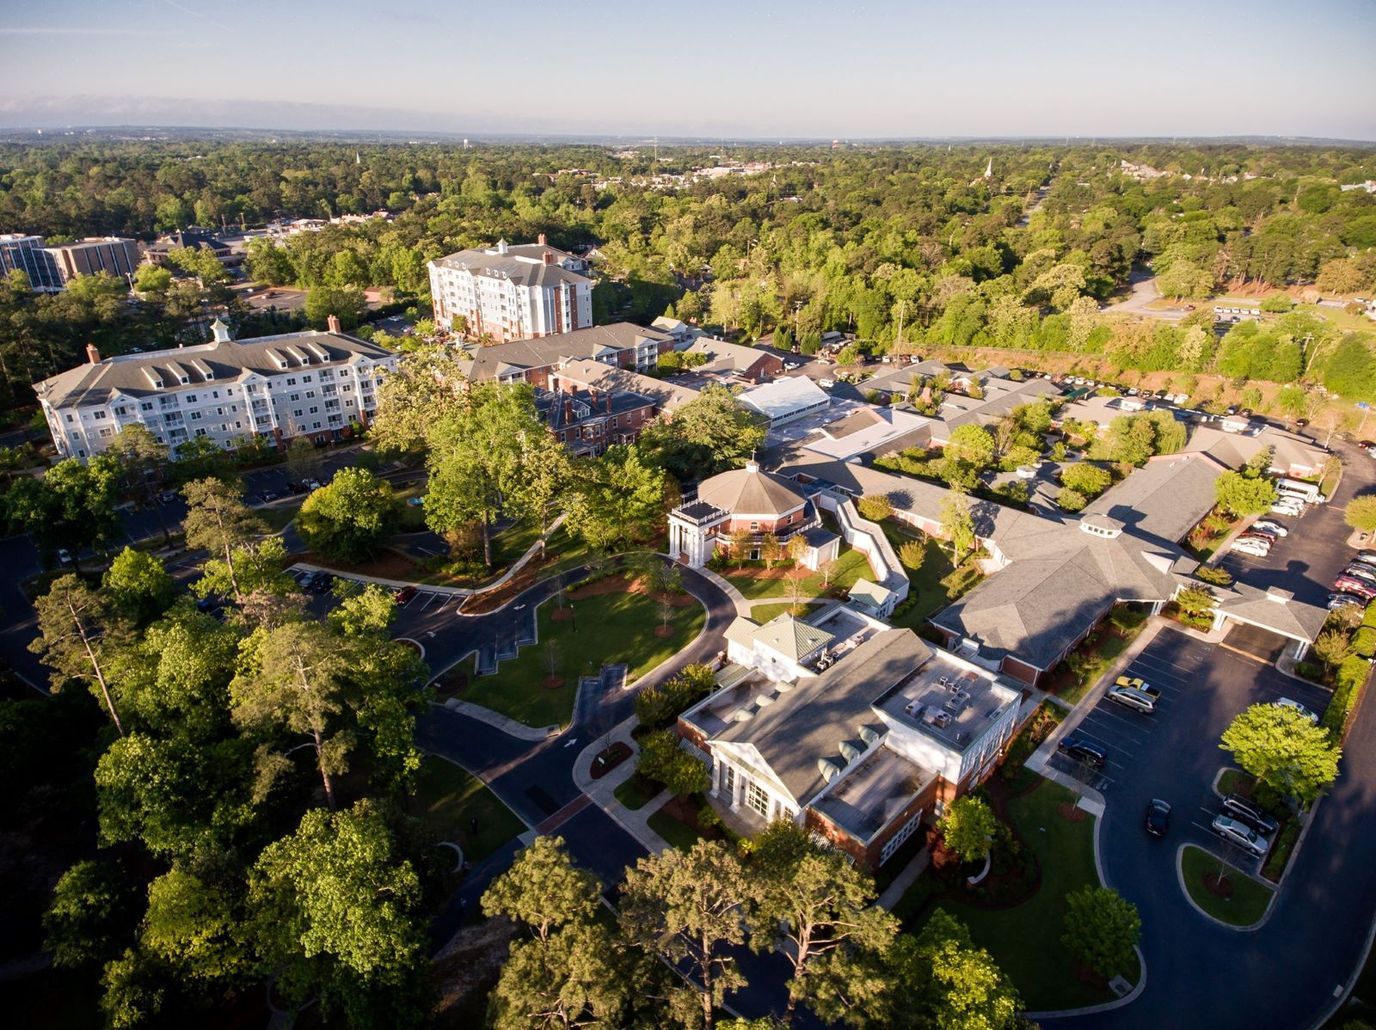
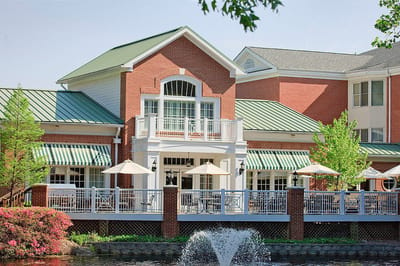
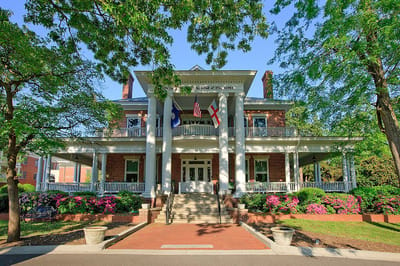
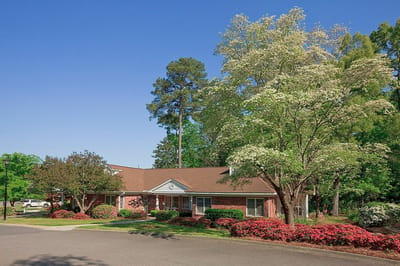
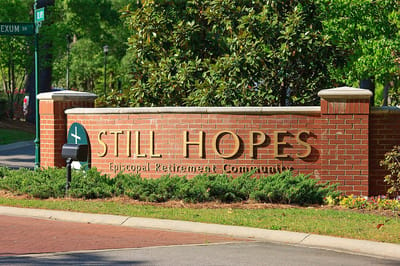
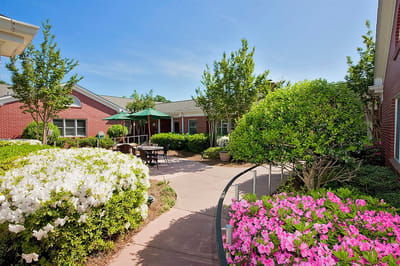
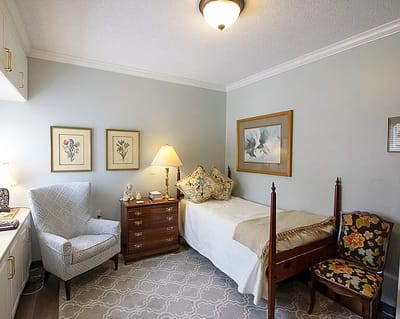
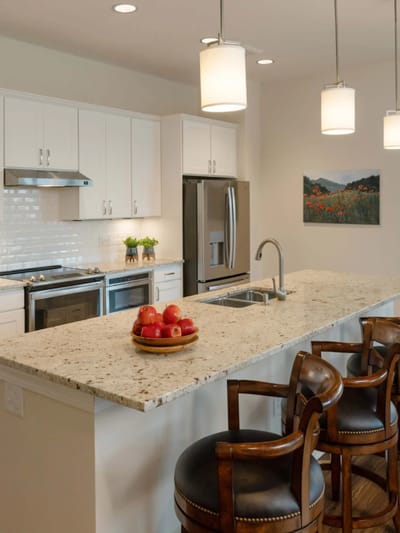
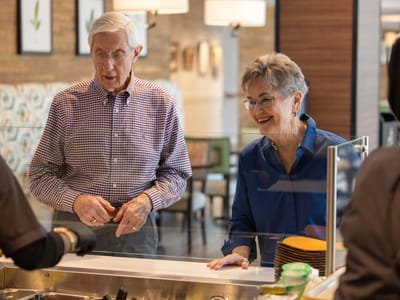
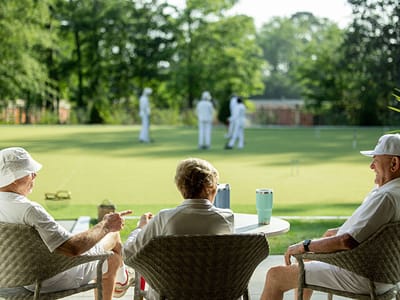
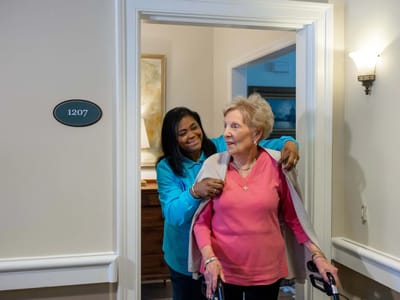
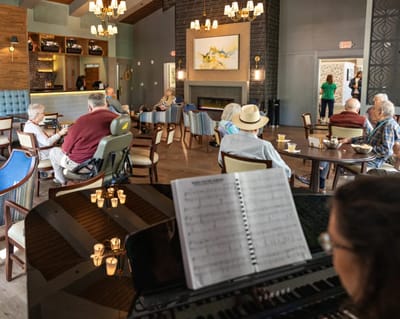
Situated upon 44 acres of tranquil woods in the greater Columbia area, Still Hopes Episcopal Retirement Community’s open arms welcome all who seek an active independent living home to make the most of their golden years. A range of cozy apartments and free-standing cottages are available, coupled with a staff of well-trained nurses that provide individualized care upon request, making for a safe environment, conducive to relaxation. Still Hopes offers a Wellness Center, Solutions for Living at Home services such as cooking, cleaning, and even healthcare, and rehabilitation plans, for a holistic approach to daily physical and mental rejuvenation. Learn to love your artistic side, discover musical talent you never knew you had, or work on your backhand on the golf course; there’s no shortage of activities you can finally make time for all while your basic necessities are covered.

Should you want to venture out ever so often, Still Hopes is an independent living home that’s not only peaceful but accessible; around seven minutes away is the center of downtown Columbia with every manner of establishment well-within reach.

Quality ratings

Measured by Centers for Medicare & Medicaid Services (CMS)

Overall rating Info The Overall CMS Rating combines results from health inspections, staffing levels and quality measures. Health inspections carry the most weight. Staffing and quality scores can increase or decrease the final rating based on performance compared to state and national standards.
▲ 75.8% Above SC avg. ▲ 75.8% Above SC avg.SC average: 2.8Click the badge to see the full State ranking.Click here to see the full State ranking.
Health Inspection Info Based on the results of the facility's three most recent standard inspections and any complaint investigations. CMS reviews the number, scope, and severity of deficiencies, with more recent findings weighted more heavily.
▲ 82.4% Above SC avg. ▲ 82.4% Above SC avg.SC average: 2.7Click the badge to see the full State ranking.Click here to see the full State ranking.
Staffing Info Measures average nursing staff hours per resident per day, including Registered Nurses (RNs) and total nursing staff. Ratings are adjusted based on the level of care residents require and are compared to state and national benchmarks.
▲ 38.3% Above SC avg. ▲ 38.3% Above SC avg.SC average: 2.9Click the badge to see the full State ranking.Click here to see the full State ranking.
Quality Measures Info Based on clinical and physical health indicators reported to CMS, such as hospital readmissions, falls, pressure ulcers, and improvements in mobility. These measures reflect how well residents' health needs are being managed.
▲ 48.7% Above SC avg. ▲ 48.7% Above SC avg.SC average: 3.4Click the badge to see the full State ranking.Click here to see the full State ranking.

Staffing hours breakdown

Info Daily nursing hours per resident by staff type, reported to CMS. Higher is generally better — compare this facility to state and national averages to see where staffing stands.

Hours per resident per day — compared to South Carolina state averages

Staff typeHours / Day / Residentvs state avg
Registered Nurse (RN) Info RNs hold the highest nursing license and can assess residents, interpret test results, and direct care plans. More RN hours per day often signals stronger clinical oversight and faster response to health changes. 2h 0m per day ▲ 216% State avg: 38m per day · National avg: 41m per day
LPN / LVN Info Licensed Practical Nurses (LPNs) or Licensed Vocational Nurses (LVNs) deliver routine hands-on care — medication administration, wound dressing, and monitoring vital signs. They work under RN supervision and make up a large share of daily bedside care. 1h 23m per day ▲ 35% State avg: 1h 1m per day · National avg: 52m per day
Nurse Aide Info Certified Nurse Aides (CNAs) provide the most direct day-to-day assistance: bathing, dressing, feeding, and mobility. Nurse aide hours are typically the largest staffing category and directly affect residents' quality of life. 3h 46m per day ▲ 70% State avg: 2h 13m per day · National avg: 2h 20m per day
Weekend Total Nursing Info Combined nursing hours (RN + LPN + Nurse Aide) per resident per day on weekends. Staffing often drops on weekends — this figure reveals whether the facility maintains adequate coverage outside of weekday hours. 5h 51m per day ▲ 75% State avg: 3h 21m per day · National avg: 3h 26m per day
Physical Therapist Info Hours per resident per day provided by licensed Physical Therapists (PTs) or PT Assistants. PT services help residents recover mobility after injury or illness and are especially important for post-acute (short-stay) rehabilitation. 7m per day ▲ 41% State avg: 5m per day · National avg: 4m per day
Weekend RN Info Registered nurse hours specifically on weekends. Facilities sometimes reduce RN presence on Saturdays and Sundays — a low weekend RN figure compared to weekday hours can indicate reduced clinical oversight when most administrative staff are absent. 1h 25m per day ▲ 256% State avg: 24m per day · National avg: 28m per day

Capacity and availability

This home usually has limited availability

Higher occupancy than the South Carolina average: 82.1%
Occupancy rate
89.1% Rank #38 / 131Occupancy rate — State benchmarkedThis home is ranked 38th out of 131 homes in South Carolina. Shows this facility's occupancy rate versus the South Carolina average, with its Statewide rank out of 131. Higher occupancy signals strong local demand and financial stability.Rankings are based only on facilities in South Carolina that report data for that category. Facilities without available data are excluded from the ranking.Click the rank badge to see the full State ranking.Click here to see the full State ranking.
Avg. Length of Stay
25 days
Bed community size
22-bed community Rank #303 / 309Bed count — State benchmarkedThis home is ranked 303rd out of 309 homes in South Carolina. Shows this facility's certified or reported bed count compared to other South Carolina facilities. Larger communities may offer more amenities, programs, and on-site services for residents and families.Rankings are based only on facilities in South Carolina that report data for that category. Facilities without available data are excluded from the ranking.Click the rank badge to see the full State ranking.Click here to see the full State ranking.
A smaller, more intimate setting that may offer a quieter environment and closer staff-resident interactions.
Years in operation
49 years in operation
A longer operating history, which may indicate experience navigating regulations and delivering ongoing care.
Walk Score
Walk Score: 63 / 100 Rank #14 / 232Walk Score — State benchmarkedThis home is ranked 14th out of 232 homes in South Carolina. Shows how walkable this facility's neighborhood is compared to the average Walk Score across South Carolina facilities. Higher scores benefit residents, families, and staff.Rankings are based only on facilities in South Carolina that report data for that category. Facilities without available data are excluded from the ranking.Click the rank badge to see the full State ranking.Click here to see the full State ranking.
Moderately walkable. Some errands can be accomplished on foot, with a mix of nearby amenities.
BBB Rating
BBB Rating: A+ (Not Accredited)
An independent rating from the Better Business Bureau based on factors such as complaint history, transparency, and business practices.
How BBB ratings work

About this community

License Details

CMS Certification Number425401

Staffing

Key information about the people who lead and staff this community.

Leadership

ContactMr. Danny Sanford, Executive Director

Staff Composition

Total Employees
140
Full-Time Employees
140

Payment & Insurance

1 service
Accept Medicare

Therapy & Rehabilitation

2 services
Rehabilitation Services
Respite Care

Staffing & Medical

1 service
24-Hour Staffing

Dining & Nutrition

Food DescriptionEnjoy chef-crafted meals made with fresh, local ingredients in inviting spaces where great food and good company come together.

Contact Still Hopes Episcopal Retirement Community

Health Inspection History

Inspections since 2022
Total health inspections 4

South Carolina average 3.9


Last Health inspection on Jun 2025

Total health citations
5 Rank #14 / 122Health citations — State benchmarkedThis home is ranked 14th out of 122 homes in South Carolina. Shows this facility's total health deficiency citations benchmarked to the South Carolina State average, with a ranking across all 122 SC facilities. Lower citation counts earn a better rank.Rankings are based only on facilities in South Carolina that report data for that category. Facilities without available data are excluded from the ranking.Click the rank badge to see the full State ranking.Click here to see the full State ranking.

South Carolina average 13.7

Citations per inspection
1.25 Rank #3 / 122Citations per inspection — State benchmarkedThis home is ranked 3rd out of 122 homes in South Carolina. Shows average deficiency citations per CMS inspection for this facility versus the South Carolina mean across 122 facilities with citation data. Lower is better.Rankings are based only on facilities in South Carolina that report data for that category. Facilities without available data are excluded from the ranking.Click the rank badge to see the full State ranking.Click here to see the full State ranking.

South Carolina average 3.44


Health citations are formal notices following inspections when they fail to comply with safety and care standards.

4 of 5 citations resulted from standard inspections; and 1 of 5 resulted from complaint investigations.

Breakdown of citation severity (last 4 years)
Critical health citations
1
In line with South Carolina average

South Carolina average: 1


Serious health citations
0
100% better than South Carolina average

South Carolina average: 0.3

1 critical citation South Carolina average: 1

0 serious citations South Carolina average: 0.3

4 moderate citations South Carolina average: 12.3

0 minor citations South Carolina average: 0.1
Citations history (last 4 years)
Pharmacy moderate citation Jun 12, 2025
Corrected

Infection Control moderate citation Apr 17, 2024
Corrected

Pharmacy critical citation Feb 17, 2023
Corrected

Infection Control moderate citation Feb 25, 2022
Corrected

Staffing Data

Reporting period: October 1 – December 31, 2025 (Q4 2025). Source: CMS Payroll-Based Journal report.

Total staff 123
Employees 108
Contractors 15
Staff to resident ratio 5.59 : 1
204% more staff per resident than South Carolina average
South Carolina average ratio: 1.84 : 1 South Carolina average ratio: 1.84 : 1See full South Carolina ranking
Avg staff/day 33
Average shift 5.8 hours
27% worse than South Carolina average
South Carolina average: 7.9 hours South Carolina average shift: 7.9 hoursSee full South Carolina ranking
Total staff hours (quarter) 17,561

Nursing staff breakdown

Q4 2025 · Oct 1 – Dec 31 More info This data comes from the CMS Payroll-Based Journal report covering October 1 – December 31, 2025.
Registered Nurse

Manages medical care and health needs.

RN Staff Info All 19 RN Staff are full-time employees. No contractors work on this role. 19
Average shift length Info Average shift length. Calculated as total hours divided by days worked and average staff per day. 7.9 hours
Licensed Practical Nurse

Assists with medical care and medications.

LPN Staff Info All 17 LPN Staff are full-time employees. No contractors work on this role. 17
Average shift length Info Average shift length. Calculated as total hours divided by days worked and average staff per day. 8.7 hours
Certified Nursing Assistant

Helps with daily care and mobility.

CNA Staff Info All 43 CNA Staff are full-time employees. No contractors work on this role. 43
Average shift length Info Average shift length. Calculated as total hours divided by days worked and average staff per day. 7.4 hours

Contractor staffing

Q4 2025 · Oct 1 – Dec 31 More info This data comes from the CMS Payroll-Based Journal report covering October 1 – December 31, 2025.

Total hours from contractors

14.6%

2,558 contractor hours this quarter

Speech Language Pathologist: 4 Respiratory Therapy Technician: 3 Physical Therapy Aide: 2 Diagnostic X-ray Services Staff: 2 Physical Therapy Assistant: 2 Qualified Social Worker: 1 Occupational Therapy Assistant: 1

Staff by category

Q4 2025 · Oct 1 – Dec 31 More info This data comes from the CMS Payroll-Based Journal report covering October 1 – December 31, 2025.
Certified Nursing Assistant430437,33192100%7.4
Registered Nurse190193,06592100%7.9
Licensed Practical Nurse170172,2799199%8.7
Speech Language Pathologist0441,1357683%4.8
Clinical Nurse Specialist2002066492100%1.4
Dietitian3034205863%6.8
RN Director of Nursing1014045155%7.9
Dental Services Staff1014045459%7.5
Physical Therapy Aide0223936571%6
Physical Therapy Assistant0223855762%6.7
Qualified Social Worker0113126065%5.2
Respiratory Therapy Technician0332296874%2.8
Nurse Practitioner1011697177%2.4
Occupational Therapy Aide1011546065%2.6
Administrator101996874%1.5
Diagnostic X-ray Services Staff022721820%4
Occupational Therapy Assistant011334145%0.8
Other Dietary Services Staff101122527%0.5
43 Certified Nursing Assistant
% of Days 100%
19 Registered Nurse
% of Days 100%
17 Licensed Practical Nurse
% of Days 99%
4 Speech Language Pathologist
% of Days 83%
20 Clinical Nurse Specialist
% of Days 100%
3 Dietitian
% of Days 63%
1 RN Director of Nursing
% of Days 55%
1 Dental Services Staff
% of Days 59%
2 Physical Therapy Aide
% of Days 71%
2 Physical Therapy Assistant
% of Days 62%
1 Qualified Social Worker
% of Days 65%
3 Respiratory Therapy Technician
% of Days 74%
1 Nurse Practitioner
% of Days 77%
1 Occupational Therapy Aide
% of Days 65%
1 Administrator
% of Days 74%
2 Diagnostic X-ray Services Staff
% of Days 20%
1 Occupational Therapy Assistant
% of Days 45%
1 Other Dietary Services Staff
% of Days 27%

Penalties and fines

Federal penalties imposed by CMS for regulatory violations, including civil money penalties (fines) and denials of payment for new Medicare/Medicaid admissions.

Source: CMS Penalties Database (Data as of Jan 2026)

Total fines amount $13K Rank #1 / 123Federal fines — State benchmarkedThis home is ranked 1st out of 123 homes in South Carolina. Shows this facility's cumulative CMS federal fine dollars versus the South Carolina average among facilities with fines, and where it ranks among 123 facilities in the pool. Lower total dollars mean a better rank.Rankings are based only on facilities in South Carolina that report data for that category. Facilities without available data are excluded from the ranking.Click the rank badge to see the full State ranking.Click here to see the full State ranking.
62% lower than South Carolina average

South Carolina average: $34K

Number of fines 1
59% fewer fines than South Carolina average

South Carolina average: 2.4

Payment Denials Info Serious action where Medicare and/or Medicaid temporarily stops payments for new residents until issues are fixed. 0
100% fewer payment denials than South Carolina average

South Carolina average: 0.1

Fines amount comparison
This facility $13K
South Carolina average $34K

No penalties in the past 3 years

No civil money penalties or payment denials were reported in the last 3 years.

Quality of care over time

These measures show how residents usually do over time at this home, based on health outcomes and preventive care.

Short-stay resident measures
Significantly above average South Carolina avg: 2.8 Info CMS star rating based on short-stay quality measure performance. 5 stars = much above average, 1 star = much below average.
Pneumococcal Vaccine Info Percent of short-stay residents assessed and appropriately given the pneumococcal vaccine 97.6%
23% better than South Carolina average

South Carolina average: 79.5%

Antipsychotic medication increase Info Percent of short-stay residents who newly received an antipsychotic medication 1.6%
6% better than South Carolina average

South Carolina average: 1.7%

Influenza Vaccine Info Percent of short-stay residents assessed and appropriately given the seasonal influenza vaccine 94.3%
21% better than South Carolina average

South Carolina average: 78.0%

Re-hospitalized after SNF stay Info Percentage of short-stay residents who were re-hospitalized after their nursing home admission. 16.5%
33% better than South Carolina average

South Carolina average: 24.7%

Emergency department visits Info Percentage of short-stay residents who had an outpatient emergency department visit. 11.5%
18% better than South Carolina average

South Carolina average: 14.1%

Falls with major injury Info Percentage of SNF residents who experience falls with major injury during their stay. 1.0%
26% worse than South Carolina average

South Carolina average: 0.8%

Ability to care for self at discharge Info Percentage of residents at or above expected ability to care for themselves at discharge. 63.3%
18% better than South Carolina average

South Carolina average: 53.7%

Successful return to home or community Info Rate of successful return to home or community from a skilled nursing facility. 69.7%
38% better than South Carolina average

South Carolina average: 50.6%

Breakdown by payment type

Medicare

84% of new residents, usually for short-term rehab.

Typical stay 23 days

Private pay

16% of new residents, often for short stays.

Typical stay 1 years

Facility Characteristics

Source: CMS Long-Term Care Facility Characteristics (Data as of Jan 2026)

Total residents 22
Medicare
18
81.8% of residents
Private pay or other
4
18.2% of residents
Programs & Services
Residents Group

Residents meet regularly to discuss policies, care quality, and activities

Family Member Group

Family members meet regularly to discuss policies, care quality, and activities

CCRC

Part of a Continuing Care Retirement Community offering multiple care levels

Active Family Council

Organized group of family members that meets regularly to discuss facility policies, resident care, and activities.

Active Resident Council

Organized group of residents that meets regularly to discuss facility policies, quality of life, and activities.

Finances and operations

Based on CMS SNF Cost Report for fiscal year ending in 09/2023.

Nonprofit
Nonprofit Corporation
Net patient revenue Info Net patient revenue — what the home actually collects for resident care, after contractual allowances, bad debt and discounts are subtracted from its gross charges (CMS cost report, Worksheet G-3). It covers resident care only; money the home earns from other sources is shown separately as "Other income."
$28.0M
Net patient income Info Net patient income: net patient revenue minus the home's total operating expenses. A positive figure means it earns more from resident care than it spends to deliver it; a negative figure means the opposite. It excludes non-operating "other income."
-$19.2M
Nonprofit Nonprofit Corporation
Net patient revenue Info Net patient revenue — what the home actually collects for resident care, after contractual allowances, bad debt and discounts are subtracted from its gross charges (CMS cost report, Worksheet G-3). It covers resident care only; money the home earns from other sources is shown separately as "Other income."
$28.0M Rank #2 / 125Revenue — State benchmarkedThis home is ranked 2nd out of 125 homes in South Carolina. Shows this facility's annual revenue compared to the South Carolina average. Higher revenue generally means more resources for staffing and capital — read alongside Payroll %.Rankings are based only on facilities in South Carolina that report data for that category. Facilities without available data are excluded from the ranking.Click the rank badge to see the full State ranking.Click here to see the full State ranking.
Net patient income Info Net patient income: net patient revenue minus the home's total operating expenses. A positive figure means it earns more from resident care than it spends to deliver it; a negative figure means the opposite. It excludes non-operating "other income."
-$19.2M
Other income Info Money the home earns outside of resident care — such as investments, grants, rentals and other non-operating sources (CMS cost report, Worksheet G-3). It is tracked separately from net patient revenue: it is not part of that figure, and it is not included in net patient income.
$16.6M
Payroll costs Info Staff salaries plus wage-related costs — benefits such as payroll taxes, health insurance and retirement — from the home's own accounting records (CMS cost report, Worksheet A). Contract or agency labor is counted separately, under other operating costs. Rank #3 / 125Payroll — State benchmarkedThis home is ranked 3rd out of 125 homes in South Carolina. Shows total annual staff payroll benchmarked to the South Carolina average. Higher payroll investment relative to peers often signals better staffing and less reliance on cheaper contract labor.Rankings are based only on facilities in South Carolina that report data for that category. Facilities without available data are excluded from the ranking.Click the rank badge to see the full State ranking.Click here to see the full State ranking.
$23.0M 82.2% of net patient revenue Info Payroll as a share of revenue: staff salaries and wage-related benefits divided by net patient revenue. A higher figure means more of each revenue dollar goes to staff pay. Rank #41 / 125Payroll % — State benchmarkedThis home is ranked 41st out of 125 homes in South Carolina. Shows payroll as a percentage of revenue versus the South Carolina average. Well-run South Carolina facilities typically land around 53–64% — the top third Statewide. Below 25% may signal understaffing or heavy agency use — read with Staffing ratings.Rankings are based only on facilities in South Carolina that report data for that category. Facilities without available data are excluded from the ranking.Click the rank badge to see the full State ranking.Click here to see the full State ranking.
Other operating costs Info Everything it costs to run the home apart from payroll — food, utilities, supplies, maintenance, contract labor and administration. Calculated as total operating expense minus payroll (staff salaries and wage-related benefits).
$24.1M
Total costs Info The home's total operating expense for the year — all the costs of running it, salaries included (CMS cost report, Worksheet G-3).
$47.2M

What does this home offer?

Pets allowed icon
Pets allowed icon

Pets Allowed

Building type icon
Building type icon

Building Type: Mid-rise

Transportation services icon

Transportation Services

Fitness and recreation icon

Fitness and Recreation

Who this home usually serves

TYPE OF STAY

Mostly short-term rehab stays

Most residents typically stay for a few weeks or months before returning home or moving on.

Most new residents arrive under Medicare (84% of admissions), and a typical Medicare stay runs around 23 days.

Admissions
266 total

Coverage residents most often arrive under.

Medicare 84%
Private pay 16%
Discharges
259 total

Coverage residents most often leave under.

Medicare 76%
Private pay 24%

Places of interest near Still Hopes Episcopal Retirement Community

Address 2.6 miles from city center Info Estimated distance in miles from West Columbia's city center to Still Hopes Episcopal Retirement Community's address, calculated via Google Maps.

Calculate Travel Distance to Still Hopes Episcopal Retirement Community

Add your location

Address

Compare Nursing Homes around Columbia

The information below is reported by the South Carolina Department of Public Health, Bureau of Healthcare Quality.

5 facilities compared · CMS & SC Dept. of Health data

Still Hopes Episcopal Retirement Community
NH
AL
IL
MC
West Columbia (Still Hopes Drive)
22
Facility 22
SC AVG 90
Rank #303 / 309
89.1%
Facility 89.1%
SC AVG 82.1%
Rank #38 / 131
+9%- +65%-
$0
Facility $0
SC AVG $34.8k
Rank #1 / 123
5
Facility 5
SC AVG 13.7
Rank #14 / 122
1.3
Facility 1.3
SC AVG 3.4
Rank #3 / 122
121A+
63
Facility 63
SC AVG 32
Rank #14 / 232
Frances Case
$28.0M
Facility $28.0M
SC AVG $13.0M
Rank #2 / 125
$23.0M
Facility $23.0M
SC AVG $5.4M
Rank #3 / 125
82.2%
Facility 82.2%
SC AVG 44%
Rank #41 / 125
425401
Wildewood Downs Retirement Community
NH
AL
IL
MC
Columbia (Williamsburg East)
57
Facility 57
SC AVG 90
Rank #229 / 309
28.1%
Facility 28.1%
SC AVG 82.1%
Rank #127 / 131
-66%
5.41
Facility 5.41
SC AVG 4.00
Rank #10 / 121
+300%+35%
$3.7k
Facility $3.7k
SC AVG $34.8k
Rank #56 / 123
13
Facility 13
SC AVG 13.7
Rank #71 / 122
4.3
Facility 4.3
SC AVG 3.4
Rank #92 / 122
-16A+
33
Facility 33
SC AVG 32
Rank #119 / 232
Diana Chavis
$6.6M
Facility $6.6M
SC AVG $13.0M
Rank #38 / 125
$6.1M
Facility $6.1M
SC AVG $5.4M
Rank #59 / 125
92.9%
Facility 92.9%
SC AVG 44%
Rank #101 / 125
425385
PruittHealth Columbia
NH
AL
Columbia
185
Facility 185
SC AVG 90
Rank #6 / 309
80.8%
Facility 80.8%
SC AVG 82.1%
Rank #86 / 131
-2%
3.17
Facility 3.17
SC AVG 4.00
Rank #103 / 121
-20%-21%
$102.0k
Facility $102.0k
SC AVG $34.8k
Rank #121 / 123
26
Facility 26
SC AVG 13.7
Rank #112 / 122
3.7
Facility 3.7
SC AVG 3.4
Rank #75 / 122
2136-
24
Facility 24
SC AVG 32
Rank #147 / 232
United Health Services Of South Carolina Inc
$12.6M
Facility $12.6M
SC AVG $13.0M
Rank #52 / 125
$7.8M
Facility $7.8M
SC AVG $5.4M
Rank #42 / 125
62.3%
Facility 62.3%
SC AVG 44%
Rank #62 / 125
425013
The Oaks of Orangeburg
NH
AL
HC
IL
Orangeburg (Felder)
122
Facility 122
SC AVG 90
Rank #61 / 309
76.8%
Facility 76.8%
SC AVG 82.1%
Rank #95 / 131
-6%
2.98
Facility 2.98
SC AVG 4.00
Rank #114 / 121
-59%-25%
$111.7k
Facility $111.7k
SC AVG $34.8k
Rank #122 / 123
23
Facility 23
SC AVG 13.7
Rank #107 / 122
4.6
Facility 4.6
SC AVG 3.4
Rank #97 / 122
1115A+
0
Facility 0
SC AVG 32
Rank #229 / 232
Joseph Fowler
$11.0M
Facility $11.0M
SC AVG $13.0M
Rank #67 / 125
$7.3M
Facility $7.3M
SC AVG $5.4M
Rank #51 / 125
66.3%
Facility 66.3%
SC AVG 44%
Rank #35 / 125
425131
The Brian Center Nursing Care – St. Andrews
NH
AL
IL
MC
Columbia (Seven Oaks)
108
Facility 108
SC AVG 90
Rank #98 / 309
28.7%
Facility 28.7%
SC AVG 82.1%
Rank #126 / 131
-65%
4.07
Facility 4.07
SC AVG 4.00
Rank #42 / 121
+36%+2%
$41.0k
Facility $41.0k
SC AVG $34.8k
Rank #113 / 123
41
Facility 41
SC AVG 13.7
Rank #121 / 122
6.8
Facility 6.8
SC AVG 3.4
Rank #120 / 122
431A+
14
Facility 14
SC AVG 32
Rank #178 / 232
-
$7.9M
Facility $7.9M
SC AVG $13.0M
Rank #103 / 125
$4.6M
Facility $4.6M
SC AVG $5.4M
Rank #102 / 125
58.5%
Facility 58.5%
SC AVG 44%
Rank #48 / 125
425129

Financial Assistance for
Nursing Home in South Carolina

Still Hopes Episcopal Retirement Community is located in West Columbia, South Carolina.
Here are the financial assistance programs available to residents in South Carolina.

Get Financial aid guidance

Community Long Term Care (CLTC)

SC Medicaid CLTC

Age 65+ or disabled
General South Carolina resident, Medicaid-eligible, nursing home-level care need.
Income Limits (2025) ~$2,829/month 300% FBR, individual
Asset Limits $2,000 (individual), $3,000 (couple).
SC

High rural demand; waitlists possible.

Benefits
Personal care (5-7 hours/day) Respite (240 hours/year) Adult day care ($60/day) Home modifications ($1,500 avg.)

South Carolina Respite Care Program

SC NFCSP Respite

Age Caregiver of someone 60+ (or with dementia)
General South Carolina resident.
Income Limits No strict limit; prioritizes low-income.
Asset Limits Not applicable.
SC

Limited slots; rural/urban balance.

Benefits
In-home respite (4-6 hours/day) Adult day care (~$60/day) Short-term facility care (up to 5 days)

Medicare Savings Program (MSP)

South Carolina Medicare Savings Program

Age 65+ or disabled
General SC resident, Medicare Part A/B.
Income Limits (2025) ~$2,510/month (QMB), ~$3,380/month (SLMB), ~$3,598/month (QI)—individual.
Asset Limits $9,430 (individual), $14,130 (couple).
SC

Three tiers; includes Extra Help for Part D; no waitlist.

Benefits
Covers Part B premiums ($174.70/month) Deductibles ($240/year) Copays (~20%)

VA Aid and Attendance (A&A) and Housebound Benefits

South Carolina VA Aid and Attendance/Housebound

Age 65+ or disabled veteran/spouse
General SC resident, wartime service, need for ADL help (A&A) or homebound.
Income Limits (2025) Net income < ~$1,984/month (veteran with dependent, A&A); pension offsets income.
Asset Limits ~$155,356 net worth limit
SC

High veteran population; supports rural/urban care needs.

Benefits
Cash (~$1,433-$2,642/month veteran, ~$951-$1,318 spouse) for care costs (e.g., in-home, assisted living)

Senior Farmers’ Market Nutrition Program (SFMNP)

South Carolina SFMNP

Age 60+
General SC resident, low-income.
Income Limits (2025) ~$2,322/month individual, 185% FPL
Asset Limits Not assessed.
SC

Vouchers (~$50/season); serves ~20,000 annually via 10 AAAs.

Benefits
Vouchers (~$50/season) for fresh produce at approved markets

Homestead Exemption Program

South Carolina Homestead Exemption

Age 65+ (or disabled/blind)
General SC resident 1+ year, homeowner.
Income Limits (2025) None; tax-based eligibility.
Asset Limits Not assessed; home-focused.
SC

Saves ~$500-$1,000/year avg.; applies to primary residence.

Benefits
Property tax exemption (~$50,000 value, ~$500-$1,000/year savings)

Elderly Simplified Application Project (ESAP)

South Carolina ESAP (SNAP for Seniors)

Age 60+
General SC resident, no earned income, not on SCCAP.
Income Limits (2025) ~$1,732/month 133% FPL, individual
Asset Limits $4,250 individual, higher than standard SNAP
SC

Simplified process; serves ~50,000 seniors annually.

Benefits
EBT card for food (~$100-$300/month based on income)

Frequently Asked Questions about Still Hopes Episcopal Retirement Community

What neighborhood is Still Hopes Episcopal Retirement Community in?

Still Hopes Episcopal Retirement Community is in the Still Hopes Drive neighborhood of West Columbia.

Is Still Hopes Episcopal Retirement Community in a walkable area?

Still Hopes Episcopal Retirement Community has a walk score of 63. Moderately walkable. Some errands can be accomplished on foot, with a mix of nearby amenities.

What is the occupancy rate at Still Hopes Episcopal Retirement Community?

Still Hopes Episcopal Retirement Community's occupancy is 89.1%.

Does Still Hopes Episcopal Retirement Community have different floorplan options?

Yes — see the floorplan options available at Still Hopes Episcopal Retirement Community on this page.

Does Still Hopes Episcopal Retirement Community operate as a for-profit or non-profit?

Still Hopes Episcopal Retirement Community is registered as a non-profit in SC.

Are there photos of Still Hopes Episcopal Retirement Community?

Yes — there are 23 photos of Still Hopes Episcopal Retirement Community in the photo gallery on this page.

What is the address of Still Hopes Episcopal Retirement Community?

Still Hopes Episcopal Retirement Community is located at 1 Still Hopes Dr, West Columbia, SC 29169.

Guides for Better Senior Living

Care Cost Calculator: See Prices in Your Area

Nursing Home Data Explorer

Don’t Wait Too Long: 7 Red Flag Signs Your Parent Needs Assisted Living Now

The True Cost of Assisted Living in 2025 – And How Families Are Paying For It

Understanding Senior Living Costs: Pricing Models, Discounts & Financial Assistance