


Mostly short-term rehab stays
Most residents typically stay for a few weeks or months before returning home or moving on.
Most new residents arrive under Medicare (55% of admissions), and a typical Medicare stay runs around 1 - 2 months.
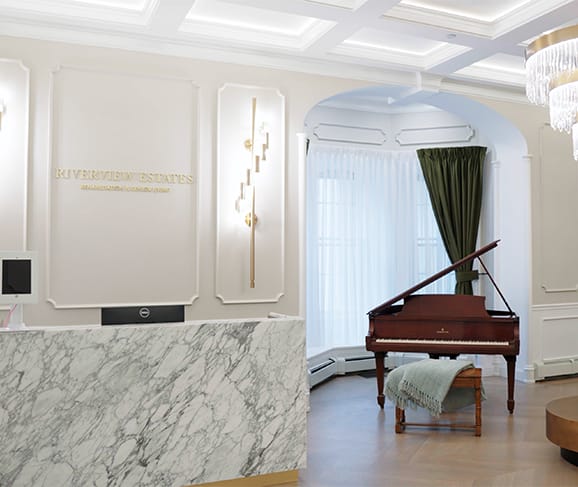
Riverview Estates Rehab and Senior Living Center sits at 303 Bank Ave in Riverton, New Jersey, offering nursing home, assisted living, palliative care, respite, and skilled nursing services under one roof. The facility overlooks the Delaware River and sits in a moderately walkable neighborhood, with a Walk Score of 65 that means some errands can be handled on foot alongside a mix of nearby amenities. Ms. Toni Rembas administers the community.
The building holds 66 beds and is currently operating at 73% occupancy, with 48 residents in place. That combination of scale and available capacity gives incoming residents and their families some flexibility in timing a move.
Clinically, the facility centers its care around rehabilitation. Residents have access to subacute rehabilitation, orthopedic rehabilitation, and cardiac care, along with general rehabilitation services and short-term rehab for those recovering from a hospital stay or procedure. Respite care is available for families who need temporary coverage, and staffing runs 24 hours a day. Nursing staff provide close to five hours of combined care per resident each day, with registered nurses and licensed practical nurses each contributing coverage alongside nurse aides, who handle the largest share of daily hands-on time.
The community accepts Medicare, Medicaid, and private pay, giving families several ways to structure the cost of care.
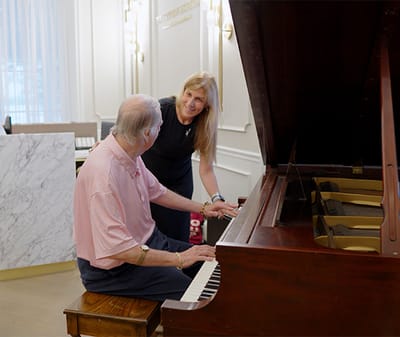
Daily life includes a full calendar of activities and local field trips, along with amenities like a landscaped courtyard and atrium garden, two porches with river views, a beauty and barber salon, and complimentary cable and Wi-Fi. Meals are served in an atrium dining room. Weekly religious services and out-of-facility transportation round out the offering, and a patient concierge is available to help residents and visitors navigate day to day needs.
State inspections of the facility have covered a range of standard regulatory areas, including medication management, infection prevention, fire-safety systems, staffing credentials, and care planning and documentation, consistent with the routine scope of nursing home oversight.
Riverview Estates Rehab And Senior Living Center is administered by Ms. Toni Rembas.
In New Jersey, the Department of Health, Health Facilities Evaluation and Licensing conducts mandatory unannounced surveys to ensure facilities provide safe and effective resident care.
Deficiencies
| This Facility | NJ Average | vs. NJ Avg |
|---|---|---|---|
|
Total deficiencies
| 32 | 18 | This facility has 78% more total deficiencies than a typical New Jersey nursing home (32 vs. NJ avg 18).↑ 78% worse |
Inspections
| This Facility | NJ Average | vs. NJ Avg |
|---|---|---|---|
|
Total inspections
| 12 | 9 | This facility has had 33% more total inspections than the New Jersey average (12 vs. NJ avg 9). More inspections can mean more regulatory scrutiny rather than worse care.↑ 33% more |
|
Routine inspections
| 11 | 4 | This facility has had 175% more routine inspections than the New Jersey average (11 vs. NJ avg 4). More inspections can mean more regulatory scrutiny rather than worse care.↑ 175% more |
|
Complaint investigations
| 1 | 3 | This facility has had 67% fewer complaint investigations than the New Jersey average (1 vs. NJ avg 3). More inspections can mean more regulatory scrutiny rather than worse care.↓ 67% fewer |
Federal inspection data published by CMS, covering this home's Medicare and/or Medicaid-certified skilled-nursing/nursing beds only.
State average 4
Last Health inspection on Sep 2024
State average 20.9
State average 5.35
Health citations are formal notices following inspections when they fail to comply with safety and care standards.
12 of 17 citations resulted from standard inspections; and 5 of 17 came from combined inspections (standard and complaint).
State average: 0.7
State average: 0.4
Reporting period: October 1 – December 31, 2025 (Q4 2025). Source: CMS Payroll-Based Journal report.
Manages medical care and health needs.
Assists with medical care and medications.
Helps with daily care and mobility.
Total hours from contractors
24 contractor hours this quarter
| Certified Nursing Assistant | 46 | 0 | 46 | 13,096 | 92 | 100% | 8.2 |
| Licensed Practical Nurse | 20 | 0 | 20 | 6,568 | 92 | 100% | 8.4 |
| Registered Nurse | 7 | 0 | 7 | 3,418 | 92 | 100% | 8.3 |
| Dietitian | 3 | 0 | 3 | 905 | 80 | 87% | 7.1 |
| Other Dietary Services Staff | 6 | 0 | 6 | 847 | 73 | 79% | 6.6 |
| Nurse Practitioner | 1 | 0 | 1 | 512 | 64 | 70% | 8 |
| Speech Language Pathologist | 2 | 0 | 2 | 511 | 64 | 70% | 6.9 |
| Physical Therapy Assistant | 4 | 0 | 4 | 498 | 69 | 75% | 6.7 |
| Qualified Social Worker | 3 | 0 | 3 | 498 | 64 | 70% | 7.6 |
| Physical Therapy Aide | 2 | 0 | 2 | 489 | 69 | 75% | 6.5 |
| Respiratory Therapy Technician | 1 | 0 | 1 | 488 | 61 | 66% | 8 |
| Administrator | 1 | 0 | 1 | 480 | 60 | 65% | 8 |
| Mental Health Service Worker | 1 | 0 | 1 | 464 | 58 | 63% | 8 |
| Clinical Nurse Specialist | 2 | 0 | 2 | 209 | 28 | 30% | 7.5 |
| Medical Director | 0 | 1 | 1 | 16 | 2 | 2% | 8 |
| Occupational Therapy Assistant | 0 | 1 | 1 | 8 | 1 | 1% | 8 |
Includes penalties issued in 2023
Federal penalties imposed by CMS for regulatory violations, including civil money penalties (fines) and denials of payment for new Medicare/Medicaid admissions.
Source: CMS Penalties Database (Data as of Jan 2026)
Penalties are imposed by CMS for violations of federal nursing home regulations.
1 penalty in the past 3 years
Oct 30, 2023 · $38K
Last updated: Jan 2026
These measures show how residents usually do over time at this home, based on health outcomes and preventive care.
55% of new residents, usually for short-term rehab.
43% of new residents, often for short stays.
2% of new residents, often for long-term daily care.
Source: CMS Long-Term Care Facility Characteristics (Data as of Jan 2026)
Residents meet regularly to discuss policies, care quality, and activities
Family members meet regularly to discuss policies, care quality, and activities
Organized group of family members that meets regularly to discuss facility policies, resident care, and activities.
Organized group of residents that meets regularly to discuss facility policies, quality of life, and activities.
Historical financial and operational data for Riverview Estates Rehab And Senior Living Center from 2011–2023, based on CMS SNF Cost Reports.
Key figures below are for fiscal year ending in 12/2023.
Based on CMS SNF Cost Report for fiscal year ending in 12/2023.
Most residents typically stay for a few weeks or months before returning home or moving on.
Most new residents arrive under Medicare (55% of admissions), and a typical Medicare stay runs around 1 - 2 months.
Coverage residents most often arrive under.
Coverage residents most often leave under.
0.0 miles from city center
Estimated distance in miles from Riverton's city center to Riverview Estates Rehab And Senior Living Center's address, calculated via Google Maps.
Add your location
Info below is compiled from CMS reports & the NJ Dept. of Health (NJDOH), senior community websites & trusted data sources such as Walk Score & BBB.
Communities are listed from highest to lowest based on our ranking methodology.
The facility name. Click to view the full profile page on Assisted Living Magazine, including photos, services, and contact info.
|
CMS (Centers for Medicare & Medicaid Services, the federal agency that regulates nursing homes) Overall 5-star rating — a composite of Health Inspection, Staffing, and Quality Measures scores. 5 stars = top 10% nationally. 1 star = bottom 10%. The single most important number to start with when comparing facilities.
|
Care Types in This Table
AL (Assisted Living):
Housing with help for daily activities like bathing, dressing, and medication, without 24-hour skilled nursing.
NH (Nursing Home):
24/7 skilled nursing care for residents with complex, ongoing medical needs.
SNF (Skilled Nursing Facility):
Round-the-clock nursing care, often for recovery after surgery, injury, or illness.
MC (Memory Care):
Secured, specialized care for people living with Alzheimer's or dementia.
RC (Respite Care):
Short-term temporary care that gives family caregivers a break.
IL (Independent Living):
Community living with dining, activities, and transportation for active seniors who need little personal care.
HC (Home Care):
Professional care delivered in the person's own home, from companionship to skilled nursing.
HOS (Hospice Care):
Comfort-focused care for those with a terminal illness, prioritizing quality of life over treatment.
PC (Palliative Care):
|
Neighborhood or city area where the facility is located. Proximity to family, hospitals, and green space matters for both quality of life and ease of visitation. Consider drive time and transit access when evaluating location.
|
Licensed bed capacity. Larger facilities (300+ beds) often have more specialized programs but can feel institutional. Smaller homes (under 150 beds) tend to deliver more personalized care. Compare with Avg Res/Day to understand how full the facility typically runs.
|
Percentage of licensed beds filled on an average day. Color indicates financial health: green (90%+) = operationally strong, typically profitable. Amber (80–89%) = stable but leaving revenue on the table. Orange (70–79%) = financial strain likely, may struggle with fixed costs. Red (<70%) = significant distress, closure or ownership change risk increases sharply.
|
This facility's occupancy rate compared to the statewide average for similar facilities. A positive number means above-average demand. Facilities running 5%+ above the state average are typically the most sought-after in their market — a strong proxy for reputation.
|
CMS-adjusted total nurse hours per resident per day (RN + LPN + CNA combined). The national average is approximately 3.5 hrs. Higher is better — more direct care time per resident. Below 3.0 is a red flag. CMS weights RN hours more heavily because RNs handle complex clinical decisions that CNAs cannot.
|
CMS Health Inspection star rating (1–5 stars), based on the 3 most recent annual state surveys plus any complaint investigations. This is the hardest rating to manipulate — it reflects real surveyor findings on-site. 5 stars = fewest deficiencies found. 1 star = most. It carries the heaviest weight in the Overall CMS rating.
|
CMS Staffing star rating (1–5 stars), based on daily nurse staffing hours submitted to CMS via verified payroll data. Compares RN, LPN, and CNA coverage relative to resident acuity level. 5 stars = well above expected staffing. Weekend staffing is evaluated separately, as that's where many facilities quietly reduce coverage.
|
CMS Quality Measures star rating (1–5 stars), based on 15 clinical outcome metrics including fall rates, pressure ulcers, antipsychotic drug use, and hospital readmissions. Captures actual resident health outcomes, not just compliance. High QM combined with low Health Inspection scores can indicate a facility with strong care but weak documentation practices.
|
Registered Nurse hours per resident/day compared to the statewide average. RNs are the highest-skilled nursing staff — they assess residents, manage medications, and respond to emergencies. A value of +50% means RN coverage is 50% above the state norm. Negative values are a concern for residents with complex or acute medical needs.
|
Total nursing staff hours (RN + LPN + CNA combined) per resident/day vs. the statewide average. A broader measure than RN vs State — it captures the entire care team. A facility can have high total staffing but low RN hours, meaning more aides and fewer nurses. Read both columns together for the full picture.
|
Total dollar amount of federal monetary fines (civil money penalties) issued by CMS in the past 3 years. Fines are only levied for serious violations — typically actual harm to residents, repeated uncorrected deficiencies, or systemic non-compliance. Even a single fine is noteworthy. Multiple fines strongly suggest a pattern, not isolated incidents.
|
Total health deficiency citations from the most recent standard inspection cycle. Minor citations (scope A–C) are common and often administrative in nature. Higher counts aren't always disqualifying, but should be read alongside Severe Citations to understand actual harm levels. Under 10 is strong for a large facility; 30+ warrants a closer look.
|
Average deficiency citations per CMS inspection (survey) in the reporting window — total citations divided by the number of inspections. Lower is better; compare alongside total Citations and Severe Citations for context.
|
Citations at CMS scope/severity level D or higher — meaning actual harm occurred or residents were placed in immediate jeopardy. Examples include unaddressed falls, medication errors causing injury, neglect, or abuse.
|
Average number of residents in the building on any given day, derived from annual census data. Reflects true operating scale — a 400-bed facility running 200 residents/day operates very differently from one at 390. Higher resident counts generally mean more funded staffing hours.
|
Better Business Bureau rating (A+ to F). Reflects complaint history, business transparency, and how family disputes were resolved. A+ means no significant unresolved complaints. A blank (—) means the facility isn't BBB-accredited, which is common for healthcare providers and not necessarily a negative signal.
|
Walk Score® (0–100). Measures walkability of the surrounding area. 90–100 = Walker's Paradise. 70–89 = Very Walkable. 50–69 = Somewhat Walkable. Below 50 = Car-Dependent. Higher scores benefit family visitors, resident outings, and staff commuting.
|
The licensed owner or operator of record filed with CMS — the individual or organization legally accountable for the facility. Searching the operator name across other facilities can reveal chain or multi-site ownership, which matters: chain-operated homes tend to have more variable quality outcomes than independently run facilities.
|
What the home actually collects for resident care, after contractual allowances, bad debt and discounts — not gross billings. Taken from the latest complete annual cost report, so it is comparable across homes reporting the same period. Revenue alone doesn't indicate care quality, but it funds staffing and capital reinvestment. Pair with Payroll %. Figures are from each facility's most recent complete fiscal year — hover a value for the exact year; a * marks homes that report an older period than most facilities.
|
Staff salaries plus wage-related benefits from the latest complete annual cost report. Contract and agency labour is counted separately, under other operating costs, so a home leaning on agency staff can show a low figure here. Payroll is the cost most directly tied to care quality — compare with Payroll % for full context. Figures are from each facility's most recent complete fiscal year — hover a value for the exact year; a * marks homes that report an older period than most facilities.
|
Payroll as a share of NET PATIENT REVENUE (not gross revenue). Both figures come from the same cost-report year. A higher figure means more of each revenue dollar goes to staff pay. Read with the Staffing star rating to judge whether spend translates into coverage — and note that homes whose patient revenue covers only part of their operation can read implausibly high. The New Jersey average is: 51.1% Figures are from each facility's most recent complete fiscal year — hover a value for the exact year; a * marks homes that report an older period than most facilities.
|
CMS Certification Number: the unique federal identifier for this skilled nursing provider.
|
|---|---|---|---|---|---|---|---|---|---|---|---|---|---|---|---|---|---|---|---|---|---|---|---|---|
| Job Haines Home | NH AL HC RC SNF | Bloomfield | 40
Facility
40
NJ AVG
125
Rank
#529 / 560 |
97.5%
Facility
97.5%
NJ AVG
74.5
Rank
#15 / 478 | +31% | 6.31
Facility
6.31
NJ AVG
3.88
Rank
#3 / 284 | -2% | +63% | $0
Facility
$0
NJ AVG
$76.4k
Rank
#1 / 287 | 4
Facility
4
NJ AVG
20.9
Rank
#7 / 286 | 1.3
Facility
1.3
NJ AVG
5.3
Rank
#4 / 286 | - | 39 | - |
85
Facility
85
NJ AVG
48
Rank
#62 / 629 | Noreen Haveron | $11.8MFiscal year ending 12/2023
Facility
$11.8MFiscal year ending 12/2023
NJ AVG
$17.8M
Rank
#205 / 257 | $12.4MFiscal year ending 12/2023
Facility
$12.4MFiscal year ending 12/2023
NJ AVG
$8.7M
Rank
#32 / 257 | 105.4%Fiscal year ending 12/2023
Facility
105.4%Fiscal year ending 12/2023
NJ AVG
51.1%
Rank
#6 / 257 | 315392 | ||||
| Fellowship Village | NH AL HC HOS IL MC SNF | Basking Ridge | 67
Facility
67
NJ AVG
125
Rank
#470 / 560 |
86.6%
Facility
86.6%
NJ AVG
74.5
Rank
#150 / 478 | +16% | 5.83
Facility
5.83
NJ AVG
3.88
Rank
#10 / 284 | +57% | +50% | $0
Facility
$0
NJ AVG
$76.4k
Rank
#1 / 287 | 2
Facility
2
NJ AVG
20.9
Rank
#1 / 286 | 1.0
Facility
1.0
NJ AVG
5.3
Rank
#1 / 286 | - | 58 | - |
25
Facility
25
NJ AVG
48
Rank
#477 / 629 | Brian Lawrence | $51.2MFiscal year ending 12/2023
Facility
$51.2MFiscal year ending 12/2023
NJ AVG
$17.8M
Rank
#3 / 257 | $21.7MFiscal year ending 12/2023
Facility
$21.7MFiscal year ending 12/2023
NJ AVG
$8.7M
Rank
#6 / 257 | 42.4%Fiscal year ending 12/2023
Facility
42.4%Fiscal year ending 12/2023
NJ AVG
51.1%
Rank
#197 / 257 | 315356 | ||||
| Bartley Healthcare Nursing and Rehabilitation Center | NH HOS MC PC RC SNF | Jackson Township (Bennetts Mills) | 234
Facility
234
NJ AVG
125
Rank
#36 / 560 |
84.6%
Facility
84.6%
NJ AVG
74.5
Rank
#181 / 478 | +14% | 3.49
Facility
3.49
NJ AVG
3.88
Rank
#174 / 284 | -31% | -10% | $0
Facility
$0
NJ AVG
$76.4k
Rank
#1 / 287 | 12
Facility
12
NJ AVG
20.9
Rank
#48 / 286 | 2.4
Facility
2.4
NJ AVG
5.3
Rank
#22 / 286 | - | 198 | A+ |
19
Facility
19
NJ AVG
48
Rank
#532 / 629 | Bartley Operator Holdco LLC | $28.7MFiscal year ending 12/2023
Facility
$28.7MFiscal year ending 12/2023
NJ AVG
$17.8M
Rank
#21 / 257 | $10.8MFiscal year ending 12/2023
Facility
$10.8MFiscal year ending 12/2023
NJ AVG
$8.7M
Rank
#49 / 257 | 37.7%Fiscal year ending 12/2023
Facility
37.7%Fiscal year ending 12/2023
NJ AVG
51.1%
Rank
#216 / 257 | 315288 | ||||
| Preferred Care At Wall | NH HOS RC SNF | Allenwood | 135
Facility
135
NJ AVG
125
Rank
#181 / 560 |
90.4%
Facility
90.4%
NJ AVG
74.5
Rank
#90 / 478 | +21% | 3.71
Facility
3.71
NJ AVG
3.88
Rank
#132 / 284 | -72% | -4% | $0
Facility
$0
NJ AVG
$76.4k
Rank
#1 / 287 | 11
Facility
11
NJ AVG
20.9
Rank
#42 / 286 | 2.8
Facility
2.8
NJ AVG
5.3
Rank
#34 / 286 | - | 122 | - |
2
Facility
2
NJ AVG
48
Rank
#627 / 629 | Preferred Care Holdings,LLC | $18.0MFiscal year ending 12/2023
Facility
$18.0MFiscal year ending 12/2023
NJ AVG
$17.8M
Rank
#96 / 257 | $6.7MFiscal year ending 12/2023
Facility
$6.7MFiscal year ending 12/2023
NJ AVG
$8.7M
Rank
#166 / 257 | 37.4%Fiscal year ending 12/2023
Facility
37.4%Fiscal year ending 12/2023
NJ AVG
51.1%
Rank
#217 / 257 | 315397 | ||||
| Riverview Estates Rehab And Senior Living Center | NH AL PC RC SNF | Riverton | 66
Facility
66
NJ AVG
125
Rank
#473 / 560 |
72.7%
Facility
72.7%
NJ AVG
74.5
Rank
#304 / 478 | -2% | 4.87
Facility
4.87
NJ AVG
3.88
Rank
#26 / 284 | -25% | +26% | $38.5k
Facility
$38.5k
NJ AVG
$76.4k
Rank
#220 / 287 | 17
Facility
17
NJ AVG
20.9
Rank
#107 / 286 | 8.5
Facility
8.5
NJ AVG
5.3
Rank
#264 / 286 | 1 | 48 | - |
65
Facility
65
NJ AVG
48
Rank
#191 / 629 | Riverview Estates Rehabilitation And Senior Living Center | $9.0MFiscal year ending 12/2023
Facility
$9.0MFiscal year ending 12/2023
NJ AVG
$17.8M
Rank
#236 / 257 | $3.6MFiscal year ending 12/2023
Facility
$3.6MFiscal year ending 12/2023
NJ AVG
$8.7M
Rank
#235 / 257 | 39.6%Fiscal year ending 12/2023
Facility
39.6%Fiscal year ending 12/2023
NJ AVG
51.1%
Rank
#209 / 257 | 315448 |
Riverview Estates Rehab And Senior Living Center is legally operated by Riverview Estates Rehabilitation And Senior Living, and administered by Ms. TONI REMBAS.
Riverview Estates Rehab And Senior Living Center has a walk score of 65. Moderately walkable. Some errands can be accomplished on foot, with a mix of nearby amenities.
According to NJ state health department records, Riverview Estates Rehab And Senior Living Center's license number is 30301.
According to NJ state health department records, Riverview Estates Rehab And Senior Living Center's license expires on February 28, 2027.
Riverview Estates Rehab And Senior Living Center's occupancy is 73%.
No, Riverview Estates Rehab And Senior Living Center has a no-pet policy.
Riverview Estates Rehab And Senior Living Center is registered as a for-profit in NJ.
Care Cost Calculator: See Prices in Your Area
Nursing Home Data Explorer
Don’t Wait Too Long: 7 Red Flag Signs Your Parent Needs Assisted Living Now
The True Cost of Assisted Living in 2025 – And How Families Are Paying For It
Understanding Senior Living Costs: Pricing Models, Discounts & Financial Assistance


