Sapphire Center
Nursing Home, Skilled Nursing & Memory Care · Queens, NY
CMS overall rating Info The Overall CMS Rating is scored from 1 to 5 stars and combines results from health inspections, staffing levels, and quality measures. Health inspections carry the most weight. Staffing and quality scores can increase or decrease the final rating based on performance compared to state and national standards.

Sapphire Center

Nursing Home, Skilled Nursing & Memory Care · Queens, NY
CMS overall rating Info The Overall CMS Rating is scored from 1 to 5 stars and combines results from health inspections, staffing levels, and quality measures. Health inspections carry the most weight. Staffing and quality scores can increase or decrease the final rating based on performance compared to state and national standards.
Calculator: See prices in your area
Sapphire Center accepts Medicare, Medicaid, and private pay.

Overview of Sapphire Center

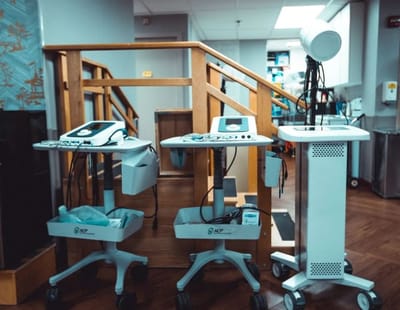
A premier Rehabilitation and Nursing home care facility for the community of Queens, New York, Sapphire Center strives to provide the highest quality of care to its patients. Its range of comprehensive services is designed to meet their patients’ needs.

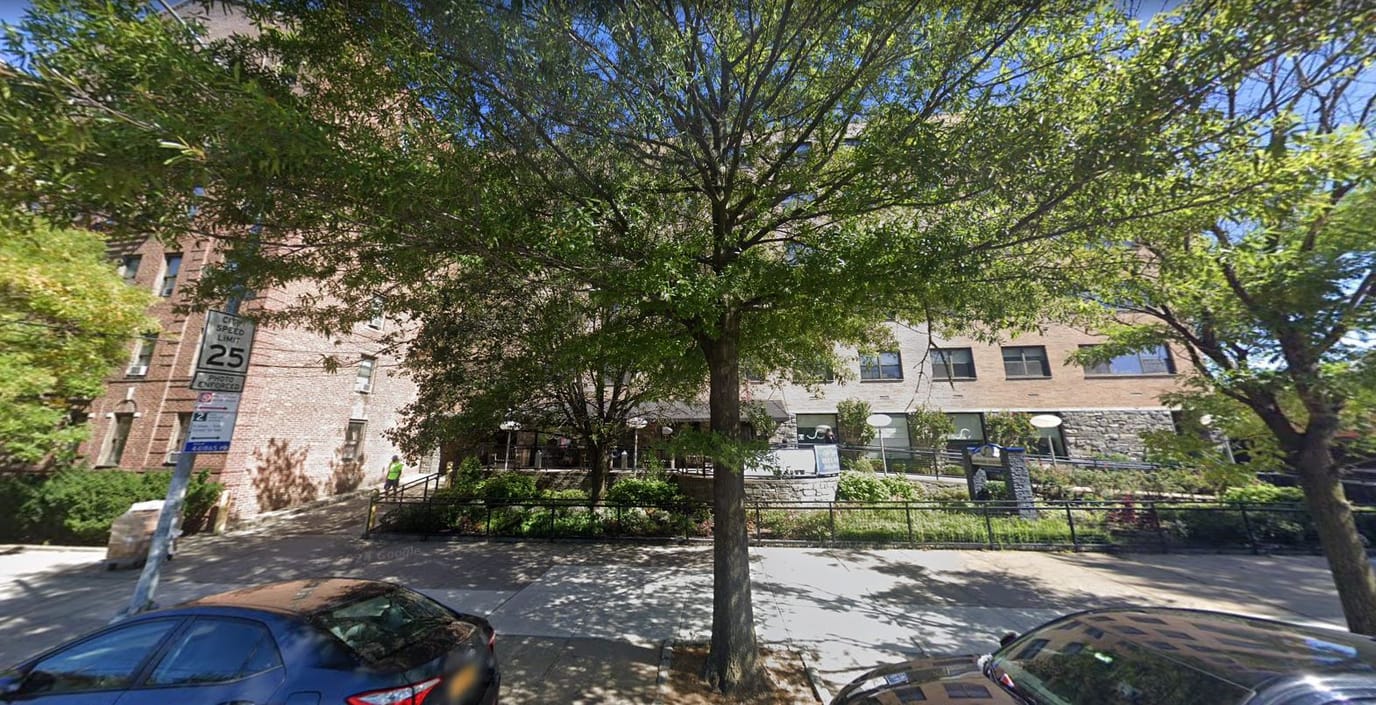
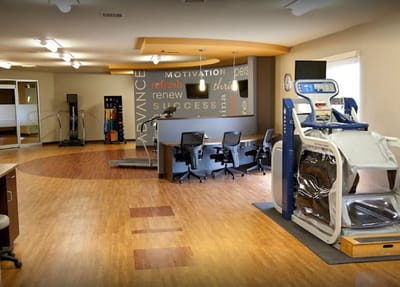
Located in the heart of Queens and known as one of the best nursing homes, Sapphire has a beautiful facility. It has an enhanced dining area, a backyard garden, and private rooms equipped with the right equipment to meet patients’ needs. At Sapphire, a compassionate team of diverse individuals ensures that every patient can feel at home and safe in their capable hands.

(718) 961-3500

Quality ratings

Measured by Centers for Medicare & Medicaid Services (CMS)

Overall rating Info The Overall CMS Rating combines results from health inspections, staffing levels and quality measures. Health inspections carry the most weight. Staffing and quality scores can increase or decrease the final rating based on performance compared to state and national standards.
▼ 34.9% Below NY avg. ▼ 34.9% Below NY avg.Click the badge to see the full State ranking.Click here to see the full State ranking.
Health Inspection Info Based on the results of the facility's three most recent standard inspections and any complaint investigations. CMS reviews the number, scope, and severity of deficiencies, with more recent findings weighted more heavily.
▼ 64.7% Below NY avg. ▼ 64.7% Below NY avg.Click the badge to see the full State ranking.Click here to see the full State ranking.
Staffing Info Measures average nursing staff hours per resident per day, including Registered Nurses (RNs) and total nursing staff. Ratings are adjusted based on the level of care residents require and are compared to state and national benchmarks.
▲ 10.4% Above NY avg. ▲ 10.4% Above NY avg.Click the badge to see the full State ranking.Click here to see the full State ranking.
Quality Measures Info Based on clinical and physical health indicators reported to CMS, such as hospital readmissions, falls, pressure ulcers, and improvements in mobility. These measures reflect how well residents' health needs are being managed.
▲ 30.9% Above NY avg. ▲ 30.9% Above NY avg.Click the badge to see the full State ranking.Click here to see the full State ranking.

Staffing hours breakdown

Info Daily nursing hours per resident by staff type, reported to CMS. Higher is generally better — compare this facility to state and national averages to see where staffing stands.

Hours per resident per day — compared to New York state averages

Total nursing care / resident Info This home is ranked 241st out of 388 homes in New York. Total adjusted nursing hours per resident per day, combining RN, LPN, and aide time. CMS adjusts this for case-mix so facilities can be fairly compared.
3h 6m per day
Rank #241 / 388Nurse hours — State benchmarkedThis home is ranked 241st out of 388 homes in New York. Shows adjusted nurse hours per resident per day benchmarked to the New York average, with a ranking across 388 New York SNFs. More hours mean more direct care. The national average is about 3.5 hrs; below 3.0 is a red flag.Click the rank badge to see the full State ranking.Click here to see the full State ranking.
This facility New York avg (3h 35m per day)
vs New York avg
-13%

3 of 6 metrics below state avg

Standout metric Weekend RN is +57% above state avg
Staff typeHours / Day / Residentvs state avg
Registered Nurse (RN) Info RNs hold the highest nursing license and can assess residents, interpret test results, and direct care plans. More RN hours per day often signals stronger clinical oversight and faster response to health changes. 57m per day ▲ 36% State avg: 42m per day · National avg: 41m per day
LPN / LVN Info Licensed Practical Nurses (LPNs) or Licensed Vocational Nurses (LVNs) deliver routine hands-on care — medication administration, wound dressing, and monitoring vital signs. They work under RN supervision and make up a large share of daily bedside care. 8m per day ▼ 83% State avg: 46m per day · National avg: 52m per day
Nurse Aide Info Certified Nurse Aides (CNAs) provide the most direct day-to-day assistance: bathing, dressing, feeding, and mobility. Nurse aide hours are typically the largest staffing category and directly affect residents' quality of life. 2h 9m per day ■ Avg State avg: 2h 11m per day · National avg: 2h 21m per day
Weekend Total Nursing Info Combined nursing hours (RN + LPN + Nurse Aide) per resident per day on weekends. Staffing often drops on weekends — this figure reveals whether the facility maintains adequate coverage outside of weekday hours. 2h 55m per day ▼ 8% State avg: 3h 10m per day · National avg: 3h 26m per day
Physical Therapist Info Hours per resident per day provided by licensed Physical Therapists (PTs) or PT Assistants. PT services help residents recover mobility after injury or illness and are especially important for post-acute (short-stay) rehabilitation. 4m per day ▼ 43% State avg: 7m per day · National avg: 4m per day
Weekend RN Info Registered nurse hours specifically on weekends. Facilities sometimes reduce RN presence on Saturdays and Sundays — a low weekend RN figure compared to weekday hours can indicate reduced clinical oversight when most administrative staff are absent. 44m per day ▲ 57% State avg: 28m per day · National avg: 29m per day

Types of Care at Sapphire Center

Skilled Nursing Memory Care

Capacity and availability

This home is often near full

Higher occupancy than the New York average: 88.3%
Occupancy rate
96.4% Rank #79 / 433Occupancy rate — State benchmarkedThis home is ranked 79th out of 433 homes in New York. Shows this facility's occupancy rate versus the New York average, with its Statewide rank out of 433. Higher occupancy signals strong local demand and financial stability.Click the rank badge to see the full State ranking.Click here to see the full State ranking.
Avg. Length of Stay
213 days
Walk Score
Walk Score: 94 / 100 Rank #159 / 1168Walk Score — State benchmarkedThis home is ranked 159th out of 1168 homes in New York. Shows how walkable this facility's neighborhood is compared to the average Walk Score across New York SNFs. Higher scores benefit residents, families, and staff.Click the rank badge to see the full State ranking.Click here to see the full State ranking.
Walker's paradise. Daily errands do not require a car, with many shops and services nearby.

Contact Sapphire Center

Staffing Data

Reporting period: October 1 – December 31, 2025 (Q4 2025). Source: CMS Payroll-Based Journal report.

Total staff 203
Employees 164
Contractors 39
Staff to resident ratio 0.90:1
415% better than New York average
New York average ratio: 0.18:1 New York average ratio: 0.18:1See full New York ranking
Avg staff/day 106
Average shift 7.9 hours
0% compared with New York average
New York average: 7.7 hours New York average shift: 7.7 hoursSee full New York ranking
Total staff hours (quarter) 77,523

Nursing staff breakdown

Q4 2025 · Oct 1 – Dec 31 More info This data comes from the CMS Payroll-Based Journal report covering October 1 – December 31, 2025.
Registered Nurse

Manages medical care and health needs.

RN Staff Info 49 total: 32 full-time employees and 17 contractors. 49
Average shift length Info Average shift length. Calculated as total hours divided by days worked and average staff per day. 9.7 hours
Licensed Practical Nurse

Assists with medical care and medications.

LPN Staff Info 6 total: 4 full-time employees and 2 contractors. 6
Average shift length Info Average shift length. Calculated as total hours divided by days worked and average staff per day. 9.6 hours
Certified Nursing Assistant

Helps with daily care and mobility.

CNA Staff Info 97 total: 88 full-time employees and 9 contractors. 97
Average shift length Info Average shift length. Calculated as total hours divided by days worked and average staff per day. 7.8 hours

Contractor staffing

Q4 2025 · Oct 1 – Dec 31 More info This data comes from the CMS Payroll-Based Journal report covering October 1 – December 31, 2025.

Total hours from contractors

15.1%

11,739 contractor hours this quarter

Registered Nurse: 17 Certified Nursing Assistant: 9 Physical Therapy Aide: 3 Respiratory Therapy Technician: 3 Licensed Practical Nurse: 2 Qualified Social Worker: 2 Dietitian: 1 Physical Therapy Assistant: 1 Medical Director: 1

Staff by category

Q4 2025 · Oct 1 – Dec 31 More info This data comes from the CMS Payroll-Based Journal report covering October 1 – December 31, 2025.
Certified Nursing Assistant8899742,89292100%7.8
Registered Nurse32174914,81092100%9.7
Other Dietary Services Staff110114,23092100%7
Licensed Practical Nurse4263,0169098%9.6
Clinical Nurse Specialist7072,0548592%6.9
Speech Language Pathologist5052,0497986%7.5
Physical Therapy Aide2351,8407986%7.3
Respiratory Therapy Technician1341,0887986%5.8
Occupational Therapy Aide4041,0657379%9
Dental Services Staff3039766571%7.3
Physical Therapy Assistant1127997986%6.3
Mental Health Service Worker3036538087%6.4
Nurse Practitioner1014626672%7
Qualified Social Worker0224476672%6.8
Dietitian1124355459%6.4
Administrator1014276166%7
Medical Director0112804043%7
97 Certified Nursing Assistant
% of Days 100%
49 Registered Nurse
% of Days 100%
11 Other Dietary Services Staff
% of Days 100%
6 Licensed Practical Nurse
% of Days 98%
7 Clinical Nurse Specialist
% of Days 92%
5 Speech Language Pathologist
% of Days 86%
5 Physical Therapy Aide
% of Days 86%
4 Respiratory Therapy Technician
% of Days 86%
4 Occupational Therapy Aide
% of Days 79%
3 Dental Services Staff
% of Days 71%
2 Physical Therapy Assistant
% of Days 86%
3 Mental Health Service Worker
% of Days 87%
1 Nurse Practitioner
% of Days 72%
2 Qualified Social Worker
% of Days 72%
2 Dietitian
% of Days 59%
1 Administrator
% of Days 66%
1 Medical Director
% of Days 43%

Penalties and fines

Includes penalties issued in 2024

Federal penalties imposed by CMS for regulatory violations, including civil money penalties (fines) and denials of payment for new Medicare/Medicaid admissions.

Source: CMS Penalties Database (Data as of Jan 2026)

Total fines amount $88K Rank #370 / 395Federal fines — State benchmarkedThis home is ranked 370th out of 395 homes in New York. Shows this facility's cumulative CMS federal fine dollars versus the New York average among facilities with fines, and where it ranks among 395 skilled nursing facilities in the pool. Lower total dollars mean a better rank.Click the rank badge to see the full State ranking.Click here to see the full State ranking.
32% higher than New York average

New York average: $66K

Number of fines 1
51% fewer fines than New York average

New York average: 2.0

Payment Denials Info Serious action where Medicare and/or Medicaid temporarily stops payments for new residents until issues are fixed. 0
100% fewer payment denials than New York average

New York average: 0.1

Fines amount comparison
This facility $88K
New York average $66K
Penalty History

Penalties are imposed by CMS for violations of federal nursing home regulations.

1 penalty in the past 3 years

May 9, 2024 · $88K

Civil Money Penalty Info Fines imposed for noncompliance, which can be assessed per day or per instance of violation. May 9, 2024
$88K

Last updated: Jan 2026

Quality of care over time

These measures show how residents usually do over time at this home, based on health outcomes and preventive care.

High-risk clinical events score Info A composite score based on pressure ulcers, falls with injury, weight loss, walking ability decline, and activities of daily living decline. 5.8
41% better than New York average

New York average: 9.8

Functional decline score Info A composite score based on activities of daily living decline, walking ability decline, and incontinence. 10.9
40% better than New York average

New York average: 18.1

Long-stay resident measures
Significantly above average New York avg: 4.0 Info CMS star rating based on long-stay quality measure performance. 5 stars = significantly above average, 1 star = significantly below average.
Need for Help with Daily Activities Increased Info Percent of long-stay residents whose need for help with daily activities has increased 8.6%
48% better than New York average

New York average: 16.4%

Walking Ability Worsened Info Percent of long-stay residents whose ability to move independently worsened 7.2%
57% better than New York average

New York average: 16.6%

Low Risk Residents with Bowel/Bladder Incontinence Info Percent of low risk long-stay residents who lose control of their bowels or bladder 16.7%
22% better than New York average

New York average: 21.4%

Falls with Major Injury Info Percent of long-stay residents experiencing one or more falls with major injury 2.4%
20% better than New York average

New York average: 3.0%

High Risk Residents with Pressure Ulcers Info Percent of long-stay high risk residents with pressure ulcers 5.7%
20% better than New York average

New York average: 7.2%

Urinary Tract Infection Info Percent of long-stay residents with a urinary tract infection 0.0%
100% better than New York average

New York average: 1.4%

Lost Too Much Weight Info Percent of long-stay residents who lose too much weight 5.0%
18% better than New York average

New York average: 6.1%

Depressive Symptoms Info Percent of long-stay residents who have depressive symptoms 15.1%
17% better than New York average

New York average: 18.1%

Antipsychotic Use Info Percent of long-stay residents who received an antipsychotic medication 13.8%
10% worse than New York average

New York average: 12.6%

Pneumococcal Vaccine Info Percent of long-stay residents assessed and appropriately given the pneumococcal vaccine 97.3%
6% better than New York average

New York average: 91.4%

Influenza Vaccine Info Percent of long-stay residents assessed and appropriately given the seasonal influenza vaccine 99.5%
5% better than New York average

New York average: 95.2%

Hospitalizations per 1,000 days Info Number of hospitalizations per 1,000 long-stay resident days. 2.11
23% worse than New York average

New York average: 1.71

ED visits per 1,000 days Info Number of outpatient emergency department visits per 1,000 long-stay resident days. 0.84
38% better than New York average

New York average: 1.35

Short-stay resident measures
Significantly above average New York avg: 3.5 Info CMS star rating based on short-stay quality measure performance. 5 stars = much above average, 1 star = much below average.
Pneumococcal Vaccine Info Percent of short-stay residents assessed and appropriately given the pneumococcal vaccine 94.7%
24% better than New York average

New York average: 76.6%

Antipsychotic medication increase Info Percent of short-stay residents who newly received an antipsychotic medication 0.0%
100% better than New York average

New York average: 1.3%

Influenza Vaccine Info Percent of short-stay residents assessed and appropriately given the seasonal influenza vaccine 98.1%
24% better than New York average

New York average: 78.8%

Re-hospitalized after SNF stay Info Percentage of short-stay residents who were re-hospitalized after their nursing home admission. 12.3%
40% better than New York average

New York average: 20.6%

Emergency department visits Info Percentage of short-stay residents who had an outpatient emergency department visit. 2.7%
72% better than New York average

New York average: 9.7%

Falls with major injury Info Percentage of SNF residents who experience falls with major injury during their stay. 1.8%
138% worse than New York average

New York average: 0.8%

Ability to care for self at discharge Info Percentage of residents at or above expected ability to care for themselves at discharge. 85.0%
58% better than New York average

New York average: 53.7%

Successful return to home or community Info Rate of successful return to home or community from a skilled nursing facility. 48.0%
5% worse than New York average

New York average: 50.6%

Breakdown by payment type

Medicare

31% of new residents, usually for short-term rehab.

Typical stay 2 - 3 months

Private pay

60% of new residents, often for short stays.

Typical stay 3 - 4 months

Medicaid

9% of new residents, often for long-term daily care.

Typical stay 4 years

Facility Characteristics

Source: CMS Long-Term Care Facility Characteristics (Data as of Jan 2026)

Total residents 225
Medicare
26
11.6% of residents
Medicaid
148
65.8% of residents
Private pay or other
51
22.7% of residents
Programs & Services
Residents Group

Residents meet regularly to discuss policies, care quality, and activities

Active Resident Council

Organized group of residents that meets regularly to discuss facility policies, quality of life, and activities.

Finances and operations

Privately-owned community
Operated by a partnership between two or more business owners.
Home revenue
$39.6M
Operating loss
-$2.0M
Privately-owned community Operated by a partnership between two or more business owners.
Home revenue
$39.6M Rank #119 / 383Revenue — State benchmarkedThis home is ranked 119th out of 383 homes in New York. Shows this facility's annual revenue compared to the New York SNF average. Higher revenue generally means more resources for staffing and capital — read alongside Payroll %.Click the rank badge to see the full State ranking.Click here to see the full State ranking.
Operating loss
-$2.0M
Payroll costs Info The portion of the home's budget spent on staff, including nurses, caregivers, and other employees who support care and operations. Rank #113 / 383Payroll — State benchmarkedThis home is ranked 113th out of 383 homes in New York. Shows total annual staff payroll benchmarked to the New York average. Higher payroll investment relative to peers often signals better staffing and less reliance on cheaper contract labor.Click the rank badge to see the full State ranking.Click here to see the full State ranking.
$20.1M
50.9% of revenue Rank #154 / 383Payroll % — State benchmarkedThis home is ranked 154th out of 383 homes in New York. Shows payroll as a percentage of revenue versus the New York average. Well-run New York SNFs typically land around 53–65% — the top third Statewide. Below 25% may signal understaffing or heavy agency use — read with Staffing ratings.Click the rank badge to see the full State ranking.Click here to see the full State ranking.
Other operating costs Info All remaining costs needed to run the home, such as food, utilities, building maintenance, supplies and administrative expenses.
$21.5M
Total costs $41.6M

Who this home usually serves

TYPE OF STAY

Primarily short stays

Residents typically stay for brief periods, with frequent admissions and discharges throughout the year.

Places of interest near Sapphire Center

Address 4.0 miles from city center Info Estimated distance in miles from Queens's city center to Sapphire Center's address, calculated via Google Maps. — 0.81 miles to nearest hospital (Flushing Hospital Medical Center)

Calculate Travel Distance to Sapphire Center

Add your location

Address

Financial Assistance for
Nursing Home in New York

Sapphire Center is located in Queens, New York.
Here are the financial assistance programs available to residents in New York.

Get Financial aid guidance

Community First Choice Option

NY Medicaid CFCO

Age 65+ or disabled
General New York resident, Medicaid- eligible, care need (not necessarily nursing home level).
Income Limits (2025) ~$2,829/month 300% FBR, individual
Asset Limits $30,182 individual, higher due to NY Medicaid expansion
NY

Higher asset limit; urban density increases demand.

Benefits
Personal care (5-7 hours/day) Respite care (240 hours/year) Home modifications ($1,500 avg.) Assistive technology ($500 avg.)

Expanded In-Home Services for the Elderly Program (EISEP)

NY EISEP

Age 60+
General New York resident, at risk of decline but not nursing home level.
Income Limits ~$2,500/month individual, varies
Asset Limits $15,000 individual
NY

Cost-sharing required above certain income; urban/rural balance.

Benefits
In-home care (3-5 hours/week) Respite (up to 10 days/year) Case management Transportation (~5 trips/month)

Senior Citizen Rent Increase Exemption (SCRIE)

NY SCRIE

Age 62+
General NYC resident, live in rent-controlled/stabilized apartment, spend >1/3 of income on rent.
Income Limits (2025) $50,000/year household
Asset Limits No strict asset cap, but income-focused eligibility.
NY

Limited to NYC’s rent-regulated units; high demand in urban areas.

Benefits
Rent freeze (e.g., covers increases of $50-$200+/month); tax credit for landlord

Senior Citizen Homeowners’ Exemption (SCHE)

NY SCHE

Age 65+
General NYC resident, own and live in a 1-3 family home, co-op, or condo.
Income Limits (2025) $58,399/year household
Asset Limits No strict asset cap, income-driven eligibility.
NY

Applies only in NYC; excludes large apartment buildings.

Benefits
Property tax reduction (5-50%, e.g., $500-$5,000/year based on income and property value)

New York Foundation for Senior Citizens (NYFSC) Home Sharing Program

NYFSC Home Sharing

Age One participant must be 60+ (host or guest)
General NYC resident, able to share living space.
Income Limits No strict limit, but targets those needing cost relief.
Asset Limits Not applicable; focus on housing need.
NY

Primarily NYC-focused; limited slots due to demand.

Benefits
Shared housing (reduces rent/living costs by 30-50%, e.g., $500-$1,000/month savings); optional light assistance between housemates

Compare Nursing Home around Queens

The information below is reported by the New York State Department of Health.

5 facilities compared · CMS & NY Dept. of Health data

Filter by care type
Cypress Garden Center for Nursing & Rehabilitation
NH

Nursing Home Licensed facility providing 24/7 skilled nursing care for residents with complex, ongoing medical needs. Staffed by RNs, LPNs, and CNAs. Inspected and star-rated annually by CMS. Accepts Medicare (short-term rehab) and Medicaid (long-term care).

HC

Home Care Professional care delivered in the person's own home — from companionship and errands to skilled nursing and therapy. Allows seniors to age in place. Medicare covers skilled home health when medically necessary.

MC

Memory Care Secured, specialized care for people living with Alzheimer's or dementia. Staff trained in cognitive impairment, with higher staff-to-resident ratios and an environment designed to reduce confusion and wandering risk.

Queens (Flushing)268 97.0% +10%2.58 +16%-28%$0
82
Facility 82
NY AVG 73
Rank #120 / 587
124.0-268A+ 96 Kprh IV Operations, LLC (For Profit)$46.7M$22.4M48.1%335446
Hollis Park Manor
NH

Nursing Home Licensed facility providing 24/7 skilled nursing care for residents with complex, ongoing medical needs. Staffed by RNs, LPNs, and CNAs. Inspected and star-rated annually by CMS. Accepts Medicare (short-term rehab) and Medicaid (long-term care).

Queens (Jamaica)80 95.0% +8%3.86 +128%+8%$0
83
Facility 83
NY AVG 73
Rank #110 / 587
124.0-77- 81 Robert Izask$12.2M$8.1M66.2%335333
Fairview Rehab and Nursing Home
NH

Nursing Home Licensed facility providing 24/7 skilled nursing care for residents with complex, ongoing medical needs. Staffed by RNs, LPNs, and CNAs. Inspected and star-rated annually by CMS. Accepts Medicare (short-term rehab) and Medicaid (long-term care).

MC

Memory Care Secured, specialized care for people living with Alzheimer's or dementia. Staff trained in cognitive impairment, with higher staff-to-resident ratios and an environment designed to reduce confusion and wandering risk.

Queens (Forest Hills)200 100.0% +13%3.68 +157%+3%$0
57
Facility 57
NY AVG 73
Rank #515 / 587
206.7-198A+ 75 Sara Klein$61.4M$23.8M38.9%335146
Sapphire Center
NH

Nursing Home Licensed facility providing 24/7 skilled nursing care for residents with complex, ongoing medical needs. Staffed by RNs, LPNs, and CNAs. Inspected and star-rated annually by CMS. Accepts Medicare (short-term rehab) and Medicaid (long-term care).

MC

Memory Care Secured, specialized care for people living with Alzheimer's or dementia. Staff trained in cognitive impairment, with higher staff-to-resident ratios and an environment designed to reduce confusion and wandering risk.

Queens (Flushing)227 96.4% +9%3.10 +91%-13%$87.7k-285.63220- 94 Deena Hersh$39.6M$20.1M50.9%335133
Oceanview Nursing & Rehabilitation Center
NH

Nursing Home Licensed facility providing 24/7 skilled nursing care for residents with complex, ongoing medical needs. Staffed by RNs, LPNs, and CNAs. Inspected and star-rated annually by CMS. Accepts Medicare (short-term rehab) and Medicaid (long-term care).

HC

Home Care Professional care delivered in the person's own home — from companionship and errands to skilled nursing and therapy. Allows seniors to age in place. Medicare covers skilled home health when medically necessary.

RC

Respite Care Short-term temporary care — days to weeks — to give family caregivers a break. Full care provided during the stay. Often used after hospitalization or to trial a facility before a permanent placement decision.

Far Rockaway102 94.1% +7%- -100%-$0
76
Facility 76
NY AVG 73
Rank #232 / 587
217.0-96- 76 Louis Wolcowitz Estate$16.8M$9.8M58.1%335168

Frequently Asked Questions about Sapphire Center

What neighborhood is Sapphire Center in?

Sapphire Center is in the Flushing neighborhood.

Is Sapphire Center in a walkable area?

Sapphire Center has a walk score of 94. Walker's paradise. Daily errands do not require a car, with many shops and services nearby.

What is the occupancy rate at Sapphire Center?

Sapphire Center's occupancy is 96.4%.

Are there photos of Sapphire Center?

Yes — there are 4 photos of Sapphire Center in the photo gallery on this page.

What is the phone number of Sapphire Center?

(718) 961-3500 will put you in contact with the team at Sapphire Center.

Is Sapphire Center Medicare or Medicaid certified?

Yes — Sapphire Center is a CMS-certified provider of Medicare and Medicaid.

Guides for Better Senior Living

Care Cost Calculator: See Prices in Your Area

Nursing Home Data Explorer

Don’t Wait Too Long: 7 Red Flag Signs Your Parent Needs Assisted Living Now

The True Cost of Assisted Living in 2025 – And How Families Are Paying For It

Understanding Senior Living Costs: Pricing Models, Discounts & Financial Assistance

Explore Open Rooms
1 Contact details
2 What type of senior care service are you looking for?
3 What budget do you have in mind for senior care?
4 How soon do you need to find care?
5 Additional details

Thank you for your interest!

Our team will be in touch shortly to help with next steps.