The Denver Hospice Inpatient Care Center
Nursing Home · Denver, CO
CMS overall rating Info The Overall CMS Rating is scored from 1 to 5 stars and combines results from health inspections, staffing levels, and quality measures. Health inspections carry the most weight. Staffing and quality scores can increase or decrease the final rating based on performance compared to state and national standards.

The Denver Hospice Inpatient Care Center

Nursing Home · Denver, CO
CMS overall rating Info The Overall CMS Rating is scored from 1 to 5 stars and combines results from health inspections, staffing levels, and quality measures. Health inspections carry the most weight. Staffing and quality scores can increase or decrease the final rating based on performance compared to state and national standards.
Calculator: See prices in your area
The Denver Hospice Inpatient Care Center accepts Medicare, Medicaid, and private pay.

Overview of The Denver Hospice Inpatient Care Center

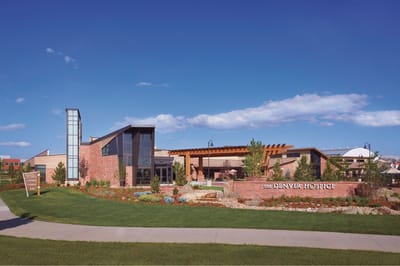
The Denver Hospice Inpatient Care Center, located in Colorado, offers a welcoming environment with 24 private suites, each featuring its own patio. This setting is designed to provide residents with a home-like experience, fostering a sense of premium community living. The center is equipped with a range of amenities, including a family dining room, a multi-faith chapel, a library, and a hydrotherapy spa. Common areas are thoughtfully adorned with artwork, creating a tasteful and comfortable atmosphere. Patient rooms are equipped with cutting-edge innovations to enhance the ambiance, ensuring a high-quality experience.
The primary focus of this facility is to provide general inpatient care, and they do so with a highly skilled and trained staff. Their services encompass intensive nursing care, supportive care, and spiritual care, all delivered with unwavering compassion and expertise. The Denver Hospice Inpatient Care Center is dedicated to maintaining the highest standards in patient care, never compromising on the quality of service they provide.

(303) 418-3000

Quality ratings

Measured by Centers for Medicare & Medicaid Services (CMS)

Overall rating Info The Overall CMS Rating combines results from health inspections, staffing levels and quality measures. Health inspections carry the most weight. Staffing and quality scores can increase or decrease the final rating based on performance compared to state and national standards.
▲ 26.2% Above CO avg. ▲ 26.2% Above CO avg.Click the badge to see the full State ranking.Click here to see the full State ranking.
Health Inspection Info Based on the results of the facility's three most recent standard inspections and any complaint investigations. CMS reviews the number, scope, and severity of deficiencies, with more recent findings weighted more heavily.
▲ 7.1% Above CO avg. ▲ 7.1% Above CO avg.Click the badge to see the full State ranking.Click here to see the full State ranking.
Staffing Info Measures average nursing staff hours per resident per day, including Registered Nurses (RNs) and total nursing staff. Ratings are adjusted based on the level of care residents require and are compared to state and national benchmarks.
▼ 4.5% Below CO avg. ▼ 4.5% Below CO avg.Click the badge to see the full State ranking.Click here to see the full State ranking.
Quality Measures Info Based on clinical and physical health indicators reported to CMS, such as hospital readmissions, falls, pressure ulcers, and improvements in mobility. These measures reflect how well residents' health needs are being managed.
▲ 21.4% Above CO avg. ▲ 21.4% Above CO avg.Click the badge to see the full State ranking.Click here to see the full State ranking.

Staffing hours breakdown

Info Daily nursing hours per resident by staff type, reported to CMS. Higher is generally better — compare this facility to state and national averages to see where staffing stands.

Hours per resident per day — compared to Colorado state averages

Total nursing care / resident Info This home is ranked 131st out of 177 homes in Colorado. Total adjusted nursing hours per resident per day, combining RN, LPN, and aide time. CMS adjusts this for case-mix so facilities can be fairly compared.
3h 19m per day
Rank #131 / 177Nurse hours — State benchmarkedThis home is ranked 131st out of 177 homes in Colorado. Shows adjusted nurse hours per resident per day benchmarked to the Colorado average, with a ranking across 177 Colorado SNFs. More hours mean more direct care. The national average is about 3.5 hrs; below 3.0 is a red flag.Click the rank badge to see the full State ranking.Click here to see the full State ranking.
This facility Colorado avg (3h 51m per day)
vs Colorado avg
-14%
Staff typeHours / Day / Residentvs state avg
Weekend Total Nursing Info Combined nursing hours (RN + LPN + Nurse Aide) per resident per day on weekends. Staffing often drops on weekends — this figure reveals whether the facility maintains adequate coverage outside of weekday hours. 3h 8m per day

Capacity and availability

This home usually has availability

Occupancy lower than 85% suggests more openings may be available.

Higher occupancy than the Colorado average: 76.5%
Occupancy rate 77.6% Rank #94 / 185Occupancy rate — State benchmarkedThis home is ranked 94th out of 185 homes in Colorado. Shows this facility's occupancy rate versus the Colorado average, with its Statewide rank out of 185. Higher occupancy signals strong local demand and financial stability.Click the rank badge to see the full State ranking.Click here to see the full State ranking.
Avg. Length of Stay 114 days
Occupancy rate
77.6% Rank #94 / 185Occupancy rate — State benchmarkedThis home is ranked 94th out of 185 homes in Colorado. Shows this facility's occupancy rate versus the Colorado average, with its Statewide rank out of 185. Higher occupancy signals strong local demand and financial stability.Click the rank badge to see the full State ranking.Click here to see the full State ranking.
Avg. Length of Stay
114 days
Bed community size
28-bed community Rank #432 / 542Bed count — State benchmarkedThis home is ranked 432nd out of 542 homes in Colorado. Shows this facility's certified or reported bed count compared to other Colorado SNFs. Larger communities may offer more amenities, programs, and on-site services for residents and families.Click the rank badge to see the full State ranking.Click here to see the full State ranking.
A moderately sized community that may balance personal attention with shared amenities and social activities.
Walk Score
Walk Score: 63 / 100 Rank #328 / 875Walk Score — State benchmarkedThis home is ranked 328th out of 875 homes in Colorado. Shows how walkable this facility's neighborhood is compared to the average Walk Score across Colorado SNFs. Higher scores benefit residents, families, and staff.Click the rank badge to see the full State ranking.Click here to see the full State ranking.
Moderately walkable. Some errands can be accomplished on foot, with a mix of nearby amenities.
BBB Rating
BBB Rating: A+ (Not Accredited)
An independent rating from the Better Business Bureau based on factors such as complaint history, transparency, and business practices.
How BBB ratings work

About this community

License Details

StatusActive

Ownership & Operating Entity

The Denver Hospice Inpatient Care Center is administrated by Tricia Ford.

OwnerHOSPICE OF METRO DENVER, INC.

Contact The Denver Hospice Inpatient Care Center

Health Inspection History

Inspections since 2019
Total health inspections 5

Colorado average 4.8


Last Health inspection on Jun 2024

Total health citations
23 Rank #94 / 182Health citations — State benchmarkedThis home is ranked 94th out of 182 homes in Colorado. Shows this facility's total health deficiency citations benchmarked to the Colorado State average, with a ranking across all 182 CO SNFs. Lower citation counts earn a better rank.Click the rank badge to see the full State ranking.Click here to see the full State ranking.

Colorado average 24.8

Citations per inspection
4.6 Rank #82 / 182Citations per inspection — State benchmarkedThis home is ranked 82nd out of 182 homes in Colorado. Shows average deficiency citations per CMS inspection for this facility versus the Colorado mean across 182 SNFs with citation data. Lower is better.Click the rank badge to see the full State ranking.Click here to see the full State ranking.

Colorado average 5.2


Health citations are formal notices following inspections when they fail to comply with safety and care standards.

19 of 23 citations resulted from standard inspections; 3 of 23 resulted from complaint investigations; and 1 of 23 came from combined inspections (standard and complaint).

Breakdown of citation severity (last 7 years)
Critical Health citations
0
100% better than Colorado average

Colorado average: 0.4


Serious Health citations
2 Rank #45 / 144Serious citations (G–I) — State benchmarkedThis home is ranked 45th out of 144 homes in Colorado. Shows G–I scope serious health citations for this facility versus other Colorado SNFs. Lower counts rank better.Click the rank badge to see the full State ranking.Click here to see the full State ranking.
5% better than Colorado average

Colorado average: 2.1

0 critical citations Colorado average: 0.4

2 serious citations Colorado average: 2.1

21 moderate citations Colorado average: 22.2

0 minor citations Colorado average: 0.2
Citations history (last 7 years)
Infection Control moderate citation Jun 11, 2024
Corrected

Infection Control moderate citation Jun 11, 2024
Corrected

Pharmacy moderate citation Jun 11, 2024
Corrected

Pharmacy moderate citation Jun 11, 2024
Corrected

Staffing Data

Reporting period: October 1 – December 31, 2025 (Q4 2025). Source: CMS Payroll-Based Journal report.

Total staff 161
Employees 127
Contractors 34
Staff to resident ratio 1.52:1
19% worse than Colorado average
Colorado average ratio: 1.88:1 Colorado average ratio: 1.88:1See full Colorado ranking
Avg staff/day 51
Average shift 8.7 hours
5% better than Colorado average
Colorado average: 8.3 hours Colorado average shift: 8.3 hoursSee full Colorado ranking
Total staff hours (quarter) 40,629

Nursing staff breakdown

Q4 2025 · Oct 1 – Dec 31 More info This data comes from the CMS Payroll-Based Journal report covering October 1 – December 31, 2025.
Registered Nurse

Manages medical care and health needs.

RN Staff 34
Average shift length Info Average shift length. Calculated as total hours divided by days worked and average staff per day. 10.2 hours

This role is partially covered by contractors.

Licensed Practical Nurse

Assists with medical care and medications.

LPN Staff 20
Average shift length Info Average shift length. Calculated as total hours divided by days worked and average staff per day. 10.2 hours

This role is partially covered by contractors.

Certified Nursing Assistant

Helps with daily care and mobility.

CNA Staff 66
Average shift length Info Average shift length. Calculated as total hours divided by days worked and average staff per day. 8.5 hours

No contractors work on this role.

Contractor staffing

Q4 2025 · Oct 1 – Dec 31 More info This data comes from the CMS Payroll-Based Journal report covering October 1 – December 31, 2025.

Total hours from contractors

6.5%

2,632 contractor hours this quarter

Registered Nurse: 16 Licensed Practical Nurse: 10 Qualified Social Worker: 2 Respiratory Therapy Technician: 2 Occupational Therapy Assistant: 2 Physical Therapy Assistant: 1 Medical Director: 1

Staff by category

Q4 2025 · Oct 1 – Dec 31 More info This data comes from the CMS Payroll-Based Journal report covering October 1 – December 31, 2025.
Certified Nursing Assistant6606620,00992100%8.5
Registered Nurse1816346,14192100%10.2
Licensed Practical Nurse1010205,10792100%10.2
Other Dietary Services Staff8082,18992100%7.6
Clinical Nurse Specialist6061,7816874%7.8
Dental Services Staff20299592100%8
Administrator1015286672%8
Mental Health Service Worker1015036368%8
Nurse Practitioner1014966267%8
Speech Language Pathologist2024936368%7.8
Dietitian1014515863%7.8
Physical Therapy Aide1014426571%6.8
Respiratory Therapy Technician2244386368%6.3
Qualified Social Worker3253995863%6.7
Occupational Therapy Aide3032985560%5.4
Physical Therapy Assistant2132815358%4.9
Occupational Therapy Assistant0224855%9.6
Medical Director0113233%10.5
66 Certified Nursing Assistant
% of Days 100%
34 Registered Nurse
% of Days 100%
20 Licensed Practical Nurse
% of Days 100%
8 Other Dietary Services Staff
% of Days 100%
6 Clinical Nurse Specialist
% of Days 74%
2 Dental Services Staff
% of Days 100%
1 Administrator
% of Days 72%
1 Mental Health Service Worker
% of Days 68%
1 Nurse Practitioner
% of Days 67%
2 Speech Language Pathologist
% of Days 68%
1 Dietitian
% of Days 63%
1 Physical Therapy Aide
% of Days 71%
4 Respiratory Therapy Technician
% of Days 68%
5 Qualified Social Worker
% of Days 63%
3 Occupational Therapy Aide
% of Days 60%
3 Physical Therapy Assistant
% of Days 58%
2 Occupational Therapy Assistant
% of Days 5%
1 Medical Director
% of Days 3%

Penalties and fines

Includes penalties issued in 2024

Federal penalties imposed by CMS for regulatory violations, including civil money penalties (fines) and denials of payment for new Medicare/Medicaid admissions.

Source: CMS Penalties Database (Data as of Jan 2026)

Total fines amount $23K Rank #117 / 182Federal fines — State benchmarkedThis home is ranked 117th out of 182 homes in Colorado. Shows this facility's cumulative CMS federal fine dollars versus the Colorado average among facilities with fines, and where it ranks among 182 skilled nursing facilities in the pool. Lower total dollars mean a better rank.Click the rank badge to see the full State ranking.Click here to see the full State ranking.
43% lower than Colorado average

Colorado average: $40K

Number of fines 1
55% fewer fines than Colorado average

Colorado average: 2.2

Payment Denials Info Serious action where Medicare and/or Medicaid temporarily stops payments for new residents until issues are fixed. 1
276% more payment denials than Colorado average

Colorado average: 0.3

Fines amount comparison
This facility $23K
Colorado average $40K
Penalty History

Penalties are imposed by CMS for violations of federal nursing home regulations.

2 penalties in the past 3 years

Multiple penalties were reported in the last 3 years.

Civil Money Penalty Info Fines imposed for noncompliance, which can be assessed per day or per instance of violation. Jun 11, 2024
$23K
Payment Denial Info Serious action where Medicare and/or Medicaid temporarily stops payments for new residents until issues are fixed. Jan 8, 2024
15 days

Last updated: Jan 2026

Quality of care over time

These measures show how residents usually do over time at this home, based on health outcomes and preventive care.

High-risk clinical events score Info A composite score based on pressure ulcers, falls with injury, weight loss, walking ability decline, and activities of daily living decline. 9.9
9% worse than Colorado average

Colorado average: 9.0

Functional decline score Info A composite score based on activities of daily living decline, walking ability decline, and incontinence. 21.0
12% worse than Colorado average

Colorado average: 18.8

Long-stay resident measures
Need for Help with Daily Activities Increased Info Percent of long-stay residents whose need for help with daily activities has increased 17.1%
6% worse than Colorado average

Colorado average: 16.0%

Walking Ability Worsened Info Percent of long-stay residents whose ability to move independently worsened 22.0%
29% worse than Colorado average

Colorado average: 17.0%

Low Risk Residents with Bowel/Bladder Incontinence Info Percent of low risk long-stay residents who lose control of their bowels or bladder 24.0%
In line with Colorado average

Colorado average: 23.2%

Falls with Major Injury Info Percent of long-stay residents experiencing one or more falls with major injury 1.3%
61% better than Colorado average

Colorado average: 3.3%

High Risk Residents with Pressure Ulcers Info Percent of long-stay high risk residents with pressure ulcers 2.6%
33% better than Colorado average

Colorado average: 3.9%

Urinary Tract Infection Info Percent of long-stay residents with a urinary tract infection 0.8%
45% better than Colorado average

Colorado average: 1.4%

Lost Too Much Weight Info Percent of long-stay residents who lose too much weight 6.4%
22% worse than Colorado average

Colorado average: 5.2%

Depressive Symptoms Info Percent of long-stay residents who have depressive symptoms 5.8%
20% better than Colorado average

Colorado average: 7.2%

Antipsychotic Use Info Percent of long-stay residents who received an antipsychotic medication 20.7%
10% worse than Colorado average

Colorado average: 18.8%

Pneumococcal Vaccine Info Percent of long-stay residents assessed and appropriately given the pneumococcal vaccine 90.2%
In line with Colorado average

Colorado average: 93.3%

Influenza Vaccine Info Percent of long-stay residents assessed and appropriately given the seasonal influenza vaccine 91.1%
In line with Colorado average

Colorado average: 94.7%

Short-stay resident measures
Pneumococcal Vaccine Info Percent of short-stay residents assessed and appropriately given the pneumococcal vaccine 73.7%
In line with Colorado average

Colorado average: 76.6%

Antipsychotic medication increase Info Percent of short-stay residents who newly received an antipsychotic medication 0.0%
100% better than Colorado average

Colorado average: 1.4%

Influenza Vaccine Info Percent of short-stay residents assessed and appropriately given the seasonal influenza vaccine 67.7%
10% worse than Colorado average

Colorado average: 75.6%

Breakdown by payment type

Medicare

19% of new residents, usually for short-term rehab.

Typical stay 25 days

Private pay

43% of new residents, often for short stays.

Typical stay 1 - 2 months

Medicaid

38% of new residents, often for long-term daily care.

Typical stay 8 - 9 months

Facility Characteristics

Source: CMS Long-Term Care Facility Characteristics (Data as of Jan 2026)

Total residents 106
Medicare
10
9.4% of residents
Medicaid
88
83% of residents
Private pay or other
8
7.5% of residents
Programs & Services
Residents Group

Residents meet regularly to discuss policies, care quality, and activities

Family Member Group

Family members meet regularly to discuss policies, care quality, and activities

Active Family Council

Organized group of family members that meets regularly to discuss facility policies, resident care, and activities.

Active Resident Council

Organized group of residents that meets regularly to discuss facility policies, quality of life, and activities.

Finances and operations

Privately-owned community
Home revenue
$14.9M
Profit
$216.7K
Privately-owned community
Home revenue
$14.9M Rank #53 / 182Revenue — State benchmarkedThis home is ranked 53rd out of 182 homes in Colorado. Shows this facility's annual revenue compared to the Colorado SNF average. Higher revenue generally means more resources for staffing and capital — read alongside Payroll %.Click the rank badge to see the full State ranking.Click here to see the full State ranking.
Profit
$216.7K
Payroll costs Info The portion of the home's budget spent on staff, including nurses, caregivers, and other employees who support care and operations. Rank #34 / 182Payroll — State benchmarkedThis home is ranked 34th out of 182 homes in Colorado. Shows total annual staff payroll benchmarked to the Colorado average. Higher payroll investment relative to peers often signals better staffing and less reliance on cheaper contract labor.Click the rank badge to see the full State ranking.Click here to see the full State ranking.
$9.0M
60.4% of revenue Rank #52 / 182Payroll % — State benchmarkedThis home is ranked 52nd out of 182 homes in Colorado. Shows payroll as a percentage of revenue versus the Colorado average. Well-run Colorado SNFs typically land around 59–66% — the top third Statewide. Below 25% may signal understaffing or heavy agency use — read with Staffing ratings.Click the rank badge to see the full State ranking.Click here to see the full State ranking.
Other operating costs Info All remaining costs needed to run the home, such as food, utilities, building maintenance, supplies and administrative expenses.
$5.7M
Total costs $14.7M

Who this home usually serves

TYPE OF STAY

Mix of rehab and long-term care

This home supports both short-term rehab and long-term care, with residents staying for a wide range of durations.

Places of interest near The Denver Hospice Inpatient Care Center

Address 5.4 miles from city center Info Estimated distance in miles from Denver's city center to The Denver Hospice Inpatient Care Center's address, calculated via Google Maps. — 2.36 miles to nearest hospital (HCA HealthONE Rose)

Calculate Travel Distance to The Denver Hospice Inpatient Care Center

Add your location

Address

Financial Assistance for
Nursing Home in Colorado

The Denver Hospice Inpatient Care Center is located in Denver, Colorado.
Here are the financial assistance programs available to residents in Colorado.

Get Financial aid guidance

Elderly, Blind, and Disabled Waiver

Colorado Medicaid EBD Waiver

Age 65+ or disabled
General Colorado resident, Medicaid- eligible, nursing home-level care need.
Income Limits (2025) ~$2,829/month 300% FBR, individual
Asset Limits $2,000 (individual), $3,000 (couple).
CO

Requires level-of-care assessment by case manager.

Benefits
Personal care (5-7 hours/day) Respite care (up to 240 hours/year) Adult day care ($65/day) Home modifications ($1,500 avg.)

Old Age Pension (OAP) Health Care Program

Colorado OAP

Age 60+
General Colorado resident.
Income Limits ~$1,215/month individual
Asset Limits $2,000 individual
CO

Supplements SSI; limited medical coverage.

Benefits
Cash (~$100-$800/month) Limited in-home care (2-3 hours/week) Medical assistance

Program of All-Inclusive Care for the Elderly (PACE)

Colorado Medicaid PACE

Age 55+
General Colorado resident, nursing home-level care need, safe with PACE support.
Income Limits (2025) ~$2,829/month 300% FBR
Asset Limits $2,000 (individual), $3,000 (couple).
CO

Limited to specific regions (e.g., Denver, Pueblo).

Benefits
All-inclusive care—personal care (5-7 hours/day) Meals Transportation Therapy Medical visits

Home Care Allowance (HCA)

Colorado Home Care Allowance (HCA)

Age
General Seniors typically 65+, Age 5+ with disability, Colorado resident, financial/functional need.
Income Limits (2025) ~$1,004/month individual, stricter than waivers
Asset Limits $2,000 (individual), $3,000 (couple).
CO

Must need help with ADLs; not Medicaid-waiver eligible.

Benefits
Personal care (~4-6 hours/day, paid to provider) E.g. Bathing Dressing

Frequently Asked Questions about The Denver Hospice Inpatient Care Center

What neighborhood is The Denver Hospice Inpatient Care Center in?

The Denver Hospice Inpatient Care Center is in the East neighborhood of Denver.

Who is the owner of The Denver Hospice Inpatient Care Center?

The legal owner and operator of The Denver Hospice Inpatient Care Center is Hospice Of Metro Denver, Inc..

Is The Denver Hospice Inpatient Care Center in a walkable area?

The Denver Hospice Inpatient Care Center has a walk score of 63. Moderately walkable. Some errands can be accomplished on foot, with a mix of nearby amenities.

Who is the administrator of The Denver Hospice Inpatient Care Center?

Tricia Ford is the administrator of The Denver Hospice Inpatient Care Center.

How many beds does The Denver Hospice Inpatient Care Center have?

The Denver Hospice Inpatient Care Center has 28 beds.

What is the phone number of The Denver Hospice Inpatient Care Center?

(303) 418-3000 will put you in contact with the team at The Denver Hospice Inpatient Care Center.

Is The Denver Hospice Inpatient Care Center Medicare or Medicaid certified?

Yes — The Denver Hospice Inpatient Care Center is a CMS-certified provider of Medicare and Medicaid.

Guides for Better Senior Living

Care Cost Calculator: See Prices in Your Area

Nursing Home Data Explorer

Don’t Wait Too Long: 7 Red Flag Signs Your Parent Needs Assisted Living Now

The True Cost of Assisted Living in 2025 – And How Families Are Paying For It

Understanding Senior Living Costs: Pricing Models, Discounts & Financial Assistance

Explore Open Rooms
1 Contact details
2 What type of senior care service are you looking for?
3 What budget do you have in mind for senior care?
4 How soon do you need to find care?
5 Additional details

Thank you for your interest!

Our team will be in touch shortly to help with next steps.