The Oaks of Orangeburg
Nursing Home, Assisted Living, Home Care & Independent Living · Orangeburg, SC
CMS overall rating Info CMS (the Centers for Medicare & Medicaid Services) is the federal agency that rates nursing home quality. Its Overall Rating runs from 1 to 5 stars, combining health inspections, staffing, and quality measures, with inspections weighted most heavily.

The Oaks of Orangeburg

Nursing Home, Assisted Living, Home Care & Independent Living · Orangeburg, SC
CMS overall rating Info CMS (the Centers for Medicare & Medicaid Services) is the federal agency that rates nursing home quality. Its Overall Rating runs from 1 to 5 stars, combining health inspections, staffing, and quality measures, with inspections weighted most heavily.
Calculator: See prices in your area
The Oaks of Orangeburg accepts Medicare, Medicaid, and private pay.

Overview of The Oaks of Orangeburg

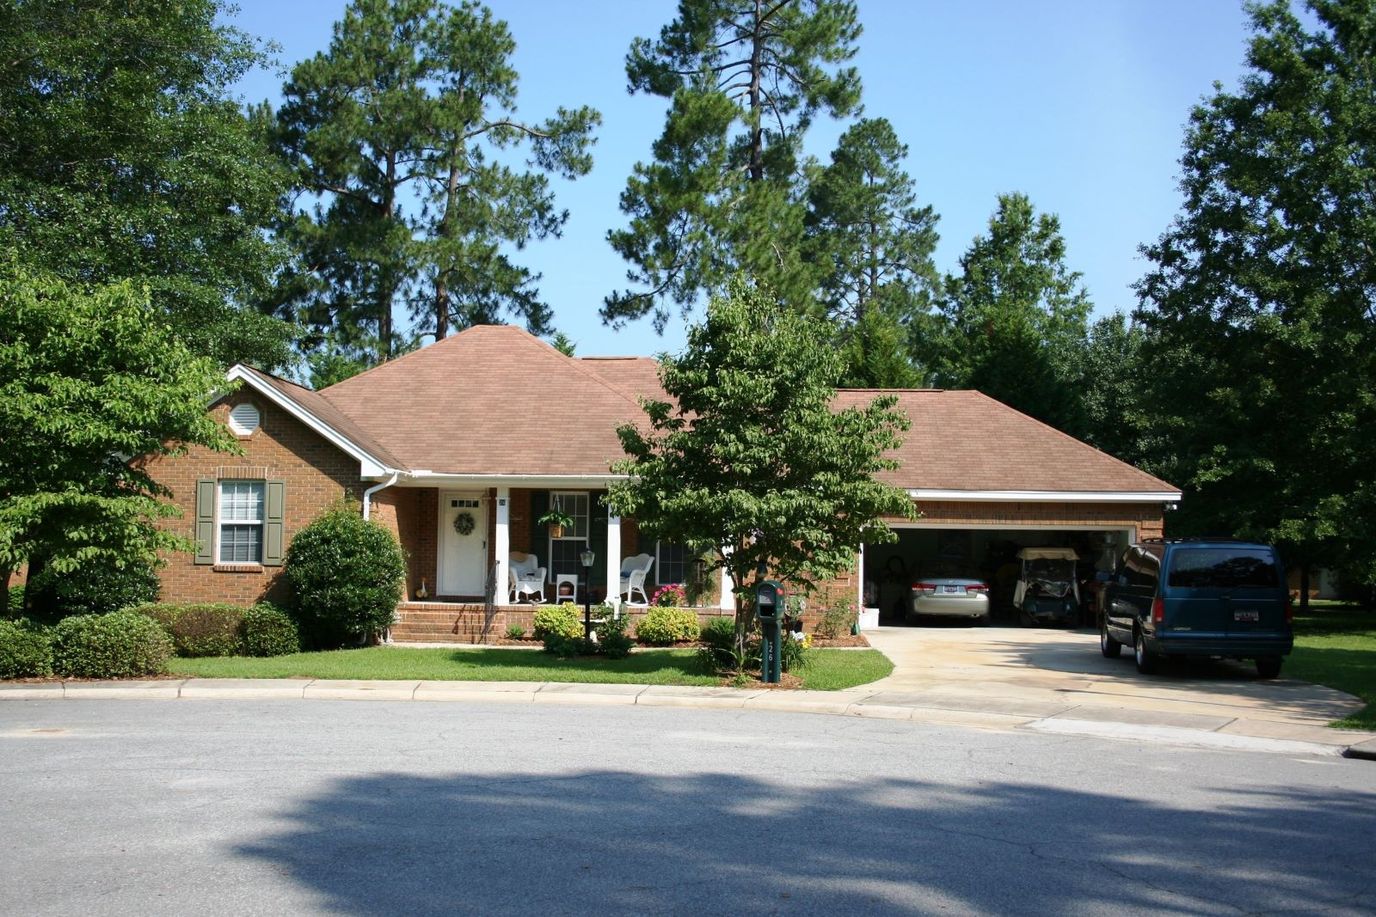
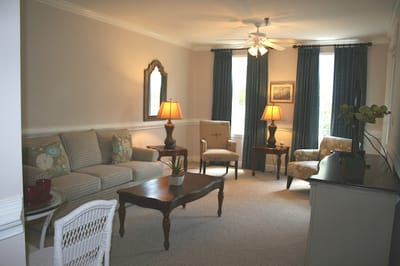
The Oaks of Orangeburg, a 122-bed church-affiliated nursing facility at 1000 Methodist Oaks Dr in Orangeburg, South Carolina, has operated as a nonprofit since 1956 under the leadership of owner-operator Joseph Fowler.

Spanning 650 acres with nearly 300 living accommodations, the community provides nursing home, independent living, assisted living, and home care across a 3-story building. It accepts Medicare (average 22-day stay), Medicaid (average 9-month stay), and private pay (average 1–2 month stay) populations. Minimum resident age is 55 years; pets are permitted.

The campus features recreational facilities and programming: fitness center, heated pool with personal training programs, exercise classes, bocce games, kayaking, and arts and crafts activities. Operational services include round-the-clock security and scheduled transportation to local medical appointments.

The facility operates at an annual deficit of $263,500 and occupies 76.8% of beds; below the South Carolina average of 82.1%.

Its location, in rural Orangeburg County, registers a walk score of 0 (completely car-dependent); the nearest hospital lies 5.31 miles away.

Nurses provide 2 hours 59 minutes of care per resident per day; 27% below the South Carolina average of 4 hours 5 minutes. Ranked 105th of 112 state facilities in nurse-to-resident ratios, the facility’s weekend coverage drops to 2 hours 25 minutes per resident; still 27% below state norms.

Of 209 total staff, contractors account for 12.2% of quarterly hours; the staff-to-resident ratio of 1.83:1 aligns with the state average.

Payroll represents 55.9% of revenue.

A June 2025 complaint investigation identified a critical deficiency for improper resident restraint (marked corrected). Over five inspections since 2021, the facility accumulated 23 health citations (99th of 113 statewide). Recent citations span Quality of Care (November 2024), pharmacy errors, nutrition practices, and others.

Federal fines totaled $122,000 across 14 penalty actions over three years; 264% above the state average.

Most significantly, preventive care falls far short of standards: pneumococcal vaccination coverage reaches only 26.9% for short-stay residents (66% worse than the 79.5% state average) and 35.8% for long-stay residents (60% worse than 90.5%). Influenza vaccination rates track similarly low at 26.6% and 62.7% respectively. Functional decline and high-risk events score better than state average, but falls with major injury occur at 5.6%; 89% worse than the state average of 3.0%.

The community is organized for short-term Medicare rehabilitation and longer-stay private-pay and Medicaid admissions on a rural, car-dependent campus where low staffing levels and vaccine compliance gaps present measurable clinical risk.

Quality ratings

Measured by Centers for Medicare & Medicaid Services (CMS)

Overall rating Info The Overall CMS Rating combines results from health inspections, staffing levels and quality measures. Health inspections carry the most weight. Staffing and quality scores can increase or decrease the final rating based on performance compared to state and national standards.
▼ 64.8% Below SC avg. ▼ 64.8% Below SC avg.SC average: 2.8Click the badge to see the full State ranking.Click here to see the full State ranking.
Health Inspection Info Based on the results of the facility's three most recent standard inspections and any complaint investigations. CMS reviews the number, scope, and severity of deficiencies, with more recent findings weighted more heavily.
▼ 63.5% Below SC avg. ▼ 63.5% Below SC avg.SC average: 2.7Click the badge to see the full State ranking.Click here to see the full State ranking.
Staffing Info Measures average nursing staff hours per resident per day, including Registered Nurses (RNs) and total nursing staff. Ratings are adjusted based on the level of care residents require and are compared to state and national benchmarks.
▼ 30.8% Below SC avg. ▼ 30.8% Below SC avg.SC average: 2.9Click the badge to see the full State ranking.Click here to see the full State ranking.
Quality Measures Info Based on clinical and physical health indicators reported to CMS, such as hospital readmissions, falls, pressure ulcers, and improvements in mobility. These measures reflect how well residents' health needs are being managed.
▲ 19.0% Above SC avg. ▲ 19.0% Above SC avg.SC average: 3.4Click the badge to see the full State ranking.Click here to see the full State ranking.

Staffing hours breakdown

Info Daily nursing hours per resident by staff type, reported to CMS. Higher is generally better — compare this facility to state and national averages to see where staffing stands.

Hours per resident per day — compared to South Carolina state averages

Total nursing care / resident Info This home is ranked 114th out of 121 homes in South Carolina for nurse hours. Total adjusted nursing hours per resident per day, combining RN, LPN, and aide time. CMS adjusts this for case-mix so facilities can be fairly compared.
2h 59m per day
Rank #114 / 121Nurse hours — State benchmarkedThis home is ranked 114th out of 121 homes in South Carolina. Shows adjusted nurse hours per resident per day benchmarked to the South Carolina average, with a ranking across 121 South Carolina facilities. More hours mean more direct care. The national average is about 3.5 hrs; below 3.0 is a red flag.Rankings are based only on facilities in South Carolina that report data for that category. Facilities without available data are excluded from the ranking.Click the rank badge to see the full State ranking.Click here to see the full State ranking.
This facility South Carolina avg (4h 0m per day)
vs South Carolina avg
-25%

5 of 6 metrics below state avg

Standout metric LPN / LVN is +10% above state avg
Staff typeHours / Day / Residentvs state avg
Registered Nurse (RN) Info RNs hold the highest nursing license and can assess residents, interpret test results, and direct care plans. More RN hours per day often signals stronger clinical oversight and faster response to health changes. 11m per day ▼ 71% State avg: 38m per day · National avg: 41m per day
LPN / LVN Info Licensed Practical Nurses (LPNs) or Licensed Vocational Nurses (LVNs) deliver routine hands-on care — medication administration, wound dressing, and monitoring vital signs. They work under RN supervision and make up a large share of daily bedside care. 1h 6m per day ▲ 10% State avg: 1h 0m per day · National avg: 52m per day
Nurse Aide Info Certified Nurse Aides (CNAs) provide the most direct day-to-day assistance: bathing, dressing, feeding, and mobility. Nurse aide hours are typically the largest staffing category and directly affect residents' quality of life. 1h 44m per day ▼ 22% State avg: 2h 13m per day · National avg: 2h 20m per day
Weekend Total Nursing Info Combined nursing hours (RN + LPN + Nurse Aide) per resident per day on weekends. Staffing often drops on weekends — this figure reveals whether the facility maintains adequate coverage outside of weekday hours. 2h 41m per day ▼ 20% State avg: 3h 22m per day · National avg: 3h 27m per day
Physical Therapist Info Hours per resident per day provided by licensed Physical Therapists (PTs) or PT Assistants. PT services help residents recover mobility after injury or illness and are especially important for post-acute (short-stay) rehabilitation. 3m per day ▼ 41% State avg: 5m per day · National avg: 4m per day
Weekend RN Info Registered nurse hours specifically on weekends. Facilities sometimes reduce RN presence on Saturdays and Sundays — a low weekend RN figure compared to weekday hours can indicate reduced clinical oversight when most administrative staff are absent. 6m per day ▼ 76% State avg: 25m per day · National avg: 29m per day

Capacity and availability

This home usually has availability

Lower occupancy than the South Carolina average: 82.1%
Occupancy rate
76.8% Rank #95 / 131Occupancy rate — State benchmarkedThis home is ranked 95th out of 131 homes in South Carolina. Shows this facility's occupancy rate versus the South Carolina average, with its Statewide rank out of 131. Higher occupancy signals strong local demand and financial stability.Rankings are based only on facilities in South Carolina that report data for that category. Facilities without available data are excluded from the ranking.Click the rank badge to see the full State ranking.Click here to see the full State ranking.
Avg. Length of Stay
86 days
Bed community size
122-bed community Rank #61 / 309Bed count — State benchmarkedThis home is ranked 61st out of 309 homes in South Carolina. Shows this facility's certified or reported bed count compared to other South Carolina facilities. Larger communities may offer more amenities, programs, and on-site services for residents and families.Rankings are based only on facilities in South Carolina that report data for that category. Facilities without available data are excluded from the ranking.Click the rank badge to see the full State ranking.Click here to see the full State ranking.
A larger shared setting that may offer more common spaces and organized community services.
Walk Score
Walk Score: 0 / 100 Rank #229 / 232Walk Score — State benchmarkedThis home is ranked 229th out of 232 homes in South Carolina. Shows how walkable this facility's neighborhood is compared to the average Walk Score across South Carolina facilities. Higher scores benefit residents, families, and staff.Rankings are based only on facilities in South Carolina that report data for that category. Facilities without available data are excluded from the ranking.Click the rank badge to see the full State ranking.Click here to see the full State ranking.
Car-dependent. Most errands require a car, with limited nearby walkable options.
BBB Rating
BBB Rating: A+ (Not Accredited)
An independent rating from the Better Business Bureau based on factors such as complaint history, transparency, and business practices.
How BBB ratings work

Staffing

Key information about the people who lead and staff this community.

Leadership

ContactReverend James McGee, CEO

Staff Details

Total Employees
351
Full-Time Employees
351

Contact The Oaks of Orangeburg

Health Inspection History

Inspections since 2021
Total health inspections 5

South Carolina average 3.9


Last Health inspection on Jun 2025

Total health citations
23 Rank #107 / 122Health citations — State benchmarkedThis home is ranked 107th out of 122 homes in South Carolina. Shows this facility's total health deficiency citations benchmarked to the South Carolina State average, with a ranking across all 122 SC facilities. Lower citation counts earn a better rank.Rankings are based only on facilities in South Carolina that report data for that category. Facilities without available data are excluded from the ranking.Click the rank badge to see the full State ranking.Click here to see the full State ranking.

South Carolina average 13.7

Citations per inspection
4.6 Rank #97 / 122Citations per inspection — State benchmarkedThis home is ranked 97th out of 122 homes in South Carolina. Shows average deficiency citations per CMS inspection for this facility versus the South Carolina mean across 122 facilities with citation data. Lower is better.Rankings are based only on facilities in South Carolina that report data for that category. Facilities without available data are excluded from the ranking.Click the rank badge to see the full State ranking.Click here to see the full State ranking.

South Carolina average 3.44


Health citations are formal notices following inspections when they fail to comply with safety and care standards.

20 of 23 citations resulted from standard inspections; and 3 of 23 resulted from complaint investigations.

Breakdown of citation severity (last 5 years)
Critical health citations
1
In line with South Carolina average

South Carolina average: 1


Serious health citations
0
100% better than South Carolina average

South Carolina average: 0.3

1 critical citation South Carolina average: 1

0 serious citations South Carolina average: 0.3

22 moderate citations South Carolina average: 12.3

0 minor citations South Carolina average: 0.1
Citations history (last 5 years)
Abuse/Neglect moderate citation Jun 24, 2025
Corrected

Nutrition moderate citation Nov 05, 2024
Corrected

Pharmacy moderate citation Nov 05, 2024
Corrected

Quality of Care moderate citation Nov 05, 2024
Corrected

Staffing Data

Reporting period: October 1 – December 31, 2025 (Q4 2025). Source: CMS Payroll-Based Journal report.

Total staff 209
Employees 104
Contractors 105
Staff to resident ratio 1.83 : 1
0% compared with South Carolina average
South Carolina average ratio: 1.84 : 1 South Carolina average ratio: 1.84 : 1See full South Carolina ranking
Avg staff/day 46
Average shift 8.9 hours
13% better than South Carolina average
South Carolina average: 7.9 hours South Carolina average shift: 7.9 hoursSee full South Carolina ranking
Total staff hours (quarter) 37,470

Nursing staff breakdown

Q4 2025 · Oct 1 – Dec 31 More info This data comes from the CMS Payroll-Based Journal report covering October 1 – December 31, 2025.
Registered Nurse

Manages medical care and health needs.

RN Staff Info All 8 RN Staff are full-time employees. No contractors work on this role. 8
Average shift length Info Average shift length. Calculated as total hours divided by days worked and average staff per day. 11 hours
Licensed Practical Nurse

Assists with medical care and medications.

LPN Staff Info 60 total: 29 full-time employees and 31 contractors. 60
Average shift length Info Average shift length. Calculated as total hours divided by days worked and average staff per day. 9.7 hours
Certified Nursing Assistant

Helps with daily care and mobility.

CNA Staff Info 116 total: 45 full-time employees and 71 contractors. 116
Average shift length Info Average shift length. Calculated as total hours divided by days worked and average staff per day. 9.3 hours

Contractor staffing

Q4 2025 · Oct 1 – Dec 31 More info This data comes from the CMS Payroll-Based Journal report covering October 1 – December 31, 2025.

Total hours from contractors

12.2%

4,574 contractor hours this quarter

Certified Nursing Assistant: 71 Licensed Practical Nurse: 31 Feeding Assistant: 2 Medical Director: 1

Staff by category

Q4 2025 · Oct 1 – Dec 31 More info This data comes from the CMS Payroll-Based Journal report covering October 1 – December 31, 2025.
Certified Nursing Assistant457111618,34392100%9.3
Licensed Practical Nurse29316011,08192100%9.7
Registered Nurse8088845863%11
Speech Language Pathologist5056356975%5.8
RN Director of Nursing2026116470%8
Feeding Assistant0225826368%7.6
Physical Therapy Aide3035356470%7.3
Nurse Practitioner1015206571%8
Clinical Nurse Specialist1015206571%8
Administrator1015126470%8
Dietitian1015126470%8
Dental Services Staff1015126470%8
Respiratory Therapy Technician2025086368%5.7
Other Dietary Services Staff1014536470%7.1
Physical Therapy Assistant1014146672%6.3
Mental Health Service Worker1014116267%6.6
Qualified Social Worker2024066267%6.4
Medical Director011301415%2.1
116 Certified Nursing Assistant
% of Days 100%
60 Licensed Practical Nurse
% of Days 100%
8 Registered Nurse
% of Days 63%
5 Speech Language Pathologist
% of Days 75%
2 RN Director of Nursing
% of Days 70%
2 Feeding Assistant
% of Days 68%
3 Physical Therapy Aide
% of Days 70%
1 Nurse Practitioner
% of Days 71%
1 Clinical Nurse Specialist
% of Days 71%
1 Administrator
% of Days 70%
1 Dietitian
% of Days 70%
1 Dental Services Staff
% of Days 70%
2 Respiratory Therapy Technician
% of Days 68%
1 Other Dietary Services Staff
% of Days 70%
1 Physical Therapy Assistant
% of Days 72%
1 Mental Health Service Worker
% of Days 67%
2 Qualified Social Worker
% of Days 67%
1 Medical Director
% of Days 15%

Penalties and fines

Includes penalties issued in 2023-2024

Federal penalties imposed by CMS for regulatory violations, including civil money penalties (fines) and denials of payment for new Medicare/Medicaid admissions.

Source: CMS Penalties Database (Data as of Jan 2026)

Total fines amount $122K Rank #122 / 123Federal fines — State benchmarkedThis home is ranked 122nd out of 123 homes in South Carolina. Shows this facility's cumulative CMS federal fine dollars versus the South Carolina average among facilities with fines, and where it ranks among 123 facilities in the pool. Lower total dollars mean a better rank.Rankings are based only on facilities in South Carolina that report data for that category. Facilities without available data are excluded from the ranking.Click the rank badge to see the full State ranking.Click here to see the full State ranking.
264% higher than South Carolina average

South Carolina average: $34K

Number of fines 15
515% more fines than South Carolina average

South Carolina average: 2.4

Payment Denials Info Serious action where Medicare and/or Medicaid temporarily stops payments for new residents until issues are fixed. 0
100% fewer payment denials than South Carolina average

South Carolina average: 0.1

Fines amount comparison
This facility $122K
South Carolina average $34K
Penalty History

Penalties are imposed by CMS for violations of federal nursing home regulations.

14 penalties in the past 3 years

Multiple penalties were reported in the last 3 years.

Civil Money Penalty Info Fines imposed for noncompliance, which can be assessed per day or per instance of violation. Nov 5, 2024
$14K
Civil Money Penalty Info Fines imposed for noncompliance, which can be assessed per day or per instance of violation. Feb 20, 2024
$5K
Civil Money Penalty Info Fines imposed for noncompliance, which can be assessed per day or per instance of violation. Feb 12, 2024
$5K
Civil Money Penalty Info Fines imposed for noncompliance, which can be assessed per day or per instance of violation. Jan 22, 2024
$15K

Last updated: Jan 2026

Quality of care over time

These measures show how residents usually do over time at this home, based on health outcomes and preventive care.

High-risk clinical events score Info A composite score based on pressure ulcers, falls with injury, weight loss, walking ability decline, and activities of daily living decline. 6.6
24% better than South Carolina average

South Carolina average: 8.7

Functional decline score Info A composite score based on activities of daily living decline, walking ability decline, and incontinence. 11.0
29% better than South Carolina average

South Carolina average: 15.5

Long-stay resident measures
Need for Help with Daily Activities Increased Info Percent of long-stay residents whose need for help with daily activities has increased 9.6%
26% better than South Carolina average

South Carolina average: 13.1%

Walking Ability Worsened Info Percent of long-stay residents whose ability to move independently worsened 5.8%
64% better than South Carolina average

South Carolina average: 16.2%

Low Risk Residents with Bowel/Bladder Incontinence Info Percent of low risk long-stay residents who lose control of their bowels or bladder 17.5%
In line with South Carolina average

South Carolina average: 17.0%

Falls with Major Injury Info Percent of long-stay residents experiencing one or more falls with major injury 5.6%
89% worse than South Carolina average

South Carolina average: 3.0%

High Risk Residents with Pressure Ulcers Info Percent of long-stay high risk residents with pressure ulcers 6.0%
In line with South Carolina average

South Carolina average: 6.1%

Urinary Tract Infection Info Percent of long-stay residents with a urinary tract infection 1.9%
13% worse than South Carolina average

South Carolina average: 1.6%

Lost Too Much Weight Info Percent of long-stay residents who lose too much weight 6.0%
In line with South Carolina average

South Carolina average: 6.2%

Depressive Symptoms Info Percent of long-stay residents who have depressive symptoms 1.1%
59% better than South Carolina average

South Carolina average: 2.8%

Antipsychotic Use Info Percent of long-stay residents who received an antipsychotic medication 5.1%
65% better than South Carolina average

South Carolina average: 14.5%

Pneumococcal Vaccine Info Percent of long-stay residents assessed and appropriately given the pneumococcal vaccine 35.8%
60% worse than South Carolina average

South Carolina average: 90.5%

Influenza Vaccine Info Percent of long-stay residents assessed and appropriately given the seasonal influenza vaccine 62.7%
31% worse than South Carolina average

South Carolina average: 90.6%

Short-stay resident measures
Pneumococcal Vaccine Info Percent of short-stay residents assessed and appropriately given the pneumococcal vaccine 26.9%
66% worse than South Carolina average

South Carolina average: 79.5%

Antipsychotic medication increase Info Percent of short-stay residents who newly received an antipsychotic medication 2.2%
31% worse than South Carolina average

South Carolina average: 1.7%

Influenza Vaccine Info Percent of short-stay residents assessed and appropriately given the seasonal influenza vaccine 26.6%
66% worse than South Carolina average

South Carolina average: 78.0%

Breakdown by payment type

Medicare

36% of new residents, usually for short-term rehab.

Typical stay 22 days

Private pay

45% of new residents, often for short stays.

Typical stay 1 - 2 months

Medicaid

19% of new residents, often for long-term daily care.

Typical stay 9 months

Facility Characteristics

Source: CMS Long-Term Care Facility Characteristics (Data as of Jan 2026)

Total residents 114
Medicare
12
10.5% of residents
Medicaid
63
55.3% of residents
Private pay or other
39
34.2% of residents
Programs & Services
Residents Group

Residents meet regularly to discuss policies, care quality, and activities

Active Resident Council

Organized group of residents that meets regularly to discuss facility policies, quality of life, and activities.

Finances and operations

Based on CMS SNF Cost Report for fiscal year ending in 09/2023.

For-profit
Operated by a single business entity.
Net patient revenue Info Net patient revenue — what the home actually collects for resident care, after contractual allowances, bad debt and discounts are subtracted from its gross charges (CMS cost report, Worksheet G-3). It covers resident care only; money the home earns from other sources is shown separately as "Other income."
$11.0M
Net patient income Info Net patient income: net patient revenue minus the home's total operating expenses. A positive figure means it earns more from resident care than it spends to deliver it; a negative figure means the opposite. It excludes non-operating "other income."
-$267.4K
For-profit Operated by a single business entity.
Net patient revenue Info Net patient revenue — what the home actually collects for resident care, after contractual allowances, bad debt and discounts are subtracted from its gross charges (CMS cost report, Worksheet G-3). It covers resident care only; money the home earns from other sources is shown separately as "Other income."
$11.0M Rank #67 / 125Revenue — State benchmarkedThis home is ranked 67th out of 125 homes in South Carolina. Shows this facility's annual revenue compared to the South Carolina average. Higher revenue generally means more resources for staffing and capital — read alongside Payroll %.Rankings are based only on facilities in South Carolina that report data for that category. Facilities without available data are excluded from the ranking.Click the rank badge to see the full State ranking.Click here to see the full State ranking.
Net patient income Info Net patient income: net patient revenue minus the home's total operating expenses. A positive figure means it earns more from resident care than it spends to deliver it; a negative figure means the opposite. It excludes non-operating "other income."
-$267.4K
Other income Info Money the home earns outside of resident care — such as investments, grants, rentals and other non-operating sources (CMS cost report, Worksheet G-3). It is tracked separately from net patient revenue: it is not part of that figure, and it is not included in net patient income.
$4.0K
Payroll costs Info Staff salaries plus wage-related costs — benefits such as payroll taxes, health insurance and retirement — from the home's own accounting records (CMS cost report, Worksheet A). Contract or agency labor is counted separately, under other operating costs. Rank #51 / 125Payroll — State benchmarkedThis home is ranked 51st out of 125 homes in South Carolina. Shows total annual staff payroll benchmarked to the South Carolina average. Higher payroll investment relative to peers often signals better staffing and less reliance on cheaper contract labor.Rankings are based only on facilities in South Carolina that report data for that category. Facilities without available data are excluded from the ranking.Click the rank badge to see the full State ranking.Click here to see the full State ranking.
$7.3M 66.3% of net patient revenue Info Payroll as a share of revenue: staff salaries and wage-related benefits divided by net patient revenue. A higher figure means more of each revenue dollar goes to staff pay. Rank #35 / 125Payroll % — State benchmarkedThis home is ranked 35th out of 125 homes in South Carolina. Shows payroll as a percentage of revenue versus the South Carolina average. Well-run South Carolina facilities typically land around 53–64% — the top third Statewide. Below 25% may signal understaffing or heavy agency use — read with Staffing ratings.Rankings are based only on facilities in South Carolina that report data for that category. Facilities without available data are excluded from the ranking.Click the rank badge to see the full State ranking.Click here to see the full State ranking.
Other operating costs Info Everything it costs to run the home apart from payroll — food, utilities, supplies, maintenance, contract labor and administration. Calculated as total operating expense minus payroll (staff salaries and wage-related benefits).
$4.0M
Total costs Info The home's total operating expense for the year — all the costs of running it, salaries included (CMS cost report, Worksheet G-3).
$11.3M

What does this home offer?

Minimum age icon
Minimum age icon

Minimum Age: 55 Years Old

Pets allowed icon
Pets allowed icon

Pets Allowed

Housing options icon

Housing Options: Suite

Building type icon
Building type icon

Building Type: 3-story

Transportation services icon

Transportation Services

Fitness and recreation icon

Fitness and Recreation

Who this home usually serves

TYPE OF STAY

Mix of rehab and long-term care

This home supports both short-term rehab and long-term care, with residents staying for a wide range of durations.

New residents most often arrive under private pay (45% of admissions), and a typical private pay stay runs around 1 - 2 months.

Admissions
415 total

Coverage residents most often arrive under.

Medicare 36%
Private pay 45%
Medicaid 19%
Discharges
397 total

Coverage residents most often leave under.

Medicare 38%
Private pay 46%
Medicaid 17%

Places of interest near The Oaks of Orangeburg

Address 4.7 miles from city center Info Estimated distance in miles from Orangeburg's city center to The Oaks of Orangeburg's address, calculated via Google Maps.

Calculate Travel Distance to The Oaks of Orangeburg

Add your location

Address

Compare Nursing Homes around Columbia

The information below is reported by the South Carolina Department of Public Health, Bureau of Healthcare Quality.

5 facilities compared · CMS & SC Dept. of Health data

Still Hopes Episcopal Retirement Community
NH
AL
IL
MC
West Columbia (Still Hopes Drive)
22
Facility 22
SC AVG 90
Rank #303 / 309
89.1%
Facility 89.1%
SC AVG 82.1%
Rank #38 / 131
+9%- +65%-
$0
Facility $0
SC AVG $34.8k
Rank #1 / 123
5
Facility 5
SC AVG 13.7
Rank #14 / 122
1.3
Facility 1.3
SC AVG 3.4
Rank #3 / 122
121A+
63
Facility 63
SC AVG 32
Rank #14 / 232
Frances Case
$28.0M
Facility $28.0M
SC AVG $13.0M
Rank #2 / 125
$23.0M
Facility $23.0M
SC AVG $5.4M
Rank #3 / 125
82.2%
Facility 82.2%
SC AVG 44%
Rank #41 / 125
425401
Wildewood Downs Retirement Community
NH
AL
IL
MC
Columbia (Williamsburg East)
57
Facility 57
SC AVG 90
Rank #229 / 309
28.1%
Facility 28.1%
SC AVG 82.1%
Rank #127 / 131
-66%
5.41
Facility 5.41
SC AVG 4.00
Rank #10 / 121
+300%+35%
$3.7k
Facility $3.7k
SC AVG $34.8k
Rank #56 / 123
13
Facility 13
SC AVG 13.7
Rank #71 / 122
4.3
Facility 4.3
SC AVG 3.4
Rank #92 / 122
-16A+
33
Facility 33
SC AVG 32
Rank #119 / 232
Diana Chavis
$6.6M
Facility $6.6M
SC AVG $13.0M
Rank #38 / 125
$6.1M
Facility $6.1M
SC AVG $5.4M
Rank #59 / 125
92.9%
Facility 92.9%
SC AVG 44%
Rank #101 / 125
425385
PruittHealth Columbia
NH
AL
Columbia
185
Facility 185
SC AVG 90
Rank #6 / 309
80.8%
Facility 80.8%
SC AVG 82.1%
Rank #86 / 131
-2%
3.17
Facility 3.17
SC AVG 4.00
Rank #103 / 121
-20%-21%
$102.0k
Facility $102.0k
SC AVG $34.8k
Rank #121 / 123
26
Facility 26
SC AVG 13.7
Rank #112 / 122
3.7
Facility 3.7
SC AVG 3.4
Rank #75 / 122
2136-
24
Facility 24
SC AVG 32
Rank #147 / 232
United Health Services Of South Carolina Inc
$12.6M
Facility $12.6M
SC AVG $13.0M
Rank #52 / 125
$7.8M
Facility $7.8M
SC AVG $5.4M
Rank #42 / 125
62.3%
Facility 62.3%
SC AVG 44%
Rank #62 / 125
425013
The Oaks of Orangeburg
NH
AL
HC
IL
Orangeburg (Felder)
122
Facility 122
SC AVG 90
Rank #61 / 309
76.8%
Facility 76.8%
SC AVG 82.1%
Rank #95 / 131
-6%
2.98
Facility 2.98
SC AVG 4.00
Rank #114 / 121
-59%-25%
$111.7k
Facility $111.7k
SC AVG $34.8k
Rank #122 / 123
23
Facility 23
SC AVG 13.7
Rank #107 / 122
4.6
Facility 4.6
SC AVG 3.4
Rank #97 / 122
1115A+
0
Facility 0
SC AVG 32
Rank #229 / 232
Joseph Fowler
$11.0M
Facility $11.0M
SC AVG $13.0M
Rank #67 / 125
$7.3M
Facility $7.3M
SC AVG $5.4M
Rank #51 / 125
66.3%
Facility 66.3%
SC AVG 44%
Rank #35 / 125
425131
The Brian Center Nursing Care – St. Andrews
NH
AL
IL
MC
Columbia (Seven Oaks)
108
Facility 108
SC AVG 90
Rank #98 / 309
28.7%
Facility 28.7%
SC AVG 82.1%
Rank #126 / 131
-65%
4.07
Facility 4.07
SC AVG 4.00
Rank #42 / 121
+36%+2%
$41.0k
Facility $41.0k
SC AVG $34.8k
Rank #113 / 123
41
Facility 41
SC AVG 13.7
Rank #121 / 122
6.8
Facility 6.8
SC AVG 3.4
Rank #120 / 122
431A+
14
Facility 14
SC AVG 32
Rank #178 / 232
-
$7.9M
Facility $7.9M
SC AVG $13.0M
Rank #103 / 125
$4.6M
Facility $4.6M
SC AVG $5.4M
Rank #102 / 125
58.5%
Facility 58.5%
SC AVG 44%
Rank #48 / 125
425129

Financial Assistance for
Nursing Home in South Carolina

The Oaks of Orangeburg is located in Orangeburg, South Carolina.
Here are the financial assistance programs available to residents in South Carolina.

Get Financial aid guidance

Community Long Term Care (CLTC)

SC Medicaid CLTC

Age 65+ or disabled
General South Carolina resident, Medicaid-eligible, nursing home-level care need.
Income Limits (2025) ~$2,829/month 300% FBR, individual
Asset Limits $2,000 (individual), $3,000 (couple).
SC

High rural demand; waitlists possible.

Benefits
Personal care (5-7 hours/day) Respite (240 hours/year) Adult day care ($60/day) Home modifications ($1,500 avg.)

South Carolina Respite Care Program

SC NFCSP Respite

Age Caregiver of someone 60+ (or with dementia)
General South Carolina resident.
Income Limits No strict limit; prioritizes low-income.
Asset Limits Not applicable.
SC

Limited slots; rural/urban balance.

Benefits
In-home respite (4-6 hours/day) Adult day care (~$60/day) Short-term facility care (up to 5 days)

Medicare Savings Program (MSP)

South Carolina Medicare Savings Program

Age 65+ or disabled
General SC resident, Medicare Part A/B.
Income Limits (2025) ~$2,510/month (QMB), ~$3,380/month (SLMB), ~$3,598/month (QI)—individual.
Asset Limits $9,430 (individual), $14,130 (couple).
SC

Three tiers; includes Extra Help for Part D; no waitlist.

Benefits
Covers Part B premiums ($174.70/month) Deductibles ($240/year) Copays (~20%)

VA Aid and Attendance (A&A) and Housebound Benefits

South Carolina VA Aid and Attendance/Housebound

Age 65+ or disabled veteran/spouse
General SC resident, wartime service, need for ADL help (A&A) or homebound.
Income Limits (2025) Net income < ~$1,984/month (veteran with dependent, A&A); pension offsets income.
Asset Limits ~$155,356 net worth limit
SC

High veteran population; supports rural/urban care needs.

Benefits
Cash (~$1,433-$2,642/month veteran, ~$951-$1,318 spouse) for care costs (e.g., in-home, assisted living)

Senior Farmers’ Market Nutrition Program (SFMNP)

South Carolina SFMNP

Age 60+
General SC resident, low-income.
Income Limits (2025) ~$2,322/month individual, 185% FPL
Asset Limits Not assessed.
SC

Vouchers (~$50/season); serves ~20,000 annually via 10 AAAs.

Benefits
Vouchers (~$50/season) for fresh produce at approved markets

Homestead Exemption Program

South Carolina Homestead Exemption

Age 65+ (or disabled/blind)
General SC resident 1+ year, homeowner.
Income Limits (2025) None; tax-based eligibility.
Asset Limits Not assessed; home-focused.
SC

Saves ~$500-$1,000/year avg.; applies to primary residence.

Benefits
Property tax exemption (~$50,000 value, ~$500-$1,000/year savings)

Elderly Simplified Application Project (ESAP)

South Carolina ESAP (SNAP for Seniors)

Age 60+
General SC resident, no earned income, not on SCCAP.
Income Limits (2025) ~$1,732/month 133% FPL, individual
Asset Limits $4,250 individual, higher than standard SNAP
SC

Simplified process; serves ~50,000 seniors annually.

Benefits
EBT card for food (~$100-$300/month based on income)

Frequently Asked Questions about The Oaks of Orangeburg

What neighborhood is The Oaks of Orangeburg in?

The Oaks of Orangeburg is in the Felder neighborhood of Orangeburg.

What is the occupancy rate at The Oaks of Orangeburg?

The Oaks of Orangeburg's occupancy is 76.8%.

Does The Oaks of Orangeburg operate as a for-profit or non-profit?

The Oaks of Orangeburg is registered as a for-profit in SC.

Are there photos of The Oaks of Orangeburg?

Yes — there are 5 photos of The Oaks of Orangeburg in the photo gallery on this page.

What is the address of The Oaks of Orangeburg?

The Oaks of Orangeburg is located at 1000 Methodist Oaks Dr, Orangeburg, SC 29115.

What is the phone number of The Oaks of Orangeburg?

(803) 456-4140 will put you in contact with the team at The Oaks of Orangeburg.

Is The Oaks of Orangeburg Medicare or Medicaid certified?

Yes — The Oaks of Orangeburg is a CMS-certified provider of Medicare and Medicaid.

Guides for Better Senior Living

Care Cost Calculator: See Prices in Your Area

Nursing Home Data Explorer

Don’t Wait Too Long: 7 Red Flag Signs Your Parent Needs Assisted Living Now

The True Cost of Assisted Living in 2025 – And How Families Are Paying For It

Understanding Senior Living Costs: Pricing Models, Discounts & Financial Assistance