The Terrace at The Eddy Memorial
Nursing Home & Assisted Living · New York, NY
CMS overall rating Info CMS (the Centers for Medicare & Medicaid Services) is the federal agency that rates nursing home quality. Its Overall Rating runs from 1 to 5 stars, combining health inspections, staffing, and quality measures, with inspections weighted most heavily.

The Terrace at The Eddy Memorial

Nursing Home & Assisted Living · New York, NY
CMS overall rating Info CMS (the Centers for Medicare & Medicaid Services) is the federal agency that rates nursing home quality. Its Overall Rating runs from 1 to 5 stars, combining health inspections, staffing, and quality measures, with inspections weighted most heavily.
Calculator: See prices in your area
The Terrace at The Eddy Memorial accepts Medicare, Medicaid, and private pay.

Overview of The Terrace at the Eddy Memorial

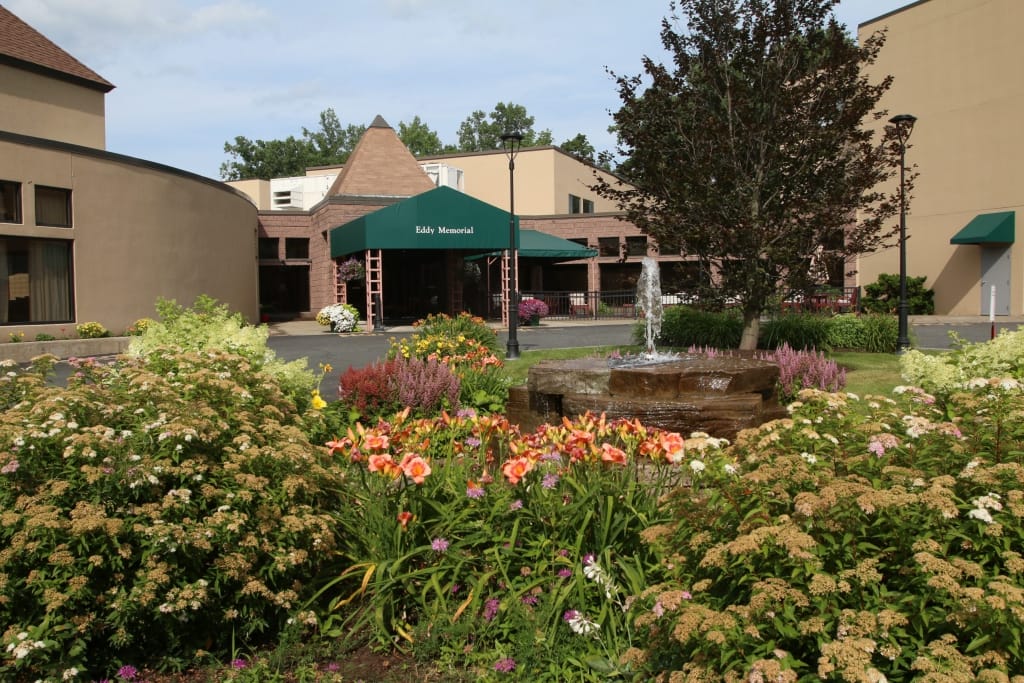
The Terrace at the Eddy Memorial is a 69-bed nonprofit enriched housing community that serves an extended-care resident population recording a 457-day average length of stay. The facility coordinates skilled care and housing under a mixed-payer model driven by 65.6% Medicaid and 30.4% private-pay clients. Monthly base rates range from $4,700 to $6,400, and the building maintains a high 95.6% occupancy rate within an urban neighborhood carrying a Walk Score of 91. Financial records show some structural strain, including a 2023 operating loss of $2 million, though the operator holds payroll stable at 53.5% of incoming revenues.

State licensing and regulatory logs show deep daily personnel coverage alongside repeated administrative hurdles. Front-line nursing attention tracks 30% ahead of the state average, delivering 4 hours and 33 minutes of daily care per resident to rank 31st across New York. However, the property has accumulated 28 citations across four years, a frequency running 115% above the state benchmark, though it holds a clean history of zero federal fines or high-severity safety findings.

The latest routine evaluation in July 2025 flagged eight moderate deficiencies involving medication assistance logs, improper medication storage, food safety items, and general building maintenance, echoing similar administrative trends from prior checkups. Clinical metrics reflect strong resident behavioral health scores and excellent skin integrity, but permanent resident files show higher-than-average numbers for both physical functional decline and serious fall injuries.

Prospective residents looking into regional long-term care or enriched senior housing can consult these public health archives to analyze the provider’s overall trends. Since the official tracking documentation verifies near-capacity occupancy and top-tier daily care hours alongside repeated medication handling corrections, maintenance marks, and elevated long-term fall risks, the paperwork describes a highly utilized community with stable staffing but a need for sharper physical plant and clinical oversight.

(518) 274-9890

Quality ratings

Measured by Centers for Medicare & Medicaid Services (CMS)

Overall rating Info The Overall CMS Rating combines results from health inspections, staffing levels and quality measures. Health inspections carry the most weight. Staffing and quality scores can increase or decrease the final rating based on performance compared to state and national standards.
▼ 2.4% Below NY avg. ▼ 2.4% Below NY avg.NY average: 3.1Click the badge to see the full State ranking.Click here to see the full State ranking.
Health Inspection Info Based on the results of the facility's three most recent standard inspections and any complaint investigations. CMS reviews the number, scope, and severity of deficiencies, with more recent findings weighted more heavily.
▲ 6.0% Above NY avg. ▲ 6.0% Above NY avg.NY average: 2.8Click the badge to see the full State ranking.Click here to see the full State ranking.
Staffing Info Measures average nursing staff hours per resident per day, including Registered Nurses (RNs) and total nursing staff. Ratings are adjusted based on the level of care residents require and are compared to state and national benchmarks.
▲ 10.4% Above NY avg. ▲ 10.4% Above NY avg.NY average: 2.7Click the badge to see the full State ranking.Click here to see the full State ranking.
Quality Measures Info Based on clinical and physical health indicators reported to CMS, such as hospital readmissions, falls, pressure ulcers, and improvements in mobility. These measures reflect how well residents' health needs are being managed.
▲ 4.8% Above NY avg. ▲ 4.8% Above NY avg.NY average: 3.8Click the badge to see the full State ranking.Click here to see the full State ranking.

Staffing hours breakdown

Info Daily nursing hours per resident by staff type, reported to CMS. Higher is generally better — compare this facility to state and national averages to see where staffing stands.

Hours per resident per day — compared to New York state averages

Total nursing care / resident Info This home is ranked 30th out of 407 homes in New York for nurse hours. Total adjusted nursing hours per resident per day, combining RN, LPN, and aide time. CMS adjusts this for case-mix so facilities can be fairly compared.
4h 33m per day
Rank #30 / 407Nurse hours — State benchmarkedThis home is ranked 30th out of 407 homes in New York. Shows adjusted nurse hours per resident per day benchmarked to the New York average, with a ranking across 407 New York facilities. More hours mean more direct care. The national average is about 3.5 hrs; below 3.0 is a red flag.Ranking totals vary by category as each rank only includes facilities that report data for that metric. Homes missing that data point aren't included in the ranking.Click the rank badge to see the full State ranking.Click here to see the full State ranking.
This facility New York avg (3h 35m per day)
vs New York avg
+27%

3 of 6 metrics below state avg

Standout metric Physical Therapist is +67% above state avg
Staff typeHours / Day / Residentvs state avg
Registered Nurse (RN) Info RNs hold the highest nursing license and can assess residents, interpret test results, and direct care plans. More RN hours per day often signals stronger clinical oversight and faster response to health changes. 33m per day ▼ 21% State avg: 42m per day · National avg: 41m per day
LPN / LVN Info Licensed Practical Nurses (LPNs) or Licensed Vocational Nurses (LVNs) deliver routine hands-on care — medication administration, wound dressing, and monitoring vital signs. They work under RN supervision and make up a large share of daily bedside care. 1h 11m per day ▲ 53% State avg: 47m per day · National avg: 52m per day
Nurse Aide Info Certified Nurse Aides (CNAs) provide the most direct day-to-day assistance: bathing, dressing, feeding, and mobility. Nurse aide hours are typically the largest staffing category and directly affect residents' quality of life. 2h 4m per day ▼ 5% State avg: 2h 11m per day · National avg: 2h 20m per day
Weekend Total Nursing Info Combined nursing hours (RN + LPN + Nurse Aide) per resident per day on weekends. Staffing often drops on weekends — this figure reveals whether the facility maintains adequate coverage outside of weekday hours. 3h 21m per day ▲ 4% State avg: 3h 14m per day · National avg: 3h 27m per day
Physical Therapist Info Hours per resident per day provided by licensed Physical Therapists (PTs) or PT Assistants. PT services help residents recover mobility after injury or illness and are especially important for post-acute (short-stay) rehabilitation. 11m per day ▲ 67% State avg: 7m per day · National avg: 4m per day
Weekend RN Info Registered nurse hours specifically on weekends. Facilities sometimes reduce RN presence on Saturdays and Sundays — a low weekend RN figure compared to weekday hours can indicate reduced clinical oversight when most administrative staff are absent. 12m per day ▼ 58% State avg: 29m per day · National avg: 29m per day

Capacity and availability

Avg. Length of Stay
457 days
Bed community size
69-bed community Rank #621 / 748Bed count — State benchmarkedThis home is ranked 621st out of 748 homes in New York. Shows this facility's certified or reported bed count compared to other New York facilities. Larger communities may offer more amenities, programs, and on-site services for residents and families.Ranking totals vary by category as each rank only includes facilities that report data for that metric. Homes missing that data point aren't included in the ranking.Click the rank badge to see the full State ranking.Click here to see the full State ranking.
A moderately sized community that may balance personal attention with shared amenities and social activities.
Walk Score
Walk Score: 91 / 100 Rank #237 / 1173Walk Score — State benchmarkedThis home is ranked 237th out of 1173 homes in New York. Shows how walkable this facility's neighborhood is compared to the average Walk Score across New York facilities. Higher scores benefit residents, families, and staff.Ranking totals vary by category as each rank only includes facilities that report data for that metric. Homes missing that data point aren't included in the ranking.Click the rank badge to see the full State ranking.Click here to see the full State ranking.
Walker's paradise. Daily errands do not require a car, with many shops and services nearby.

About this community

Occupancy

Occupancy rate
96%
Rank #112 / 436Occupancy rate — State benchmarkedThis home is ranked 112th out of 436 homes in New York. Shows this facility's occupancy rate versus the New York average, with its Statewide rank out of 436. Higher occupancy signals strong local demand and financial stability.Ranking totals vary by category as each rank only includes facilities that report data for that metric. Homes missing that data point aren't included in the ranking.Click the rank badge to see the full State ranking.Click here to see the full State ranking.
Higher than the New York average: 88.3%
Occupied beds
66 / 69
Average occupied beds in New York homes 166 beds

License Details

Facility TypeEnriched Housing Program
StatusActive
CountyRensselaer
License Number600-S-001
CMS Certification Number335680

Ownership & Operating Entity

Owner NameThe James A. Eddy Memorial Geriatric Center, Inc.

Safety & Compliance

Wheelchair Accessible

Therapy & Rehabilitation

1 service
Respite Care

Additional Policies & Features

Pets Allowed

Amenities & Lifestyle

Activities Off-Site
Activities On-Site
Air-Conditioning
Beautician On-Site
Cable Or Satellite Tv
Devotional Services Off-Site
Ground Floor Units
Handicap Accessible
Indoor Common Areas
Kitchenette
Outdoor Common Areas
Respite Or Short Term Stays Offered
Wi-Fi/High-Speed Internet
ActivitiesVarious activities designed to promote mental and physical well-being, including brain fitness exercises, day trips, educational speakers, and live entertainment.

Pricing & Financial Information

Starting Price$4,700 - $6,400 per month

Dining & Nutrition

Food DescriptionMeals are served restaurant style with dietary needs in mind, including low/no sodium options and vegetarian meals prepared by a professional chef.

Contact The Terrace at The Eddy Memorial

Inspection History

In New York State, the Department of Health, Office of Aging and Long Term Care performs unannounced onsite inspections to monitor compliance with state and federal healthcare regulations.

Inspection Score Info A composite 0–100 score combining this facility's inspections, citations, complaints, and enforcement actions relative to the New York State state average. The score below shows how many points this facility sits above or below the typical New York State nursing home score (the benchmark); higher is better.

10 points above the New York State average for nursing homes (83/100)

Rank #97 / 593 in New York State Inspection Score — State benchmarked This home is ranked 97th out of 593 homes in New York State. Shows this facility's inspection score compared to the New York State average among 593 comparable communities in the ranking pool. Ranking totals vary by category as each rank only includes facilities that report data for that metric. Homes missing that data point aren't included in the ranking. Inspection score: 93 out of 100. Letter grade A. 10 points above the New York State average for nursing homes (83/100)

Inspection Scorecard Info This scorecard compares key inspection, citation, and complaint metrics at this facility against the New York State state average. Metrics rated ≥15% worse than average are highlighted in red; those ≥15% better are highlighted in green.

Since 2021 vs. New York State state average
Overall vs. NY average 4 Worse Metrics worse than New York State average:
• Total citations (115% above)
• Citations per year (115% above)
• Citations per inspection (400% above)
• Inspection citation rate (127% above)
1 At Avg Metrics at New York State average:
• Inspections with citations (at NY avg)
5 Better Metrics better than New York State average:
• Total inspections (56% below)
• Total complaints (97% below)
• Complaints per year (97% below)
• Complaints per bed (94% below)
• Complaint investigations (100% below)
Latest Inspection July 23, 2025 Renewal

Citations Info Citations are formal regulatory issues recorded during state inspections.

This FacilityNY Averagevs. NY Avg
Total citations Info Formal regulatory issues recorded by inspectors across all inspection types. 2813 This facility has 115% more total citations than a typical New York State nursing home (28 vs. NY avg 13).↑ 115% worse
Citations per year Info Average citations per year since 2021. 5.62.6 This facility has 115% more citations per year than a typical New York State nursing home (5.6 vs. NY avg 2.6).↑ 115% worse
Citations per inspection Info Average citations per inspection. 71.4 This facility has 400% more citations per inspection than a typical New York State nursing home (7 vs. NY avg 1.4).↑ 400% worse

Inspections Info State inspections evaluate whether the facility meets health and safety standards.

This FacilityNY Averagevs. NY Avg
Total inspections Info Combined count of all routine and focused inspections. Excludes complaint investigations. 49 This facility has 56% fewer total inspections than a typical New York State nursing home (4 vs. NY avg 9).↓ 56% better
Inspections with citations Info Inspections that resulted in at least one regulatory citation. 44 This facility has inspections with citations in line with the New York State average (4 vs. NY avg 4).— At avg
Inspection citation rate Info Percentage of inspections that resulted in at least one citation. 100%44% This facility has 56 percentage points higher inspection citation rate than a typical New York State nursing home (100% vs. NY avg 44%).↑ 56% worse

Complaints & Investigations Info Complaints are formal concerns filed by residents, families, or staff. Investigations are on-site follow-ups.

This FacilityNY Averagevs. NY Avg
Total complaints Info Formal expressions of concern made by residents, families, or staff. 279 This facility has 97% fewer total complaints than a typical New York State nursing home (2 vs. NY avg 79).↓ 97% better
Complaints per year Info Average complaints per year since 2021. 0.415.8 This facility has 97% fewer complaints per year than a typical New York State nursing home (0.4 vs. NY avg 15.8).↓ 97% better
Complaints per bed Info Size-adjusted complaint rate based on occupied beds. 0.030.50 This facility has 94% fewer complaints per bed than a typical New York State nursing home (0.03 vs. NY avg 0.5).↓ 94% better
Complaint investigations Info On-site investigations triggered by complaints filed with New York State regulators. 015 This facility has 100% fewer complaint investigations than a typical New York State nursing home (0 vs. NY avg 15).↓ 100% better

Inspection Reports Summary Info An editor-reviewed summary of the themes and findings across this facility's recent inspection reports.

  • July 23, 2025 inspection found 8 deficiencies in medication assistance, food safety, and environmental standards with an approved plan of correction.
  • July 11, 2024 renewal cited 16 violations including resident protections, supervision, medication assistance, and records, indicating widespread compliance issues.
  • October 16, 2024 complaint investigation found no violations and required no plan of correction.

Health Inspection History

Inspections since 2019
Total health inspections 3

New York State average 3.6


Last Health inspection on Aug 2024

Total health citations
17 Rank #207 / 414Health citations — State benchmarkedThis home is ranked 207th out of 414 homes in New York. Shows this facility's total health deficiency citations benchmarked to the New York State average, with a ranking across all 414 NY facilities. Lower citation counts earn a better rank.Ranking totals vary by category as each rank only includes facilities that report data for that metric. Homes missing that data point aren't included in the ranking.Click the rank badge to see the full State ranking.Click here to see the full State ranking.

New York State average 18.5

Citations per inspection
5.67 Rank #272 / 414Citations per inspection — State benchmarkedThis home is ranked 272nd out of 414 homes in New York. Shows average deficiency citations per CMS inspection for this facility versus the New York mean across 414 facilities with citation data. Lower is better.Ranking totals vary by category as each rank only includes facilities that report data for that metric. Homes missing that data point aren't included in the ranking.Click the rank badge to see the full State ranking.Click here to see the full State ranking.

New York State average 5.05


Health citations are formal notices following inspections when they fail to comply with safety and care standards.

16 of 17 citations resulted from standard inspections; and 1 of 17 came from combined inspections (standard and complaint).

Breakdown of citation severity (last 7 years)
Critical health citations
0
100% better than New York State average

New York State average: 0.2


Serious health citations
0
100% better than New York State average

New York State average: 0.2

0 critical citations New York State average: 0.2

0 serious citations New York State average: 0.2

17 moderate citations New York State average: 17.4

0 minor citations New York State average: 0.7
Citations history (last 7 years)
Infection Control moderate citation Aug 09, 2024
Corrected

Nutrition moderate citation Aug 09, 2024
Corrected

Pharmacy moderate citation Aug 09, 2024
Corrected

Quality of Care moderate citation Aug 09, 2024
Corrected

Staffing Data

Reporting period: October 1 – December 31, 2025 (Q4 2025). Source: CMS Payroll-Based Journal report.

Total staff 122
Employees 106
Contractors 16
Staff to resident ratio 1.61 : 1
816% more staff per resident than New York average
New York average ratio: 0.18 : 1 New York average ratio: 0.18 : 1See full New York ranking
Avg staff/day 47
Average shift 7.5 hours
0% compared with New York average
New York average: 7.7 hours New York average shift: 7.7 hoursSee full New York ranking
Total staff hours (quarter) 32,452

Nursing staff breakdown

Q4 2025 · Oct 1 – Dec 31 More info This data comes from the CMS Payroll-Based Journal report covering October 1 – December 31, 2025.
Registered Nurse

Manages medical care and health needs.

RN Staff Info All 2 RN Staff are full-time employees. No contractors work on this role. 2
Average shift length Info Average shift length. Calculated as total hours divided by days worked and average staff per day. 6.1 hours
Licensed Practical Nurse

Assists with medical care and medications.

LPN Staff Info All 32 LPN Staff are full-time employees. No contractors work on this role. 32
Average shift length Info Average shift length. Calculated as total hours divided by days worked and average staff per day. 7.5 hours
Certified Nursing Assistant

Helps with daily care and mobility.

CNA Staff Info All 43 CNA Staff are full-time employees. No contractors work on this role. 43
Average shift length Info Average shift length. Calculated as total hours divided by days worked and average staff per day. 7.8 hours

Contractor staffing

Q4 2025 · Oct 1 – Dec 31 More info This data comes from the CMS Payroll-Based Journal report covering October 1 – December 31, 2025.

Total hours from contractors

8.6%

2,794 contractor hours this quarter

Respiratory Therapy Technician: 7 Qualified Social Worker: 3 Physical Therapy Aide: 2 Physical Therapy Assistant: 1 Occupational Therapy Aide: 1 Medical Director: 1 Feeding Assistant: 1

Staff by category

Q4 2025 · Oct 1 – Dec 31 More info This data comes from the CMS Payroll-Based Journal report covering October 1 – December 31, 2025.
Certified Nursing Assistant4304314,03792100%7.8
Licensed Practical Nurse320328,30492100%7.5
Clinical Nurse Specialist120123,2289199%7.4
Other Dietary Services Staff5051,7608997%7.7
Respiratory Therapy Technician0771,31192100%6.9
Occupational Therapy Aide0115286672%8
Nurse Practitioner1014976267%8
Nurse Aide in Training7074895459%7.5
Dietitian1014716065%7.8
Physical Therapy Assistant0114435964%7.5
Administrator1013844852%8
Mental Health Service Worker2023485054%6.1
Qualified Social Worker0332265054%3.9
Feeding Assistant0112082628%8
Registered Nurse2021412224%6.1
Medical Director011521314%4
Physical Therapy Aide02226910%2.9
43 Certified Nursing Assistant
% of Days 100%
32 Licensed Practical Nurse
% of Days 100%
12 Clinical Nurse Specialist
% of Days 99%
5 Other Dietary Services Staff
% of Days 97%
7 Respiratory Therapy Technician
% of Days 100%
1 Occupational Therapy Aide
% of Days 72%
1 Nurse Practitioner
% of Days 67%
7 Nurse Aide in Training
% of Days 59%
1 Dietitian
% of Days 65%
1 Physical Therapy Assistant
% of Days 64%
1 Administrator
% of Days 52%
2 Mental Health Service Worker
% of Days 54%
3 Qualified Social Worker
% of Days 54%
1 Feeding Assistant
% of Days 28%
2 Registered Nurse
% of Days 24%
1 Medical Director
% of Days 14%
2 Physical Therapy Aide
% of Days 10%

Penalties and fines

Federal penalties imposed by CMS for regulatory violations, including civil money penalties (fines) and denials of payment for new Medicare/Medicaid admissions.

Source: CMS Penalties Database

No penalties in the past 3 years

No civil money penalties or payment denials were reported in the last 3 years.

Quality of care over time

These measures show how residents usually do over time at this home, based on health outcomes and preventive care.

High-risk clinical events score Info A composite score based on pressure ulcers, falls with injury, weight loss, walking ability decline, and activities of daily living decline. 11.4
16% worse than New York State average

New York State average: 9.8

Functional decline score Info A composite score based on activities of daily living decline, walking ability decline, and incontinence. 25.3
39% worse than New York State average

New York State average: 18.1

Long-stay resident measures
Need for Help with Daily Activities Increased Info Percent of long-stay residents whose need for help with daily activities has increased 26.0%
58% worse than New York State average

New York State average: 16.4%

Walking Ability Worsened Info Percent of long-stay residents whose ability to move independently worsened 21.6%
30% worse than New York State average

New York State average: 16.6%

Low Risk Residents with Bowel/Bladder Incontinence Info Percent of low risk long-stay residents who lose control of their bowels or bladder 28.2%
32% worse than New York State average

New York State average: 21.4%

Falls with Major Injury Info Percent of long-stay residents experiencing one or more falls with major injury 4.0%
34% worse than New York State average

New York State average: 3.0%

High Risk Residents with Pressure Ulcers Info Percent of long-stay high risk residents with pressure ulcers 3.2%
55% better than New York State average

New York State average: 7.2%

Urinary Tract Infection Info Percent of long-stay residents with a urinary tract infection 1.0%
29% better than New York State average

New York State average: 1.4%

Lost Too Much Weight Info Percent of long-stay residents who lose too much weight 2.1%
66% better than New York State average

New York State average: 6.1%

Depressive Symptoms Info Percent of long-stay residents who have depressive symptoms 0.7%
96% better than New York State average

New York State average: 18.1%

Antipsychotic Use Info Percent of long-stay residents who received an antipsychotic medication 15.3%
22% worse than New York State average

New York State average: 12.6%

Pneumococcal Vaccine Info Percent of long-stay residents assessed and appropriately given the pneumococcal vaccine 92.7%
In line with New York State average

New York State average: 91.4%

Influenza Vaccine Info Percent of long-stay residents assessed and appropriately given the seasonal influenza vaccine 98.7%
In line with New York State average

New York State average: 95.2%

Short-stay resident measures
Pneumococcal Vaccine Info Percent of short-stay residents assessed and appropriately given the pneumococcal vaccine 88.5%
15% better than New York State average

New York State average: 76.6%

Breakdown by payment type

Medicare

23% of new residents, usually for short-term rehab.

Typical stay 2 - 3 months

Private pay

51% of new residents, often for short stays.

Typical stay 8 months

Medicaid

26% of new residents, often for long-term daily care.

Typical stay 3 years

Facility Characteristics

Source: CMS Long-Term Care Facility Characteristics (Data as of Jan 2026)

Total residents 76
Medicare
2
2.6% of residents
Medicaid
49
64.5% of residents
Private pay or other
25
32.9% of residents
Programs & Services
Residents Group

Residents meet regularly to discuss policies, care quality, and activities

Active Resident Council

Organized group of residents that meets regularly to discuss facility policies, quality of life, and activities.

Finances and operations

Based on CMS SNF Cost Report for fiscal year ending in 12/2023.

Governmental community
Operated by a subsidized facility district.
Net patient revenue Info Net patient revenue — what the home actually collects for resident care, after contractual allowances, bad debt and discounts are subtracted from its gross charges (CMS cost report, Worksheet G-3). It covers resident care only; money the home earns from other sources is shown separately as "Other income."
$9.2M
Net patient income Info Net patient income: net patient revenue minus the home's total operating expenses. A positive figure means it earns more from resident care than it spends to deliver it; a negative figure means the opposite. It excludes non-operating "other income."
-$5.4M
Governmental community Operated by a subsidized facility district.
Net patient revenue Info Net patient revenue — what the home actually collects for resident care, after contractual allowances, bad debt and discounts are subtracted from its gross charges (CMS cost report, Worksheet G-3). It covers resident care only; money the home earns from other sources is shown separately as "Other income."
$9.2M Rank #311 / 403Revenue — State benchmarkedThis home is ranked 311th out of 403 homes in New York. Shows this facility's annual revenue compared to the New York average. Higher revenue generally means more resources for staffing and capital — read alongside Payroll %.Ranking totals vary by category as each rank only includes facilities that report data for that metric. Homes missing that data point aren't included in the ranking.Click the rank badge to see the full State ranking.Click here to see the full State ranking.
Net patient income Info Net patient income: net patient revenue minus the home's total operating expenses. A positive figure means it earns more from resident care than it spends to deliver it; a negative figure means the opposite. It excludes non-operating "other income."
-$5.4M
Other income Info Money the home earns outside of resident care — such as investments, grants, rentals and other non-operating sources (CMS cost report, Worksheet G-3). It is tracked separately from net patient revenue: it is not part of that figure, and it is not included in net patient income.
$3.3M
Payroll costs Info Staff salaries plus wage-related costs — benefits such as payroll taxes, health insurance and retirement — from the home's own accounting records (CMS cost report, Worksheet A). Contract or agency labor is counted separately, under other operating costs. Rank #295 / 403Payroll — State benchmarkedThis home is ranked 295th out of 403 homes in New York. Shows total annual staff payroll benchmarked to the New York average. Higher payroll investment relative to peers often signals better staffing and less reliance on cheaper contract labor.Ranking totals vary by category as each rank only includes facilities that report data for that metric. Homes missing that data point aren't included in the ranking.Click the rank badge to see the full State ranking.Click here to see the full State ranking.
$8.0M 86.4% of net patient revenue Info Payroll as a share of revenue: staff salaries and wage-related benefits divided by net patient revenue. A higher figure means more of each revenue dollar goes to staff pay. Rank #123 / 403Payroll % — State benchmarkedThis home is ranked 123rd out of 403 homes in New York. Shows payroll as a percentage of revenue versus the New York average. Well-run New York facilities typically land around 53–65% — the top third Statewide. Below 25% may signal understaffing or heavy agency use — read with Staffing ratings.Ranking totals vary by category as each rank only includes facilities that report data for that metric. Homes missing that data point aren't included in the ranking.Click the rank badge to see the full State ranking.Click here to see the full State ranking.
Other operating costs Info Everything it costs to run the home apart from payroll — food, utilities, supplies, maintenance, contract labor and administration. Calculated as total operating expense minus payroll (staff salaries and wage-related benefits).
$6.6M
Total costs Info The home's total operating expense for the year — all the costs of running it, salaries included (CMS cost report, Worksheet G-3).
$14.6M

Who this home usually serves

TYPE OF STAY

Mostly long-term care residents

Most residents stay for extended periods and receive ongoing daily care.

Most new residents arrive under private pay (51% of admissions), and a typical private pay stay runs around 8 months.

Admissions
69 total

Coverage residents most often arrive under.

Medicare 23%
Private pay 51%
Medicaid 26%
Discharges
61 total

Coverage residents most often leave under.

Medicare 13%
Private pay 48%
Medicaid 39%

Places of interest near The Terrace at The Eddy Memorial

Address 0.0 miles from city center Info Estimated distance in miles from Troy's city center to The Terrace at The Eddy Memorial's address, calculated via Google Maps.

Calculate Travel Distance to The Terrace at The Eddy Memorial

Add your location

Address

Compare Nursing Home around New York State

The information below is reported by the New York State Department of Health.

5 facilities compared · CMS & NY Dept. of Health data

The Nottingham
NH
AL
IL
MC
Jamesville (Nottingham Road)
64
Facility 64
NY AVG 160
Rank #640 / 748
88.7%
Facility 88.7%
NY AVG 88.3%
Rank #275 / 436
0%
3.50
Facility 3.50
NY AVG 3.58
Rank #158 / 407
-26%-2%
$0
Facility $0
NY AVG $67.6k
Rank #1 / 415
84
Facility 84
NY AVG 83
Rank #278 / 593
8
Facility 8
NY AVG 18.5
Rank #42 / 414
2.7
Facility 2.7
NY AVG 5.1
Rank #44 / 414
-38-
0
Facility 0
NY AVG 63
Rank #1158 / 1173
Kevin Bryans
$7.1M
Facility $7.1M
NY AVG $32.0M
Rank #393 / 403
$3.7M
Facility $3.7M
NY AVG $10.7M
Rank #396 / 403
52.6%
Facility 52.6%
NY AVG 37%
Rank #226 / 403
335800
Kingsway Arms Nursing Center Inc
NH
AL
HC
IL
MC
RC
Schenectady
160
Facility 160
NY AVG 160
Rank #298 / 748
98.8%
Facility 98.8%
NY AVG 88.3%
Rank #131 / 436
+12%
4.45
Facility 4.45
NY AVG 3.58
Rank #39 / 407
-37%+24%
$0
Facility $0
NY AVG $67.6k
Rank #1 / 415
83
Facility 83
NY AVG 83
Rank #303 / 593
7
Facility 7
NY AVG 18.5
Rank #31 / 414
2.3
Facility 2.3
NY AVG 5.1
Rank #31 / 414
-154A+
35
Facility 35
NY AVG 63
Rank #910 / 1173
Annemarie Gleason
$25.3M
Facility $25.3M
NY AVG $32.0M
Rank #211 / 403
$15.6M
Facility $15.6M
NY AVG $10.7M
Rank #180 / 403
61.6%
Facility 61.6%
NY AVG 37%
Rank #145 / 403
335466
Daughters of Sarah Nursing & Rehabilitation Center
NH
AL
MC
NC
RC
Albany
210
Facility 210
NY AVG 160
Rank #155 / 748
100.0%
Facility 100.0%
NY AVG 88.3%
Rank #177 / 436
+13%
4.04
Facility 4.04
NY AVG 3.58
Rank #83 / 407
-33%+13%
$0
Facility $0
NY AVG $67.6k
Rank #1 / 415
85
Facility 85
NY AVG 83
Rank #254 / 593
12
Facility 12
NY AVG 18.5
Rank #111 / 414
3.0
Facility 3.0
NY AVG 5.1
Rank #61 / 414
-201-
9
Facility 9
NY AVG 63
Rank #1090 / 1173
Lisa Marrello
$25.2M
Facility $25.2M
NY AVG $32.0M
Rank #132 / 403
$16.5M
Facility $16.5M
NY AVG $10.7M
Rank #143 / 403
65.6%
Facility 65.6%
NY AVG 37%
Rank #223 / 403
335465
The Terrace at The Eddy Memorial
NH
AL
Troy
69
Facility 69
NY AVG 160
Rank #621 / 748
95.6%
Facility 95.6%
NY AVG 88.3%
Rank #112 / 436
+8%
4.55
Facility 4.55
NY AVG 3.58
Rank #30 / 407
-87%+27%
$0
Facility $0
NY AVG $67.6k
Rank #1 / 415
93
Facility 93
NY AVG 83
Rank #97 / 593
17
Facility 17
NY AVG 18.5
Rank #207 / 414
5.7
Facility 5.7
NY AVG 5.1
Rank #272 / 414
-76-
91
Facility 91
NY AVG 63
Rank #237 / 1173
-
$9.2M
Facility $9.2M
NY AVG $32.0M
Rank #311 / 403
$8.0M
Facility $8.0M
NY AVG $10.7M
Rank #295 / 403
86.4%
Facility 86.4%
NY AVG 37%
Rank #123 / 403
335680
Fairport Rehab & Nursing Center
NH
AL
PC
Fairport (Fairport-Nine Mile Point Road)
142
Facility 142
NY AVG 160
Rank #361 / 748
95.8%
Facility 95.8%
NY AVG 88.3%
Rank #402 / 436
+9%
4.54
Facility 4.54
NY AVG 3.58
Rank #39 / 407
-86%+27%
$0
Facility $0
NY AVG $67.6k
Rank #1 / 415
66
Facility 66
NY AVG 83
Rank #541 / 593
25
Facility 25
NY AVG 18.5
Rank #329 / 414
8.3
Facility 8.3
NY AVG 5.1
Rank #381 / 414
-136-
35
Facility 35
NY AVG 63
Rank #910 / 1173
Fairport Baptist Homes Adult Care Facility, Inc.
$11.2M
Facility $11.2M
NY AVG $32.0M
Rank #314 / 403
$7.6M
Facility $7.6M
NY AVG $10.7M
Rank #316 / 403
68.4%
Facility 68.4%
NY AVG 37%
Rank #194 / 403
335576

Financial Assistance for
Nursing Home in New York

The Terrace at The Eddy Memorial is located in Troy, New York.
Here are the financial assistance programs available to residents in New York.

Get Financial aid guidance

Community First Choice Option

NY Medicaid CFCO

Age 65+ or disabled
General New York resident, Medicaid- eligible, care need (not necessarily nursing home level).
Income Limits (2025) ~$2,829/month 300% FBR, individual
Asset Limits $30,182 individual, higher due to NY Medicaid expansion
NY

Higher asset limit; urban density increases demand.

Benefits
Personal care (5-7 hours/day) Respite care (240 hours/year) Home modifications ($1,500 avg.) Assistive technology ($500 avg.)

Expanded In-Home Services for the Elderly Program (EISEP)

NY EISEP

Age 60+
General New York resident, at risk of decline but not nursing home level.
Income Limits ~$2,500/month individual, varies
Asset Limits $15,000 individual
NY

Cost-sharing required above certain income; urban/rural balance.

Benefits
In-home care (3-5 hours/week) Respite (up to 10 days/year) Case management Transportation (~5 trips/month)

Senior Citizen Rent Increase Exemption (SCRIE)

NY SCRIE

Age 62+
General NYC resident, live in rent-controlled/stabilized apartment, spend >1/3 of income on rent.
Income Limits (2025) $50,000/year household
Asset Limits No strict asset cap, but income-focused eligibility.
NY

Limited to NYC’s rent-regulated units; high demand in urban areas.

Benefits
Rent freeze (e.g., covers increases of $50-$200+/month); tax credit for landlord

Senior Citizen Homeowners’ Exemption (SCHE)

NY SCHE

Age 65+
General NYC resident, own and live in a 1-3 family home, co-op, or condo.
Income Limits (2025) $58,399/year household
Asset Limits No strict asset cap, income-driven eligibility.
NY

Applies only in NYC; excludes large apartment buildings.

Benefits
Property tax reduction (5-50%, e.g., $500-$5,000/year based on income and property value)

New York Foundation for Senior Citizens (NYFSC) Home Sharing Program

NYFSC Home Sharing

Age One participant must be 60+ (host or guest)
General NYC resident, able to share living space.
Income Limits No strict limit, but targets those needing cost relief.
Asset Limits Not applicable; focus on housing need.
NY

Primarily NYC-focused; limited slots due to demand.

Benefits
Shared housing (reduces rent/living costs by 30-50%, e.g., $500-$1,000/month savings); optional light assistance between housemates

Frequently Asked Questions about The Terrace at The Eddy Memorial

Who is the owner of The Terrace at The Eddy Memorial?

The legal owner and operator of The Terrace at The Eddy Memorial is The James A. Eddy Memorial Geriatric Center, Inc..

Is The Terrace at The Eddy Memorial in a walkable area?

The Terrace at The Eddy Memorial has a walk score of 91. Walker's paradise. Daily errands do not require a car, with many shops and services nearby.

What is the license number of The Terrace at The Eddy Memorial?

According to NY state health department records, The Terrace at The Eddy Memorial's license number is 600-S-001.

What is the occupancy rate at The Terrace at The Eddy Memorial?

The Terrace at The Eddy Memorial's occupancy is 96%.

How many beds does The Terrace at The Eddy Memorial have?

The Terrace at The Eddy Memorial has 69 beds.

Are there photos of The Terrace at The Eddy Memorial?

Yes — there are 6 photos of The Terrace at The Eddy Memorial in the photo gallery on this page.

What is the address of The Terrace at The Eddy Memorial?

The Terrace at The Eddy Memorial is located at 2256 Burdett Avenue.

Guides for Better Senior Living

Care Cost Calculator: See Prices in Your Area

Nursing Home Data Explorer

Don’t Wait Too Long: 7 Red Flag Signs Your Parent Needs Assisted Living Now

The True Cost of Assisted Living in 2025 – And How Families Are Paying For It

Understanding Senior Living Costs: Pricing Models, Discounts & Financial Assistance