The Village
Nursing Home, Assisted Living, Independent Living & Memory Care · Hemet, CA
ALM Inspection Grade A- Info ALM's inspection grade is 91 / 100, an A- — 8 points above the California average for state-licensed facilities (83/100) · A proprietary Assisted Living Magazine grade.A 0–100 score of a facility's regulatory inspection record, shown as a letter and compared with other facilities of the same kind in the same state. It is not a government rating.
CMS overall rating Info CMS (the Centers for Medicare & Medicaid Services) is the federal agency that rates nursing home quality. Its Overall Rating runs from 1 to 5 stars, combining health inspections, staffing, and quality measures, with inspections weighted most heavily.

The Village

Nursing Home, Assisted Living, Independent Living & Memory Care · Hemet, CA
ALM Inspection Grade A- Info ALM's inspection grade is 91 / 100, an A- — 8 points above the California average for state-licensed facilities (83/100) · A proprietary Assisted Living Magazine grade.A 0–100 score of a facility's regulatory inspection record, shown as a letter and compared with other facilities of the same kind in the same state. It is not a government rating.
CMS overall rating Info CMS (the Centers for Medicare & Medicaid Services) is the federal agency that rates nursing home quality. Its Overall Rating runs from 1 to 5 stars, combining health inspections, staffing, and quality measures, with inspections weighted most heavily.
The Village accepts Medicare, Medicaid, and private pay.

Overview of The Village

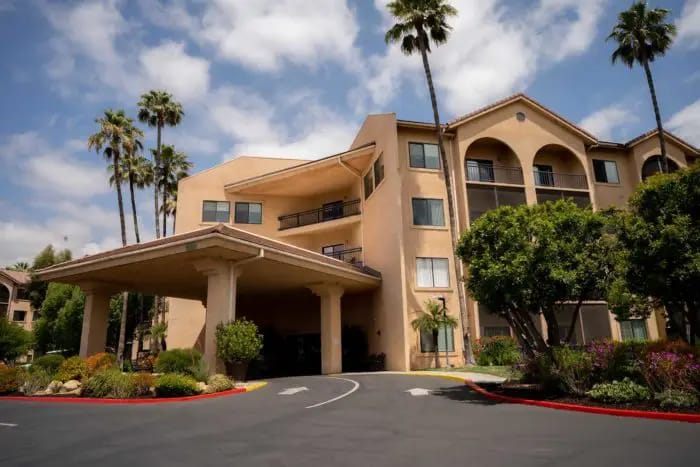
The Village provides nursing home, assisted living, independent living, and memory care in Hemet, CA. Nursing home care involves continuous nursing help, and assisted living offers support with personal care and keeping track of medication in apartment-style rooms. Independent living features private apartments and community amenities without daily help, whereas memory care includes a supervised and secure environment.

On-site care options allow a resident to remain within the same community even if their care requirements increase over time. The Village has 452 beds, placing it among larger communities with more residents, staff, and programming.

Rates start at $2,125 per month, giving families an initial figure for estimating monthly costs before care needs are assigned. Payment options include Medicare, Medicaid, and private pay. Medicare covers brief skilled care following a hospital visit but not long-term stays, and Medicaid might assist with extended stays when funds are limited.

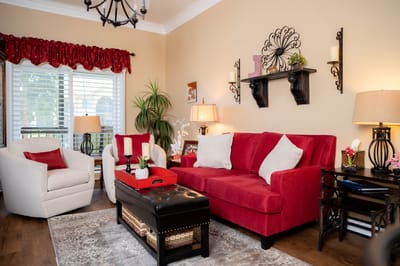
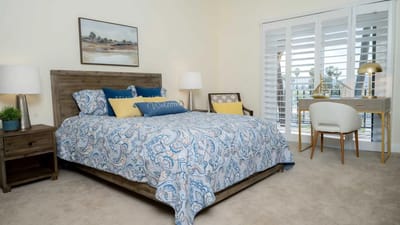
Housing includes studios and one bedroom apartments. A studio offers a single private space, while a one bedroom apartment provides a separate bedroom and living area. Pets are allowed, so a resident can live with a pet at the community.

Freedom Properties Hemet operates The Village. Residents can use a putting green, wood shop, billiards lounge, movie lounge, and library, giving them several distinct places for hobbies and quiet leisure.

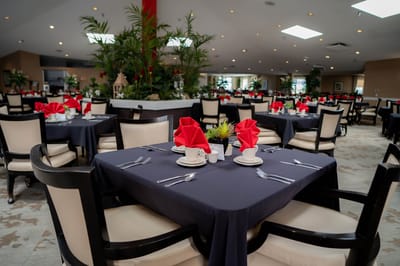
Scheduled activities include live entertainment, social and cultural outings, art and creative classes, chair yoga, aqua aerobics, and educational seminars. Dining includes brunch service and menu choices at each meal, along with a private dining room for family events and an onsite bistro or café.

Quality ratings

Measured by Centers for Medicare & Medicaid Services (CMS)

Overall rating Info The Overall CMS Rating combines results from health inspections, staffing levels and quality measures. Health inspections carry the most weight. Staffing and quality scores can increase or decrease the final rating based on performance compared to state and national standards.
▲ 23.9% Above CA avg. ▲ 23.9% Above CA avg.CA average: 3.2Click the badge to see the full State ranking.Click here to see the full State ranking.
Health Inspection Info Based on the results of the facility's three most recent standard inspections and any complaint investigations. CMS reviews the number, scope, and severity of deficiencies, with more recent findings weighted more heavily.
▲ 6.7% Above CA avg. ▲ 6.7% Above CA avg.CA average: 2.8Click the badge to see the full State ranking.Click here to see the full State ranking.
Staffing Info Measures average nursing staff hours per resident per day, including Registered Nurses (RNs) and total nursing staff. Ratings are adjusted based on the level of care residents require and are compared to state and national benchmarks.
▲ 48.7% Above CA avg. ▲ 48.7% Above CA avg.CA average: 3.4Click the badge to see the full State ranking.Click here to see the full State ranking.
Quality Measures Info Based on clinical and physical health indicators reported to CMS, such as hospital readmissions, falls, pressure ulcers, and improvements in mobility. These measures reflect how well residents' health needs are being managed.
▼ 27.9% Below CA avg. ▼ 27.9% Below CA avg.CA average: 4.2Click the badge to see the full State ranking.Click here to see the full State ranking.

Staffing Info Nursing care per resident per day and state rankings: CMS Provider Information.

Total nursing care per resident / day Info This nursing home is ranked 50th out of 291 nursing homes we track in California for nurse hours. Total adjusted nursing hours per resident per day, combining RN, LPN, and aide time. CMS adjusts this for case-mix so facilities can be fairly compared.
↑ 13% · CA 4h 21mThis facility: 4h 55m per resident per day, 13% above the California average of 4h 21m (among California facilities reporting a recent figure).Green: 5% or more better than the state average. Yellow: within 5%. Red: 5% or more worse. Rank #50 / 291Nurse hours — State benchmarked This nursing home is ranked 50th out of 291 nursing homes we track in California for nurse hours. Shows adjusted nurse hours per resident per day benchmarked to the California average, with a ranking across 291 California facilities. More hours mean more direct care. The national average is about 3.5 hrs; below 3.0 is a red flag. Communities with the same value for a metric share the same rank. Rankings compare like with like: every nursing home we track in California that reports data for that category. Nursing homes without available data are excluded, so the pool size varies from metric to metric.
4h 55m

Standout metric: RN, weekends is +43% above California average

0 of 6 metrics below California average

By The Numbers

Community insights.

Bed count Info A large-scale community that may provide a wide range of amenities, services, and structured programs. 452 Rank #28 / 345Bed count — State benchmarked This nursing home is ranked 28th out of 345 nursing homes we track in California for bed count. Shows this facility's certified or reported bed count compared to other California facilities. Larger communities may offer more amenities, programs, and on-site services for residents and families. Communities with the same value for a metric share the same rank. Rankings compare like with like: every nursing home we track in California that reports data for that category. Nursing homes without available data are excluded, so the pool size varies from metric to metric.

High-capacity home · May provide extensive amenities, services and programs.

Years of operating Info A longer operating history, which may indicate experience navigating regulations and delivering ongoing care. This is the number of years in operation under current management. Rank #100 / 198Years in operation — State benchmarked This nursing home is ranked 100th out of 198 nursing homes we track in California for years in operation. Shows how long this facility has been in operation compared to other California facilities. Longer operating histories may benefit residents, families, and staff. Communities with the same value for a metric share the same rank. Rankings compare like with like: every nursing home we track in California that reports data for that category. Nursing homes without available data are excluded, so the pool size varies from metric to metric.
26 years
Occupancy rate Info Occupancy lower than 85% suggests more openings may be available. Rank #287 / 303Occupancy rate — State benchmarked This nursing home is ranked 287th out of 303 nursing homes we track in California for occupancy. Shows this facility's occupancy rate versus the California average, with its Statewide rank out of 303. Higher occupancy signals strong local demand and financial stability. Communities with the same value for a metric share the same rank. Rankings compare like with like: every nursing home we track in California that reports data for that category. Nursing homes without available data are excluded, so the pool size varies from metric to metric.
50.9% This home usually has availability

Based on 230 residents and 452 beds. Source: state licensing agency resident count

Lower than the California average: 82.3%
Avg. Length of Stay Info Average number of days residents stay at this facility, based on CMS cost report data. Shorter stays often reflect post-acute or rehab care; longer stays reflect long-term care.
37 days

About This Community

Pricing & Financial Information

The below pricing was updated on

Starting Price
$2,125/Month

License Details

IssuanceSeptember 18, 2000
CountyRiverside

Ownership & Operating Entity

The Village is legally operated by Freedom Properties Hemet, LLC.

Staffing & Medical

1 service
Wellness Clinic with Nurses Available Daily

Additional Services

11 services
24-Hour Front Desk Reception
Wellness Programs and Screenings
Complimentary Health and Fitness Trainer
Catering Service
In-Home Caregiving Program
Bridge To Home Transitional Care Program
Emergency Call SystemListed as: 24-hour emergency response
TransportationListed as: Transportation to medical appointments · Free scheduled transportation within ten-mile radius
Housekeeping
Laundry & LinenListed as: Weekly linen service
MaintenanceListed as: Campus maintenance

Additional Policies & Features

Pets AllowedDogs and cats allowed.

Amenities & Lifestyle

Putting Green
Library
Workshop
Game Room
Fitness Center
Parking
Wi-Fi
Café
Bistro
Movie Lounge
Private Dining Room
Activities
Live Entertainment
Social and Cultural Outings
Putting Tournaments
Art and Creative Classes
Arts & Crafts
Chair Yoga
Water Aerobics
Educational Seminars
Card Games
Swimming and Aqua Classes
Cultural Outings and Events

Dining & Nutrition

InfoSourced directly from the team at The Village.
  • Private dining room for family events.
  • Bistro / café on site.
  • Multiple dining venues.

Room Accommodations

Studio Floor plans: Retreat 420 sq ft
1 Bedroom Floor plans as listed by the community: Hideaway (610 sq ft) · Hampton/Homestead (720–750 sq ft) Floor plans: Hideaway 610–750 sq ft

Contact The Village

Inspection History

In California, the Department of Social Services (for assisted living facilities) and the Department of Public Health (for nursing homes) conduct inspections to ensure resident safety and regulatory compliance.

ALM Inspection Grade

91 / 100 Based on state-published inspection data
How it compares

8 points above the California average for state-licensed facilities (83/100)

Category breakdown

Serious citations Strong

No serious citations on record

Moderate citations Typical

0.1 moderate citations per inspection (1 in 10 inspections) · 35% fewer than the typical state-licensed CA facility (median: 0.15)

Complaint visits Strong

0.66 complaint visits per 100 resident beds (3 across 452 beds) · 92% fewer than the typical state-licensed CA facility (median: 7.9)

Inspection grade: 91 out of 100, letter grade A-.

Inspection Scorecard Info This scorecard compares key inspection, citation, and complaint metrics at this facility against the California state average. Metrics rated ≥15% worse than average are highlighted in red; those ≥15% better are highlighted in green.

Overall vs. CA average 0 Worse No metrics in this bucket. 4 Better Metrics better than California average:
• Total citations (82% below)
• Serious citations (Type A) (100% below)
• Moderate citations (Type B) (75% below)
• Citations per inspection (62% below)

Citations Info Citations are formal regulatory issues recorded during state inspections.

This FacilityCA Averagevs. CA Avg
Total citations Info Formal regulatory issues recorded by inspectors across all inspection types. 15.5 This facility has 82% fewer total citations than a typical California nursing home (1 vs. CA avg 5.49).↓ 82% better
Serious citations (Type A) Info Citations that pose an immediate risk to resident health or safety. Type A citations are the most serious and typically require prompt corrective action. 03.0 This facility has 100% fewer serious citations (type a) than a typical California nursing home (0 vs. CA avg 3).↓ 100% better Rank #237 / 294 Serious citations (Type A) — State benchmarked This nursing home is ranked 237th out of 294 nursing homes we track in California for # of serious citations. Shows this facility's # of serious citations compared to the California average among the 294 nursing homes in the ranking pool. Communities with the same value for a metric share the same rank. Rankings compare like with like: every nursing home we track in California that reports data for that category. Nursing homes without available data are excluded, so the pool size varies from metric to metric.
Moderate citations (Type B) Info Citations that do not pose an immediate risk but still represent a departure from required care or operational standards. 14.0 This facility has 75% fewer moderate citations (type b) than a typical California nursing home (1 vs. CA avg 4).↓ 75% better
Citations per inspection Info Average citations per inspection. 0.10.3 This facility has 62% fewer citations per inspection than a typical California nursing home (0.1 vs. CA avg 0.26).↓ 62% better

Inspections & Visits Info State inspections evaluate whether the facility meets health and safety standards.

This FacilityCA Averagevs. CA Avg
Total inspections Info Combined count of official scheduled inspections, complaint visits and other regulatory visits. California counts each evaluation report, so one trip can count twice when it serves two purposes. 1019.0 This facility has had 47% fewer total inspections than the California average (10 vs. CA avg 19). More inspections can mean more regulatory scrutiny rather than worse care.↓ 47% fewer
Complaint visits Info On-site visits triggered by formal complaints filed by residents, families, or staff. 36.0 This facility has had 50% fewer complaint visits than the California average (3 vs. CA avg 6). More inspections can mean more regulatory scrutiny rather than worse care.↓ 50% fewer
Other visits Info Regulatory visits that are neither routine inspections nor complaint investigations — administrative check-ins, follow-up reviews, licensing-related visits. 35.0 This facility has had 40% fewer other visits than the California average (3 vs. CA avg 5). More inspections can mean more regulatory scrutiny rather than worse care.↓ 40% fewer
Official inspections Info Routine, scheduled inspections conducted by state regulators to evaluate whether the facility meets federal and state standards. 44.0 This facility has official inspections in line with the California average (4 vs. CA avg 4).— At avg
Enforcement

Penalties and fines About penalties and fines Federal penalties imposed by CMS for regulatory violations, including civil money penalties (fines) and denials of payment for new Medicare/Medicaid admissions.

Source: CMS Penalties Database · Data as of Oct 2026

No penalties in the past 3 years

No civil money penalties or payment denials on record since Oct 2023.

Clean record
Total fines
$0 CA avg $57KCalifornia average: $56,949. Average among the 478 California facilities with a penalty on record.US avg $66KUS average: $66,281, among the 6,725 US facilities with a penalty on record.
Number of fines
0 CA avg 1.85California average: 1.85. Average among the 478 California facilities with a penalty on record.US avg 1.88US average: 1.88, among the 6,725 US facilities with a penalty on record.
Payment denials What is a payment denial? Serious action where Medicare and/or Medicaid temporarily stops payments for new residents until issues are fixed.
0 CA avg 0.59California average: 0.59. Average among the 478 California facilities with a penalty on record.US avg 0.35US average: 0.35, among the 6,725 US facilities with a penalty on record.

Finances and operations

Based on CMS SNF Cost Report for fiscal year ending in 12/2024.

For-profit
Operated by a limited liability company.
Net patient revenue Info Net patient revenue — what the home actually collects for resident care, after contractual allowances, bad debt and discounts are subtracted from its gross charges (CMS cost report, Worksheet G-3). It covers resident care only; money the home earns from other sources is shown separately as "Other income."
$7.7MFiscal year ending 12/2024
Net patient income Info Net patient income: net patient revenue minus the home's total operating expenses. A positive figure means it earns more from resident care than it spends to deliver it; a negative figure means the opposite. It excludes non-operating "other income."
-$11.5MFiscal year ending 12/2024
For-profit Operated by a limited liability company.
Net patient revenue Info Net patient revenue — what the home actually collects for resident care, after contractual allowances, bad debt and discounts are subtracted from its gross charges (CMS cost report, Worksheet G-3). It covers resident care only; money the home earns from other sources is shown separately as "Other income."
$7.7MFiscal year ending 12/2024 Rank #267 / 289Net patient revenue — State benchmarked This nursing home is ranked 267th out of 289 nursing homes we track in California for net patient revenue. Shows this facility's net patient revenue compared to the California average, among facilities reporting a recent fiscal year. Higher revenue generally means more resources for staffing and capital — read alongside Payroll %. Communities with the same value for a metric share the same rank. Rankings compare like with like: every nursing home we track in California that reports data for that category. Nursing homes without available data are excluded, so the pool size varies from metric to metric.
Net patient income Info Net patient income: net patient revenue minus the home's total operating expenses. A positive figure means it earns more from resident care than it spends to deliver it; a negative figure means the opposite. It excludes non-operating "other income."
-$11.5MFiscal year ending 12/2024
Other income Info Money the home earns outside of resident care — such as investments, grants, rentals and other non-operating sources (CMS cost report, Worksheet G-3). It is tracked separately from net patient revenue: it is not part of that figure, and it is not included in net patient income.
$10.6MFiscal year ending 12/2024
Payroll costs Info Staff salaries plus wage-related costs — benefits such as payroll taxes, health insurance and retirement — from the home's own accounting records (CMS cost report, Worksheet A). Contract or agency labor is counted separately, under other operating costs. Rank #125 / 289Payroll costs — State benchmarked This nursing home is ranked 125th out of 289 nursing homes we track in California for payroll costs. Shows total staff payroll — salaries plus wage-related benefits — benchmarked to the California average, among facilities reporting a recent fiscal year. Higher payroll relative to peers often signals better staffing and less reliance on contract labor. Communities with the same value for a metric share the same rank. Rankings compare like with like: every nursing home we track in California that reports data for that category. Nursing homes without available data are excluded, so the pool size varies from metric to metric.
$9.7MFiscal year ending 12/2024 125.1% of net patient revenue Info Payroll as a share of revenue: staff salaries and wage-related benefits divided by net patient revenue. A higher figure means more of each revenue dollar goes to staff pay. Rank #12 / 289Payroll % of net patient revenue — State benchmarked This nursing home is ranked 12th out of 289 nursing homes we track in California for payroll % of net patient revenue. Shows payroll as a percentage of net patient revenue versus the California average, among facilities reporting a recent fiscal year. Below 25% may signal understaffing or heavy agency use — read with Staffing ratings. Communities with the same value for a metric share the same rank. Rankings compare like with like: every nursing home we track in California that reports data for that category. Nursing homes without available data are excluded, so the pool size varies from metric to metric.
Other operating costs Info Everything it costs to run the home apart from payroll — food, utilities, supplies, maintenance, contract labor and administration. Calculated as total operating expense minus payroll (staff salaries and wage-related benefits).
$9.6MFiscal year ending 12/2024
Total costs Info The home's total operating expense for the year — all the costs of running it, salaries included (CMS cost report, Worksheet G-3).
$19.2MFiscal year ending 12/2024

Who this home usually serves

Residents split by who pays for their care: Medicare, Medicaid, or private pay and other sources.
Over a year: CMS SNF Cost Report, FY2024
Arriving
365 admissions · FY2024 Residents admitted during the year.
Medicare 52 · 14%
Medicaid 45 · 12%
Private pay & other 268 · 73%
Shows care patterns over time; not used to rate this facility.

Primarily short stays

Residents typically stay for brief periods, with frequent admissions and discharges throughout the year.

Typical stay

Medicare 27 days Medicaid 5 - 6 months Private pay & other 17 days

Places of interest near The Village

Address 1.3 miles from city center Info Estimated distance in miles from Hemet's city center to The Village's address, calculated via Google Maps.

Calculate Travel Distance to The Village

Add your location

Address

Compare Nursing Homes around the area

Info below is compiled from CMS reports & the CA Dept. of Social Services (CDSS), senior community websites & trusted data sources such as Walk Score & BBB.

Communities are listed from highest-ranked to lowest-ranked based on our methodology.

The facility name. Click to view the full profile page on Assisted Living Magazine, including photos, services, and contact info.
CMS (Centers for Medicare & Medicaid Services, the federal agency that regulates nursing homes) Overall 5-star rating — a composite of Health Inspection, Staffing, and Quality Measures scores. 5 stars = top 10% nationally. 1 star = bottom 10%. The single most important number to start with when comparing facilities.
Care Types in This Table NH (Nursing Home): 24/7 skilled nursing care for residents with complex, ongoing medical needs. SNF (Skilled Nursing Facility): Round-the-clock nursing care, often for recovery after surgery, injury, or illness. MC (Memory Care): Secured, specialized care for people living with Alzheimer's or dementia.
Neighborhood or city area where the facility is located. Proximity to family, hospitals, and green space matters for both quality of life and ease of visitation. Consider drive time and transit access when evaluating location.
Licensed bed capacity. Larger facilities (300+ beds) often have more specialized programs but can feel institutional. Smaller homes (under 150 beds) tend to deliver more personalized care. Compare with Avg Res/Day to understand how full the facility typically runs.
A 0–100 score of a facility's regulatory inspection record, shown as a letter and compared with other facilities of the same kind in the same state. This is a proprietary Assisted Living Magazine grade. It is not a government rating. A dash means we have no inspection data for that facility.
Percentage of licensed beds filled on an average day. Color indicates financial health: green (90%+) = operationally strong, typically profitable. Amber (80–89%) = stable but leaving revenue on the table. Orange (70–79%) = financial strain likely, may struggle with fixed costs. Red (
This facility's occupancy rate compared to the statewide average for similar facilities. A positive number means above-average demand. Facilities running 5%+ above the state average are typically the most sought-after in their market — a strong proxy for reputation.
CMS-adjusted total nurse hours per resident per day (RN + LPN + CNA combined). The national average is approximately 3.5 hrs. Higher is better — more direct care time per resident. Below 3.0 is a red flag. CMS weights RN hours more heavily because RNs handle complex clinical decisions that CNAs cannot.
CMS Health Inspection star rating (1–5 stars), based on the 3 most recent annual state surveys plus any complaint investigations. This is the hardest rating to manipulate — it reflects real surveyor findings on-site. 5 stars = fewest deficiencies found. 1 star = most. It carries the heaviest weight in the Overall CMS rating.
CMS Staffing star rating (1–5 stars), based on daily nurse staffing hours submitted to CMS via verified payroll data. Compares RN, LPN, and CNA coverage relative to resident acuity level. 5 stars = well above expected staffing. Weekend staffing is evaluated separately, as that's where many facilities quietly reduce coverage.
CMS Quality Measures star rating (1–5 stars), based on 15 clinical outcome metrics including fall rates, pressure ulcers, antipsychotic drug use, and hospital readmissions. Captures actual resident health outcomes, not just compliance. High QM combined with low Health Inspection scores can indicate a facility with strong care but weak documentation practices.
Registered Nurse hours per resident/day compared to the statewide average. RNs are the highest-skilled nursing staff — they assess residents, manage medications, and respond to emergencies. A value of +50% means RN coverage is 50% above the state norm. Negative values are a concern for residents with complex or acute medical needs.
Total nursing staff hours (RN + LPN + CNA combined) per resident/day vs. the statewide average. A broader measure than RN vs State — it captures the entire care team. A facility can have high total staffing but low RN hours, meaning more aides and fewer nurses. Read both columns together for the full picture.
Total dollar amount of federal monetary fines (civil money penalties) issued by CMS in the past 3 years. Fines are only levied for serious violations — typically actual harm to residents, repeated uncorrected deficiencies, or systemic non-compliance. Even a single fine is noteworthy. Multiple fines strongly suggest a pattern, not isolated incidents.
Total health deficiency citations from the most recent standard inspection cycle. Minor citations (scope A–C) are common and often administrative in nature. Higher counts aren't always disqualifying, but should be read alongside Severe Citations to understand actual harm levels. Under 10 is strong for a large facility; 30+ warrants a closer look.
Average deficiency citations per CMS inspection (survey) in the reporting window — total citations divided by the number of inspections. Lower is better; compare alongside total Citations and Severe Citations for context.
Citations at CMS scope/severity level G or higher — G–I means actual harm occurred; J–L means residents were placed in immediate jeopardy. (D–F is potential for harm only). Examples include unaddressed falls, medication errors causing injury, neglect, or abuse.
Average number of residents in the building on any given day, derived from annual census data. Reflects true operating scale — a 400-bed facility running 200 residents/day operates very differently from one at 390. Higher resident counts generally mean more funded staffing hours.
Better Business Bureau rating (A+ to F). Reflects complaint history, business transparency, and how family disputes were resolved. A+ means no significant unresolved complaints. A blank (—) means the facility isn't BBB-accredited, which is common for healthcare providers and not necessarily a negative signal.
Walk Score® (0–100). Measures walkability of the surrounding area. 90–100 = Walker's Paradise. 70–89 = Very Walkable. 50–69 = Somewhat Walkable. Below 50 = Car-Dependent. Higher scores benefit family visitors, resident outings, and staff commuting.
The licensed owner or operator of record filed with CMS — the individual or organization legally accountable for the facility. Searching the operator name across other facilities can reveal chain or multi-site ownership, which matters: chain-operated homes tend to have more variable quality outcomes than independently run facilities.
What the home actually collects for resident care, after contractual allowances, bad debt and discounts — not gross billings. Taken from the latest complete annual cost report, so it is comparable across homes reporting the same period. Revenue alone doesn't indicate care quality, but it funds staffing and capital reinvestment. Pair with Payroll %. Figures are from each facility's most recent complete fiscal year — hover a value for the exact year; a * marks homes that report an older period than most facilities.
Staff salaries plus wage-related benefits from the latest complete annual cost report. Contract and agency labour is counted separately, under other operating costs, so a home leaning on agency staff can show a low figure here. Payroll is the cost most directly tied to care quality — compare with Payroll % for full context. Figures are from each facility's most recent complete fiscal year — hover a value for the exact year; a * marks homes that report an older period than most facilities.
Payroll as a share of NET PATIENT REVENUE (not gross revenue). Both figures come from the same cost-report year. A higher figure means more of each revenue dollar goes to staff pay. Read with the Staffing star rating to judge whether spend translates into coverage — and note that homes whose patient revenue covers only part of their operation can read implausibly high. The California average is: 61.6% Figures are from each facility's most recent complete fiscal year — hover a value for the exact year; a * marks homes that report an older period than most facilities.
CMS Certification Number: the unique federal identifier for this skilled nursing provider.
Victoria Care Center ★ ★ ★ ★ ★
NH
MC
SNF
Ventura
188
Facility 188
CA AVG 179
Rank #95 / 345
A
93.9%
Facility 93.9%
CA AVG 82.3%
Rank #67 / 303
+14%
4.46
Facility 4.46
CA AVG 4.36
Rank #93 / 291
★ ★ ★ ★ ☆ ★ ★ ★ ★ ☆ ★ ★ ★ ★ ★ -10%+2%
$0
Facility $0
CA AVG $60.0k
Rank #1 / 296
29
Facility 29
CA AVG 49.7
Rank #93 / 294
2.2
Facility 2.2
CA AVG 4.8
Rank #9 / 294
-177-
65
Facility 65
CA AVG 60
Rank #160 / 343
Puente Partners LLC
$31.2MFiscal year ending 12/2024
Facility $31.2MFiscal year ending 12/2024
CA AVG $17.3M
Rank #21 / 289
$17.8MFiscal year ending 12/2024
Facility $17.8MFiscal year ending 12/2024
CA AVG $9.8M
Rank #16 / 289
57.2%Fiscal year ending 12/2024
Facility 57.2%Fiscal year ending 12/2024
CA AVG 61.6%
Rank #104 / 289
555478
Mission Terrace ★ ★ ★ ★ ★
NH
SNF
Santa Barbara (Samarkand)
138
Facility 138
CA AVG 179
Rank #153 / 345
A+
92.2%
Facility 92.2%
CA AVG 82.3%
Rank #96 / 303
+12%
4.82
Facility 4.82
CA AVG 4.36
Rank #59 / 291
★ ★ ★ ★ ★ ★ ★ ★ ★ ☆ ★ ★ ★ ★ ☆ -66%+11%
$0
Facility $0
CA AVG $60.0k
Rank #1 / 296
15
Facility 15
CA AVG 49.7
Rank #17 / 294
1.9
Facility 1.9
CA AVG 4.8
Rank #3 / 294
-127-
62
Facility 62
CA AVG 60
Rank #184 / 343
Evelina Murphy
$26.2MFiscal year ending 12/2024
Facility $26.2MFiscal year ending 12/2024
CA AVG $17.3M
Rank #43 / 289
$12.5MFiscal year ending 12/2024
Facility $12.5MFiscal year ending 12/2024
CA AVG $9.8M
Rank #66 / 289
47.5%Fiscal year ending 12/2024
Facility 47.5%Fiscal year ending 12/2024
CA AVG 61.6%
Rank #232 / 289
055991
Pine Creek Care Center ★ ★ ★ ★ ★
NH
MC
SNF
Roseville (Cirby Side)
99
Facility 99
CA AVG 179
Rank #197 / 345
A+
96.0%
Facility 96.0%
CA AVG 82.3%
Rank #26 / 303
+17%
3.60
Facility 3.60
CA AVG 4.36
Rank #241 / 291
★ ★ ★ ★ ☆ ★ ★ ☆ ☆ ☆ ★ ★ ★ ★ ★ -13%-17%
$0
Facility $0
CA AVG $60.0k
Rank #1 / 296
24
Facility 24
CA AVG 49.7
Rank #65 / 294
4.0
Facility 4.0
CA AVG 4.8
Rank #131 / 294
-95B-
48
Facility 48
CA AVG 60
Rank #244 / 343
Bradley Truhar
$23.5MFiscal year ending 12/2024
Facility $23.5MFiscal year ending 12/2024
CA AVG $17.3M
Rank #64 / 289
$11.7MFiscal year ending 12/2024
Facility $11.7MFiscal year ending 12/2024
CA AVG $9.8M
Rank #84 / 289
49.7%Fiscal year ending 12/2024
Facility 49.7%Fiscal year ending 12/2024
CA AVG 61.6%
Rank #202 / 289
555801
Escondido Post Acute Rehab ★ ★ ★ ★ ★
NH
SNF
Escondido
180
Facility 180
CA AVG 179
Rank #104 / 345
B+
96.3%
Facility 96.3%
CA AVG 82.3%
Rank #22 / 303
+17%
3.68
Facility 3.68
CA AVG 4.36
Rank #220 / 291
★ ★ ★ ★ ☆ ★ ★ ★ ☆ ☆ ★ ★ ★ ★ ★ -29%-15%
$0
Facility $0
CA AVG $60.0k
Rank #1 / 296
40
Facility 40
CA AVG 49.7
Rank #149 / 294
3.6
Facility 3.6
CA AVG 4.8
Rank #88 / 294
-173-
71
Facility 71
CA AVG 60
Rank #120 / 343
1999 B Under The Keh 1999 Family Trust Dated December 8
$25.8MFiscal year ending 12/2024
Facility $25.8MFiscal year ending 12/2024
CA AVG $17.3M
Rank #49 / 289
$14.3MFiscal year ending 12/2024
Facility $14.3MFiscal year ending 12/2024
CA AVG $9.8M
Rank #44 / 289
55.5%Fiscal year ending 12/2024
Facility 55.5%Fiscal year ending 12/2024
CA AVG 61.6%
Rank #123 / 289
056040

Rank badges are statewide and care-type specific: each nursing home is ranked against every other CA nursing home we track that reports that metric, not just the 4 on this page. See how we rank facilities

Financial assistance

Programs that may help with care and living costs in California

The Village is in Acacia Hemet, California. These programs may support different care settings or living expenses. A listing does not confirm this community participates; our concierge team can help confirm.

Get financial aid guidance
Cash support for qualifying nonmedical residential care

SSI/SSP Nonmedical Out-of-Home Care Support

California SSI/SSP — Nonmedical Out-of-Home Care (NMOHC)

Who it is for
SSI/SSP-eligible Californians 65+, or blind or disabled, living in licensed nonmedical residential care
Income limit
Countable income and living arrangement affect eligibility and payment; SSA makes the determination.
Asset limit
Countable-resource limits are $2,000 for an individual and $3,000 for a couple.

Eligibility

General
Cash support for California residents age 65+ or blind or disabled who meet SSA eligibility rules and have a qualifying nonmedical residential living arrangement.
CA specifics
The nonmedical out-of-home-care category must be verified.

What it provides

  • Combined federal SSI and California SSP cash support. From January 1; 2026; the individual licensed-facility NMOHC maximum payment standard is $1,626.07/month before countable-income reductions. This is not an extra payment on top of regular SSI/SSP or a guarantee of full facility fees.
Cash support for qualifying immigrants, including residential care

Cash Assistance Program for Immigrants

California Cash Assistance Program for Immigrants (CAPI)

Who it is for
Immigrants 65+, or blind or disabled, in California who cannot get SSI because of immigration status
Income limit
Income must meet the CAPI payment standard for the person’s living arrangement; the county determines the individual award.
Asset limit
Countable-resource limits are $2,000 for an individual and $3,000 for a couple.

Eligibility

General
Cash support for California residents age 65+ or blind or disabled who meet CAPI immigration rules and cannot receive SSI/SSP solely because of immigration status.
CA specifics
County staff review proof of SSI/SSP ineligibility. A residential payment category requires its own determination.

What it provides

  • State-funded monthly cash assistance with payment standards equivalent to SSI/SSP; including a qualifying nonmedical out-of-home-care category. Actual payments vary; Medi-Cal and IHSS require separate applications.
In-home & community support

Multipurpose Senior Services Program

MSSP (Medi-Cal Waiver)

Who it is for
Medi-Cal members 60+ who meet nursing-facility level of care and can be served at home
Asset limit
For affected non-MAGI Medi-Cal categories, the 2026 countable-asset limit is $130,000 for one person plus $65,000 for each additional eligible family member (up to ten people). Exclusions and spousal protections apply.

Eligibility

General
Adults age 60+ with a qualifying Medi-Cal aid code who meet nursing-facility level-of-care criteria and can be served in the community.
CA specifics
Enrollment and a team-developed plan are required. The current program age is 60, not 65.

What it provides

  • Care management and authorized support such as adult day care; respite; personal care; meals; transportation and minor home modifications.
In-home support

In-Home Supportive Services (IHSS)

California IHSS

Who it is for
Californians who are aged, blind or disabled and need help to stay safely at home
Asset limit
For affected non-MAGI Medi-Cal categories, the 2026 countable-asset limit is $130,000 for one person plus $65,000 for each additional eligible family member (up to ten people). Exclusions and spousal protections apply.

Eligibility

General
California residents who are aged, blind or disabled (including eligible children) and need assistance to remain safely in their own home; Medi-Cal eligibility and health certification are required.
CA specifics
A county social worker assesses tasks and authorized hours; the recipient generally hires and supervises a provider.

What it provides

  • Authorized in-home assistance with daily needs; the approved hours depend on the county assessment and applicable program limits.
Homeowner tax relief

Property Tax Postponement Program (PTP)

CA PTP

Who it is for
California homeowners 62+, or blind or disabled, with limited income who want to defer property taxes
Income limit
2026 · For the 2026–2027 application cycle, 2025 total household income must not exceed $57,002.
Asset limit
At least 40% equity in the home is required; a reverse mortgage disqualifies participation.

Eligibility

General
California homeowner age 62+ or blind or disabled who occupies the property as a principal residence and meets all program conditions.
CA specifics
Applications for the 2026–2027 cycle run October 1 2026 through February 10 2027; limited funding is first come, first served.

What it provides

  • Deferral of eligible property taxes secured by a lien; 5% simple annual interest accrues and repayment is triggered by specified events. This is a loan-like deferral; not a grant.
Energy assistance

Low-Income Home Energy Assistance Program (LIHEAP)

CA LIHEAP

Who it is for
Income-eligible California households responsible for home energy costs
Income limit
2026 · Published 2026 monthly limits: $3,331.66 for one person; $4,356.83 for two; $5,382 for three; larger households use the CSD table.

Eligibility

General
California households meeting local LIHEAP eligibility and prioritization rules; energy costs and household vulnerability are considered.
CA specifics
Apply through the local provider. Funds are limited and assistance is prioritized under program rules.

What it provides

  • One-time energy-bill help; eligible crisis assistance and weatherization; award amounts depend on program rules and available funds.
Know before you visit

Frequently Asked Questions about The Village

Quick answers from public records and the community's own listing.
01 Who is the owner of The Village?
The Village is legally operated by Freedom Properties Hemet, LLC.
02 What is the occupancy rate at The Village?
The Village's occupancy is 50.9%.
03 How long has The Village been in business?
The Village has been operating for approximately 26 years, based on available licensing and registration records.
04 Are pets allowed at The Village?
Yes, The Village allows residents to bring their pets.
05 Does The Village operate as a for-profit or non-profit?
The Village is registered as a for-profit in CA.
06 What is the overall rating for The Village?
The Village received a 4-star overall rating from the CMS (Centers for Medicare and Medicaid Services). This score combines results from staffing levels, quality measures, and health inspections.
07 How many beds does The Village have?
The Village has 452 beds.