Truman Manor
Nursing Home, Assisted Living, Memory Care & Skilled Nursing · Truman, MN
CMS overall rating Info CMS (the Centers for Medicare & Medicaid Services) is the federal agency that rates nursing home quality. Its Overall Rating runs from 1 to 5 stars, combining health inspections, staffing, and quality measures, with inspections weighted most heavily.

Truman Manor

Nursing Home, Assisted Living, Memory Care & Skilled Nursing · Truman, MN
CMS overall rating Info CMS (the Centers for Medicare & Medicaid Services) is the federal agency that rates nursing home quality. Its Overall Rating runs from 1 to 5 stars, combining health inspections, staffing, and quality measures, with inspections weighted most heavily.
Calculator: See prices in your area
Truman Manor accepts Medicare, Medicaid, and private pay.

Overview of Truman Manor

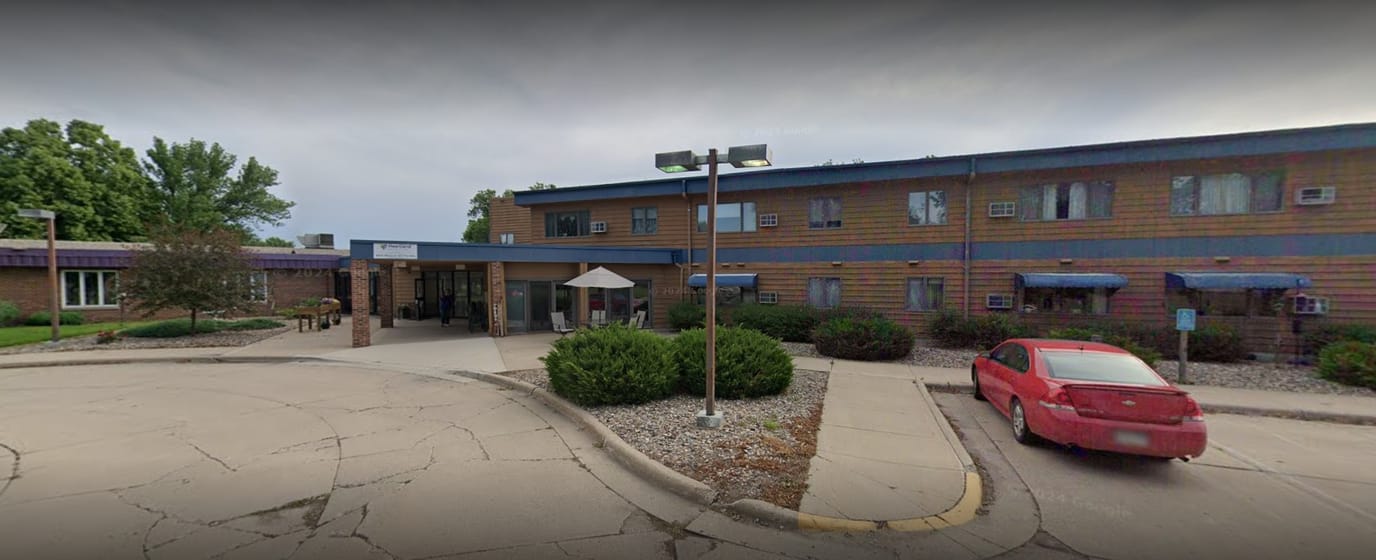
Enjoy your retirement life in peace and serenity at Truman Manor, a quiet and inviting senior living community set in Truman, Minnesota, offering assisted living services. The community features an array of 55+ apartments that give residents a snug and comfortable space for relaxing or spending time with friends and families. Here, residents receive compassionate support with their daily life routines, from grooming to medication management, and appointment setting for a comfortable living experience.

The community offers plenty of social activities to encourage interaction and the development of residents personal skills, elevating their sense of belonging within the community. Convenient services, such as laundry and housekeeping services are also offered to free residents from time-consuming and tiring chores. With delicious meals served three times a day, residents can say goodbye to cooking while ensuring they always have the energy to stay active throughout the day.

Quality ratings

Measured by Centers for Medicare & Medicaid Services (CMS)

Overall rating Info The Overall CMS Rating combines results from health inspections, staffing levels and quality measures. Health inspections carry the most weight. Staffing and quality scores can increase or decrease the final rating based on performance compared to state and national standards.
Health Inspection Info Based on the results of the facility's three most recent standard inspections and any complaint investigations. CMS reviews the number, scope, and severity of deficiencies, with more recent findings weighted more heavily.
Staffing Info Measures average nursing staff hours per resident per day, including Registered Nurses (RNs) and total nursing staff. Ratings are adjusted based on the level of care residents require and are compared to state and national benchmarks.
Quality Measures Info Based on clinical and physical health indicators reported to CMS, such as hospital readmissions, falls, pressure ulcers, and improvements in mobility. These measures reflect how well residents' health needs are being managed.

Staffing hours breakdown

Info Daily nursing hours per resident by staff type, reported to CMS. Higher is generally better — compare this facility to state and national averages to see where staffing stands.

Hours per resident per day — compared to state averages

Total nursing care / resident Info Total adjusted nursing hours per resident per day, combining RN, LPN, and aide time. CMS adjusts this for case-mix so facilities can be fairly compared.
4h 48m per day
Rank #36 / 89Nurse hours — State benchmarkedThis home is ranked 36th out of 89 homes in Minnesota. Shows adjusted nurse hours per resident per day benchmarked to the Minnesota average, with a ranking across 89 Minnesota facilities. More hours mean more direct care. The national average is about 3.5 hrs; below 3.0 is a red flag.Rankings are based only on facilities in Minnesota that report data for that category. Facilities without available data are excluded from the ranking.Click the rank badge to see the full State ranking.Click here to see the full State ranking.
vs avg
Staff type Hours / Day / Resident vs state avg
Registered Nurse (RN) Info RNs hold the highest nursing license and can assess residents, interpret test results, and direct care plans. More RN hours per day often signals stronger clinical oversight and faster response to health changes. 59m per day
LPN / LVN Info Licensed Practical Nurses (LPNs) or Licensed Vocational Nurses (LVNs) deliver routine hands-on care — medication administration, wound dressing, and monitoring vital signs. They work under RN supervision and make up a large share of daily bedside care. 50m per day
Nurse Aide Info Certified Nurse Aides (CNAs) provide the most direct day-to-day assistance: bathing, dressing, feeding, and mobility. Nurse aide hours are typically the largest staffing category and directly affect residents' quality of life. 2h 46m per day
Weekend Total Nursing Info Combined nursing hours (RN + LPN + Nurse Aide) per resident per day on weekends. Staffing often drops on weekends — this figure reveals whether the facility maintains adequate coverage outside of weekday hours. 4h 18m per day
Physical Therapist Info Hours per resident per day provided by licensed Physical Therapists (PTs) or PT Assistants. PT services help residents recover mobility after injury or illness and are especially important for post-acute (short-stay) rehabilitation. 2m per day
Weekend RN Info Registered nurse hours specifically on weekends. Facilities sometimes reduce RN presence on Saturdays and Sundays — a low weekend RN figure compared to weekday hours can indicate reduced clinical oversight when most administrative staff are absent. 55m per day

Capacity and availability

This home usually has availability

Lower occupancy than the state average
Occupancy rate
60.9% Rank #245 / 331Occupancy rate — State benchmarkedThis home is ranked 245th out of 331 homes in Minnesota. Shows this facility's occupancy rate versus the Minnesota average, with its Statewide rank out of 331. Higher occupancy signals strong local demand and financial stability.Rankings are based only on facilities in Minnesota that report data for that category. Facilities without available data are excluded from the ranking.Click the rank badge to see the full State ranking.Click here to see the full State ranking.
Avg. Length of Stay Info Average number of days residents stay at this facility, based on CMS cost report data. Shorter stays often reflect post-acute or rehab care; longer stays reflect long-term care.
370 days
Bed community size
30-bed community Rank #336 / 532Bed count — State benchmarkedThis home is ranked 336th out of 532 homes in Minnesota. Shows this facility's certified or reported bed count compared to other Minnesota facilities. Larger communities may offer more amenities, programs, and on-site services for residents and families.Rankings are based only on facilities in Minnesota that report data for that category. Facilities without available data are excluded from the ranking.Click the rank badge to see the full State ranking.Click here to see the full State ranking.
A moderately sized community that may balance personal attention with shared amenities and social activities.
Walk Score
Walk Score: 21 / 100 Rank #487 / 632Walk Score — State benchmarkedThis home is ranked 487th out of 632 homes in Minnesota. Shows how walkable this facility's neighborhood is compared to the average Walk Score across Minnesota facilities. Higher scores benefit residents, families, and staff.Rankings are based only on facilities in Minnesota that report data for that category. Facilities without available data are excluded from the ranking.Click the rank badge to see the full State ranking.Click here to see the full State ranking.
Car-dependent. Most errands require a car, with limited nearby walkable options.

Contact Truman Manor

Staffing Data

Reporting period: October 1 – December 31, 2025 (Q4 2025). Source: CMS Payroll-Based Journal report.

Total staff 76
Employees 40
Contractors 36
Staff to resident ratio 3.62 : 1
0% compared with State average

State average ratio: 0 : 0

Avg staff/day 16
Average shift 7.8 hours
0% compared with State average

State average: 0 hours

Total staff hours (quarter) 11,497

Nursing staff breakdown

Q4 2025 · Oct 1 – Dec 31 More info This data comes from the CMS Payroll-Based Journal report covering October 1 – December 31, 2025.
Registered Nurse

Manages medical care and health needs.

RN Staff Info 8 total: 6 full-time employees and 2 contractors. 8
Average shift length Info Average shift length. Calculated as total hours divided by days worked and average staff per day. 8.6 hours
Licensed Practical Nurse

Assists with medical care and medications.

LPN Staff Info 9 total: 6 full-time employees and 3 contractors. 9
Average shift length Info Average shift length. Calculated as total hours divided by days worked and average staff per day. 11.7 hours
Certified Nursing Assistant

Helps with daily care and mobility.

CNA Staff Info 32 total: 19 full-time employees and 13 contractors. 32
Average shift length Info Average shift length. Calculated as total hours divided by days worked and average staff per day. 8 hours

Contractor staffing

Q4 2025 · Oct 1 – Dec 31 More info This data comes from the CMS Payroll-Based Journal report covering October 1 – December 31, 2025.

Total hours from contractors

11%

1,266 contractor hours this quarter

Certified Nursing Assistant: 13 Licensed Practical Nurse: 3 Qualified Social Worker: 3 Physical Therapy Assistant: 3 Registered Nurse: 2 Physical Therapy Aide: 2 Speech Language Pathologist: 2 Feeding Assistant: 2 Occupational Therapy Aide: 2 Medical Director: 1 Respiratory Therapy Technician: 1 Occupational Therapy Assistant: 1 Other Physician: 1

Staff by category

Q4 2025 · Oct 1 – Dec 31 More info This data comes from the CMS Payroll-Based Journal report covering October 1 – December 31, 2025.
Certified Nursing Assistant 19 13 32 5,992 92 100% 8
Licensed Practical Nurse 6 3 9 1,799 89 97% 11.7
Registered Nurse 6 2 8 1,684 92 100% 8.6
Dietitian 1 0 1 457 57 62% 8
Nurse Practitioner 1 0 1 436 56 61% 7.8
Mental Health Service Worker 1 0 1 336 52 57% 6.5
Administrator 1 0 1 276 38 41% 7.3
Physical Therapy Aide 0 2 2 135 50 54% 2.7
Other Dietary Services Staff 3 0 3 110 33 36% 3.3
Physical Therapy Assistant 0 3 3 75 23 25% 3.3
Respiratory Therapy Technician 0 1 1 61 26 28% 2.3
Speech Language Pathologist 0 2 2 49 26 28% 1.9
Occupational Therapy Aide 0 2 2 29 9 10% 2.9
Qualified Social Worker 0 3 3 20 21 23% 0.9
Feeding Assistant 0 2 2 13 13 14% 1
Medication Aide/Technician 2 0 2 11 2 2% 5.7
Occupational Therapy Assistant 0 1 1 7 3 3% 2.5
Medical Director 0 1 1 5 5 5% 1
Other Physician 0 1 1 1 1 1% 1
32 Certified Nursing Assistant
% of Days 100%
9 Licensed Practical Nurse
% of Days 97%
8 Registered Nurse
% of Days 100%
1 Dietitian
% of Days 62%
1 Nurse Practitioner
% of Days 61%
1 Mental Health Service Worker
% of Days 57%
1 Administrator
% of Days 41%
2 Physical Therapy Aide
% of Days 54%
3 Other Dietary Services Staff
% of Days 36%
3 Physical Therapy Assistant
% of Days 25%
1 Respiratory Therapy Technician
% of Days 28%
2 Speech Language Pathologist
% of Days 28%
2 Occupational Therapy Aide
% of Days 10%
3 Qualified Social Worker
% of Days 23%
2 Feeding Assistant
% of Days 14%
2 Medication Aide/Technician
% of Days 2%
1 Occupational Therapy Assistant
% of Days 3%
1 Medical Director
% of Days 5%
1 Other Physician
% of Days 1%

Penalties and fines

Federal penalties imposed by CMS for regulatory violations, including civil money penalties (fines) and denials of payment for new Medicare/Medicaid admissions.

Source: CMS Penalties Database

No penalties in the past 3 years

No civil money penalties or payment denials were reported in the last 3 years.

Quality of care over time

These measures show how residents usually do over time at this home, based on health outcomes and preventive care.

High-risk clinical events score Info A composite score based on pressure ulcers, falls with injury, weight loss, walking ability decline, and activities of daily living decline. 10.4
7% better than State average

State average: 11.1

Functional decline score Info A composite score based on activities of daily living decline, walking ability decline, and incontinence. 21.5
5% better than State average

State average: 22.6

Long-stay resident measures
Need for Help with Daily Activities Increased Info Percent of long-stay residents whose need for help with daily activities has increased 26.8%
41% worse than State average

State average: 18.9%

Walking Ability Worsened Info Percent of long-stay residents whose ability to move independently worsened 16.6%
30% better than State average

State average: 23.8%

Low Risk Residents with Bowel/Bladder Incontinence Info Percent of low risk long-stay residents who lose control of their bowels or bladder 21.0%
16% better than State average

State average: 25.0%

Falls with Major Injury Info Percent of long-stay residents experiencing one or more falls with major injury 4.1%
8% worse than State average

State average: 3.7%

High Risk Residents with Pressure Ulcers Info Percent of long-stay high risk residents with pressure ulcers 1.2%
77% better than State average

State average: 5.4%

Urinary Tract Infection Info Percent of long-stay residents with a urinary tract infection 4.1%
49% worse than State average

State average: 2.7%

Lost Too Much Weight Info Percent of long-stay residents who lose too much weight 3.1%
24% better than State average

State average: 4.1%

Depressive Symptoms Info Percent of long-stay residents who have depressive symptoms 2.9%
33% better than State average

State average: 4.4%

Antipsychotic Use Info Percent of long-stay residents who received an antipsychotic medication 6.1%
65% better than State average

State average: 17.2%

Pneumococcal Vaccine Info Percent of long-stay residents assessed and appropriately given the pneumococcal vaccine 94.6%
In line with State average

State average: 97.3%

Short-stay resident measures
Pneumococcal Vaccine Info Percent of short-stay residents assessed and appropriately given the pneumococcal vaccine 89.0%
In line with State average

State average: 88.9%

Antipsychotic medication increase Info Percent of short-stay residents who newly received an antipsychotic medication 2.3%
19% worse than State average

State average: 1.9%

Influenza Vaccine Info Percent of short-stay residents assessed and appropriately given the seasonal influenza vaccine 86.4%
5% better than State average

State average: 82.6%

Breakdown by payment type

Medicare

44% of new residents, usually for short-term rehab.

Typical stay 1 - 2 months

Private pay

44% of new residents, often for short stays.

Typical stay 6 - 7 months

Medicaid

13% of new residents, often for long-term daily care.

Typical stay 2 - 3 years

Facility Characteristics

Source: CMS Long-Term Care Facility Characteristics (Data as of Jan 2026)

Total residents 21
Medicare
2
9.5% of residents
Medicaid
12
57.1% of residents
Private pay or other
7
33.3% of residents
Programs & Services
Residents Group

Residents meet regularly to discuss policies, care quality, and activities

Family Member Group

Family members meet regularly to discuss policies, care quality, and activities

Nurse Aide Training

State-approved Nurse Aide Training and Competency Evaluation Program on-site

Active Family Council

Organized group of family members that meets regularly to discuss facility policies, resident care, and activities.

Active Resident Council

Organized group of residents that meets regularly to discuss facility policies, quality of life, and activities.

Finances and operations

Based on CMS SNF Cost Report for fiscal year ending in 09/2023.

Nonprofit
Nonprofit Corporation
Net patient revenue Info Net patient revenue — what the home actually collects for resident care, after contractual allowances, bad debt and discounts are subtracted from its gross charges (CMS cost report, Worksheet G-3). It covers resident care only; money the home earns from other sources is shown separately as "Other income."
$3.3M
Net patient income Info Net patient income: net patient revenue minus the home's total operating expenses. A positive figure means it earns more from resident care than it spends to deliver it; a negative figure means the opposite. It excludes non-operating "other income."
-$675.0K
Nonprofit Nonprofit Corporation
Net patient revenue Info Net patient revenue — what the home actually collects for resident care, after contractual allowances, bad debt and discounts are subtracted from its gross charges (CMS cost report, Worksheet G-3). It covers resident care only; money the home earns from other sources is shown separately as "Other income."
$3.3M Rank #88 / 89Revenue — State benchmarkedThis home is ranked 88th out of 89 homes in Minnesota. Shows this facility's annual revenue compared to the Minnesota average. Higher revenue generally means more resources for staffing and capital — read alongside Payroll %.Rankings are based only on facilities in Minnesota that report data for that category. Facilities without available data are excluded from the ranking.Click the rank badge to see the full State ranking.Click here to see the full State ranking.
Net patient income Info Net patient income: net patient revenue minus the home's total operating expenses. A positive figure means it earns more from resident care than it spends to deliver it; a negative figure means the opposite. It excludes non-operating "other income."
-$675.0K
Other income Info Money the home earns outside of resident care — such as investments, grants, rentals and other non-operating sources (CMS cost report, Worksheet G-3). It is tracked separately from net patient revenue: it is not part of that figure, and it is not included in net patient income.
$55.8K
Payroll costs Info Staff salaries plus wage-related costs — benefits such as payroll taxes, health insurance and retirement — from the home's own accounting records (CMS cost report, Worksheet A). Contract or agency labor is counted separately, under other operating costs. Rank #87 / 89Payroll — State benchmarkedThis home is ranked 87th out of 89 homes in Minnesota. Shows total annual staff payroll benchmarked to the Minnesota average. Higher payroll investment relative to peers often signals better staffing and less reliance on cheaper contract labor.Rankings are based only on facilities in Minnesota that report data for that category. Facilities without available data are excluded from the ranking.Click the rank badge to see the full State ranking.Click here to see the full State ranking.
$2.3M 69.8% of net patient revenue Info Payroll as a share of revenue: staff salaries and wage-related benefits divided by net patient revenue. A higher figure means more of each revenue dollar goes to staff pay. Rank #4 / 89Payroll % — State benchmarkedThis home is ranked 4th out of 89 homes in Minnesota. Shows payroll as a percentage of revenue versus the Minnesota average. Well-run Minnesota facilities typically land around 61–68% — the top third Statewide. Below 25% may signal understaffing or heavy agency use — read with Staffing ratings.Rankings are based only on facilities in Minnesota that report data for that category. Facilities without available data are excluded from the ranking.Click the rank badge to see the full State ranking.Click here to see the full State ranking.
Other operating costs Info Everything it costs to run the home apart from payroll — food, utilities, supplies, maintenance, contract labor and administration. Calculated as total operating expense minus payroll (staff salaries and wage-related benefits).
$1.7M
Total costs Info The home's total operating expense for the year — all the costs of running it, salaries included (CMS cost report, Worksheet G-3).
$4.0M

What does this home offer?

Minimum age icon
Minimum age icon

Minimum Age: 55 Years Old

Building type icon
Building type icon

Building Type: Two-story

Who this home usually serves

TYPE OF STAY

Mix of rehab and long-term care

This home supports both short-term rehab and long-term care, with residents staying for a wide range of durations.

New residents most often arrive under Medicare (44% of admissions), and a typical Medicare stay runs around 1 - 2 months.

Admissions
39 total

Coverage residents most often arrive under.

Medicare 44%
Private pay 44%
Medicaid 13%
Discharges
24 total

Coverage residents most often leave under.

Medicare 42%
Private pay 21%
Medicaid 38%

Places of interest near Truman Manor

Address 0.8 miles from city center Info Estimated distance in miles from Truman's city center to Truman Manor's address, calculated via Google Maps.

Calculate Travel Distance to Truman Manor

Add your location

Address

Compare Nursing Homes around the area

The information below is reported by the Minnesota Department of Health, Health Regulation Division.

Pelican Valley Senior Living
NH
AL
HOS
MC
RC
SNF
Pelican Rapids (East Mill Avenue) - 28 - 58 Private Rooms
Mankato Lodge Senior Living
NH
AL
IL
RC
Mankato - 70 - 56 Studio / 1 Bed / 2 Bed
Truman Manor
NH
AL
MC
SNF
Truman - 30 - 21 -
Osseo Gardens Assisted Living
NH
AL
Osseo - 42 A+ 72 -
Sugar Loaf Senior Living
NH
AL
HOS
MC
Winona - 92 A+ 51 -

Frequently Asked Questions about Truman Manor

What neighborhood is Truman Manor in?

Truman Manor is in the Truman neighborhood.

Is Truman Manor in a walkable area?

Truman Manor has a walk score of 21. Car-dependent. Most errands require a car, with limited nearby walkable options.

What is the occupancy rate at Truman Manor?

Truman Manor's occupancy is 60.9%.

Does Truman Manor operate as a for-profit or non-profit?

Truman Manor is registered as a non-profit.

Are there photos of Truman Manor?

Yes — there is 1 photo of Truman Manor in the photo gallery on this page.

What is the address of Truman Manor?

Truman Manor is located at 402 N 4Th Ave E, Truman, MN 56088.

What is the phone number of Truman Manor?

(888) 848-5200 will put you in contact with the team at Truman Manor.

Guides for Better Senior Living

Care Cost Calculator: See Prices in Your Area

Nursing Home Data Explorer

Don’t Wait Too Long: 7 Red Flag Signs Your Parent Needs Assisted Living Now

The True Cost of Assisted Living in 2025 – And How Families Are Paying For It

Understanding Senior Living Costs: Pricing Models, Discounts & Financial Assistance