


Total staff
119
Employees
69
Contractors
50
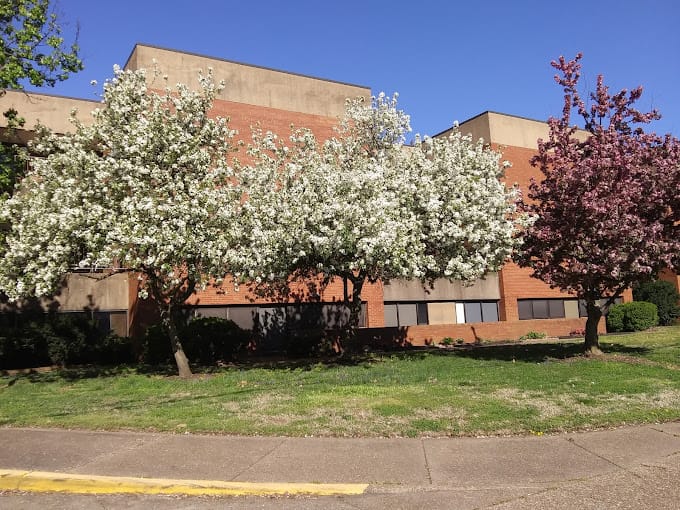
Under Aperion Care Lincoln’s ownership, University Nursing and Rehabilitation is a skilled nursing community on Lincoln Avenue in Evansville, Indiana. It operates with 47 beds and has a stable 80 percent occupancy rate, so availability with a consistent resident census is balanced. Medicare, Medicaid, and private pay are accepted to give families several routes to arrange short-term rehabilitation and longer-term skilled nursing care.
Daily nursing support forms the care foundation. Total nursing care averages 3 hours 40 minutes per resident day, divided among registered nurses, nurse aides, and licensed practical nurses working across shifts. This staffing level mirrors a diligent approach to resident support in the community’s daily activities and clinical needs. The location stands in an average walkable area with a Walk Score of 58. This means some errands and appointments can be done on foot, while most outings will involve brief drives. Nearby family members can anticipate a reasonable neighborhood setting that’s accessible but not highly urban.
| Staff type | Hours / Day / Resident | vs state avg |
|---|---|---|
|
Registered Nurse (RN)
| 35m per day | ▼ 13% State avg: 40m per day · National avg: 41m per day |
|
LPN / LVN
| 58m per day | ▲ 26% State avg: 46m per day · National avg: 52m per day |
|
Nurse Aide
| 2h 37m per day | ▲ 15% State avg: 2h 16m per day · National avg: 2h 21m per day |
|
Weekend Total Nursing
| 3h 31m per day | ▲ 9% State avg: 3h 14m per day · National avg: 3h 26m per day |
|
Physical Therapist
| 1m per day | ▼ 75% State avg: 4m per day · National avg: 4m per day |
|
Weekend RN
| 29m per day | ▲ 7% State avg: 27m per day · National avg: 29m per day |
Reporting period: October 1 – December 31, 2025 (Q4 2025). Source: CMS Payroll-Based Journal report.
Manages medical care and health needs.
Assists with medical care and medications.
Helps with daily care and mobility.
Total hours from contractors
1,850 contractor hours this quarter
| Certified Nursing Assistant | 36 | 3 | 39 | 8,356 | 92 | 100% | 7.2 |
| Licensed Practical Nurse | 11 | 3 | 14 | 3,730 | 92 | 100% | 7.5 |
| Medication Aide/Technician | 10 | 12 | 22 | 2,121 | 92 | 100% | 7.3 |
| Registered Nurse | 6 | 14 | 20 | 1,398 | 88 | 96% | 8.4 |
| Nurse Practitioner | 1 | 0 | 1 | 534 | 66 | 72% | 8.1 |
| Administrator | 1 | 0 | 1 | 512 | 64 | 70% | 8 |
| Dietitian | 1 | 1 | 2 | 495 | 61 | 66% | 8 |
| Mental Health Service Worker | 1 | 1 | 2 | 448 | 55 | 60% | 8 |
| Speech Language Pathologist | 0 | 2 | 2 | 416 | 63 | 68% | 6 |
| Qualified Social Worker | 0 | 1 | 1 | 392 | 50 | 54% | 7.8 |
| Clinical Nurse Specialist | 1 | 3 | 4 | 392 | 47 | 51% | 6.2 |
| RN Director of Nursing | 0 | 1 | 1 | 144 | 18 | 20% | 8 |
| Physical Therapy Assistant | 0 | 2 | 2 | 115 | 47 | 51% | 2.4 |
| Respiratory Therapy Technician | 0 | 2 | 2 | 68 | 33 | 36% | 2 |
| Physical Therapy Aide | 0 | 1 | 1 | 38 | 20 | 22% | 1.9 |
| Other Dietary Services Staff | 1 | 0 | 1 | 35 | 4 | 4% | 8.8 |
| Medical Director | 0 | 1 | 1 | 30 | 3 | 3% | 10 |
| Occupational Therapy Aide | 0 | 2 | 2 | 18 | 8 | 9% | 2.3 |
| Occupational Therapy Assistant | 0 | 1 | 1 | 15 | 3 | 3% | 5 |
Includes penalties issued in 2024
Federal penalties imposed by CMS for regulatory violations, including civil money penalties (fines) and denials of payment for new Medicare/Medicaid admissions.
Source: CMS Penalties Database (Data as of Jan 2026)
Indiana average: $27K
Indiana average: 1.4
Indiana average: 0.4
Penalties are imposed by CMS for violations of federal nursing home regulations.
1 penalty in the past 3 years
Mar 4, 2024 · $10K
Last updated: Jan 2026
These measures show how residents usually do over time at this home, based on health outcomes and preventive care.
Indiana average: 8.0
Indiana average: 17.1
Indiana average: 12.0%
Indiana average: 14.4%
Indiana average: 24.6%
Indiana average: 3.9%
Indiana average: 4.4%
Indiana average: 1.2%
Indiana average: 5.7%
Indiana average: 24.1%
Indiana average: 12.4%
Indiana average: 93.7%
Indiana average: 95.4%
Indiana average: 1.60
Indiana average: 1.48
Indiana average: 81.7%
Indiana average: 1.4%
Indiana average: 79.0%
Indiana average: 22.4%
Indiana average: 10.5%
Indiana average: 0.8%
Quality measures are calculated from Minimum Data Set (MDS) assessments. For most measures, lower percentages indicate better care quality.
21% of new residents, usually for short-term rehab.
21% of new residents, often for short stays.
58% of new residents, often for long-term daily care.
Source: CMS Long-Term Care Facility Characteristics (Data as of Jan 2026)
Data sourced from CMS Long-Term Care Facility Characteristics quarterly report. Payer mix reflects the current resident census by primary payment source.
Historical financial and operational data for University Nursing and Rehabilitation from 2015–2023, based on CMS SNF Cost Reports.
Key figures below are for fiscal year ending in 12/2023.
Based on CMS SNF Cost Report for fiscal year ending in 12/2023.
Most residents stay for extended periods and receive ongoing daily care.
Most new residents arrive under Medicaid (58% of admissions), and a typical Medicaid stay runs around 1 - 2 years.
Coverage residents most often arrive under.
Coverage residents most often leave under.
![]() 2.0 miles from city center
2.0 miles from city center
![]() Estimated distance in miles from Evansville's city center to University Nursing and Rehabilitation's address, calculated via Google Maps.
Estimated distance in miles from Evansville's city center to University Nursing and Rehabilitation's address, calculated via Google Maps.
Add your location
Info below is compiled from CMS reports & the IN Dept. of Health (IDOH), senior community websites & trusted data sources such as Walk Score & BBB.
Communities are listed from highest to lowest based on our ranking methodology.
| North River Health Campus | NH ADC AL IL MC SNF | Evansville (East Baseline Road) | 95
Facility
95
IN AVG
116
Rank
#267 / 433 |
50.5%
Facility
50.5%
IN AVG
65.4
Rank
#336 / 423 | -23% | 3.66
Facility
3.66
IN AVG
3.44
Rank
#72 / 280 | +63% | +7% | $0
Facility
$0
IN AVG
$31.4k
Rank
#1 / 282 | 91
Facility
91
IN AVG
83
Rank
#71 / 392 | 10
Facility
10
IN AVG
25.0
Rank
#41 / 282 | 3.3
Facility
3.3
IN AVG
4.1
Rank
#108 / 282 | - | 48 | A+ |
11
Facility
11
IN AVG
37
Rank
#456 / 587 | Thomas Cook | $10.8MFiscal year ending 12/2023
Facility
$10.8MFiscal year ending 12/2023
IN AVG
$10.7M
Rank
#128 / 282 | $5.8MFiscal year ending 12/2023
Facility
$5.8MFiscal year ending 12/2023
IN AVG
$4.2M
Rank
#97 / 282 | 53.6%Fiscal year ending 12/2023
Facility
53.6%Fiscal year ending 12/2023
IN AVG
42%
Rank
#101 / 282 | 155854 | ||||
| Cypress Grove Rehabilitation Center | NH HOS MC PC RC SNF | Newburgh | 90
Facility
90
IN AVG
116
Rank
#284 / 433 |
88.9%
Facility
88.9%
IN AVG
65.4
Rank
#37 / 423 | +36% | 3.02
Facility
3.02
IN AVG
3.44
Rank
#207 / 280 | +23% | -12% | $0
Facility
$0
IN AVG
$31.4k
Rank
#1 / 282 | 83
Facility
83
IN AVG
83
Rank
#154 / 392 | 15
Facility
15
IN AVG
25.0
Rank
#76 / 282 | 3.0
Facility
3.0
IN AVG
4.1
Rank
#82 / 282 | - | 80 | A+ |
56
Facility
56
IN AVG
37
Rank
#172 / 587 | Brandon Burns | $10.3MFiscal year ending 12/2023
Facility
$10.3MFiscal year ending 12/2023
IN AVG
$10.7M
Rank
#150 / 282 | $5.5MFiscal year ending 12/2023
Facility
$5.5MFiscal year ending 12/2023
IN AVG
$4.2M
Rank
#132 / 282 | 53.8%Fiscal year ending 12/2023
Facility
53.8%Fiscal year ending 12/2023
IN AVG
42%
Rank
#119 / 282 | 155273 | ||||
| River Pointe Health Campus | NH AL RC SNF | Evansville (Galaxy Drive) | 124
Facility
124
IN AVG
116
Rank
#157 / 433 |
46.8%
Facility
46.8%
IN AVG
65.4
Rank
#360 / 423 | -28% | 4.28
Facility
4.28
IN AVG
3.44
Rank
#33 / 280 | -8% | +24% | $0
Facility
$0
IN AVG
$31.4k
Rank
#1 / 282 | 75
Facility
75
IN AVG
83
Rank
#264 / 392 | 19
Facility
19
IN AVG
25.0
Rank
#116 / 282 | 3.8
Facility
3.8
IN AVG
4.1
Rank
#135 / 282 | 1 | 58 | A+ |
52
Facility
52
IN AVG
37
Rank
#199 / 587 | Randall Thompson | $11.6MFiscal year ending 12/2023
Facility
$11.6MFiscal year ending 12/2023
IN AVG
$10.7M
Rank
#103 / 282 | $6.1MFiscal year ending 12/2023
Facility
$6.1MFiscal year ending 12/2023
IN AVG
$4.2M
Rank
#87 / 282 | 52.6%Fiscal year ending 12/2023
Facility
52.6%Fiscal year ending 12/2023
IN AVG
42%
Rank
#125 / 282 | 155723 | ||||
| West River Health Campus | NH ADC AL MC RC SNF | Evansville (Westside) | 131
Facility
131
IN AVG
116
Rank
#138 / 433 |
74.0%
Facility
74.0%
IN AVG
65.4
Rank
#154 / 423 | +13% | 4.56
Facility
4.56
IN AVG
3.44
Rank
#27 / 280 | -1% | +33% | $18.7k
Facility
$18.7k
IN AVG
$31.4k
Rank
#256 / 282 | 73
Facility
73
IN AVG
83
Rank
#292 / 392 | 17
Facility
17
IN AVG
25.0
Rank
#104 / 282 | 2.1
Facility
2.1
IN AVG
4.1
Rank
#34 / 282 | 2 | 97 | A+ |
2
Facility
2
IN AVG
37
Rank
#546 / 587 | Carla Baker | $10.1MFiscal year ending 12/2023
Facility
$10.1MFiscal year ending 12/2023
IN AVG
$10.7M
Rank
#146 / 282 | $5.4MFiscal year ending 12/2023
Facility
$5.4MFiscal year ending 12/2023
IN AVG
$4.2M
Rank
#119 / 282 | 53.1%Fiscal year ending 12/2023
Facility
53.1%Fiscal year ending 12/2023
IN AVG
42%
Rank
#105 / 282 | 155785 | ||||
| University Nursing and Rehabilitation | NH AL SNF | Evansville (Rosedale South) | 47
Facility
47
IN AVG
116
Rank
#401 / 433 |
92.6%
Facility
92.6%
IN AVG
65.4
Rank
#18 / 423 | +42% | 3.67
Facility
3.67
IN AVG
3.44
Rank
#72 / 280 | +71% | +7% | $53.5k
Facility
$53.5k
IN AVG
$31.4k
Rank
#271 / 282 | - | 48
Facility
48
IN AVG
25.0
Rank
#253 / 282 | 6.9
Facility
6.9
IN AVG
4.1
Rank
#255 / 282 | 3 | 44 | - |
58
Facility
58
IN AVG
37
Rank
#163 / 587 | Aperion Care Lincoln, LLC | $5.1MFiscal year ending 12/2023
Facility
$5.1MFiscal year ending 12/2023
IN AVG
$10.7M
Rank
#248 / 282 | $3.0MFiscal year ending 12/2023
Facility
$3.0MFiscal year ending 12/2023
IN AVG
$4.2M
Rank
#222 / 282 | 58.3%Fiscal year ending 12/2023
Facility
58.3%Fiscal year ending 12/2023
IN AVG
42%
Rank
#29 / 282 | 155820 |
University Nursing and Rehabilitation is located in Evansville, Indiana.
Here are the financial assistance programs available to residents in Indiana.
University Nursing and Rehabilitation is in the Rosedale South neighborhood.
University Nursing and Rehabilitation has a walk score of 58. Moderately walkable. Some errands can be accomplished on foot, with a mix of nearby amenities.
University Nursing and Rehabilitation's occupancy is 80.0%.
No, University Nursing and Rehabilitation has a no-pet policy.
University Nursing and Rehabilitation is registered as a for-profit.
Yes — there are 3 photos of University Nursing and Rehabilitation in the photo gallery on this page.
University Nursing and Rehabilitation is located at 1236 Lincoln Ave, Evansville, IN 47714.
Care Cost Calculator: See Prices in Your Area
Nursing Home Data Explorer
Don’t Wait Too Long: 7 Red Flag Signs Your Parent Needs Assisted Living Now
The True Cost of Assisted Living in 2025 – And How Families Are Paying For It
Understanding Senior Living Costs: Pricing Models, Discounts & Financial Assistance


