Woodland Assisted Living
Nursing Home, Assisted Living, Hospice Care, Independent Living, Palliative Care & Respite Care · Woodland, WA
CMS overall rating Info CMS (the Centers for Medicare & Medicaid Services) is the federal agency that rates nursing home quality. Its Overall Rating runs from 1 to 5 stars, combining health inspections, staffing, and quality measures, with inspections weighted most heavily.

Woodland Assisted Living

Nursing Home, Assisted Living, Hospice Care, Independent Living, Palliative Care & Respite Care · Woodland, WA
CMS overall rating Info CMS (the Centers for Medicare & Medicaid Services) is the federal agency that rates nursing home quality. Its Overall Rating runs from 1 to 5 stars, combining health inspections, staffing, and quality measures, with inspections weighted most heavily.
Calculator: See prices in your area
Woodland Assisted Living accepts Medicare, Medicaid, and private pay.

Overview of Woodland Assisted Living

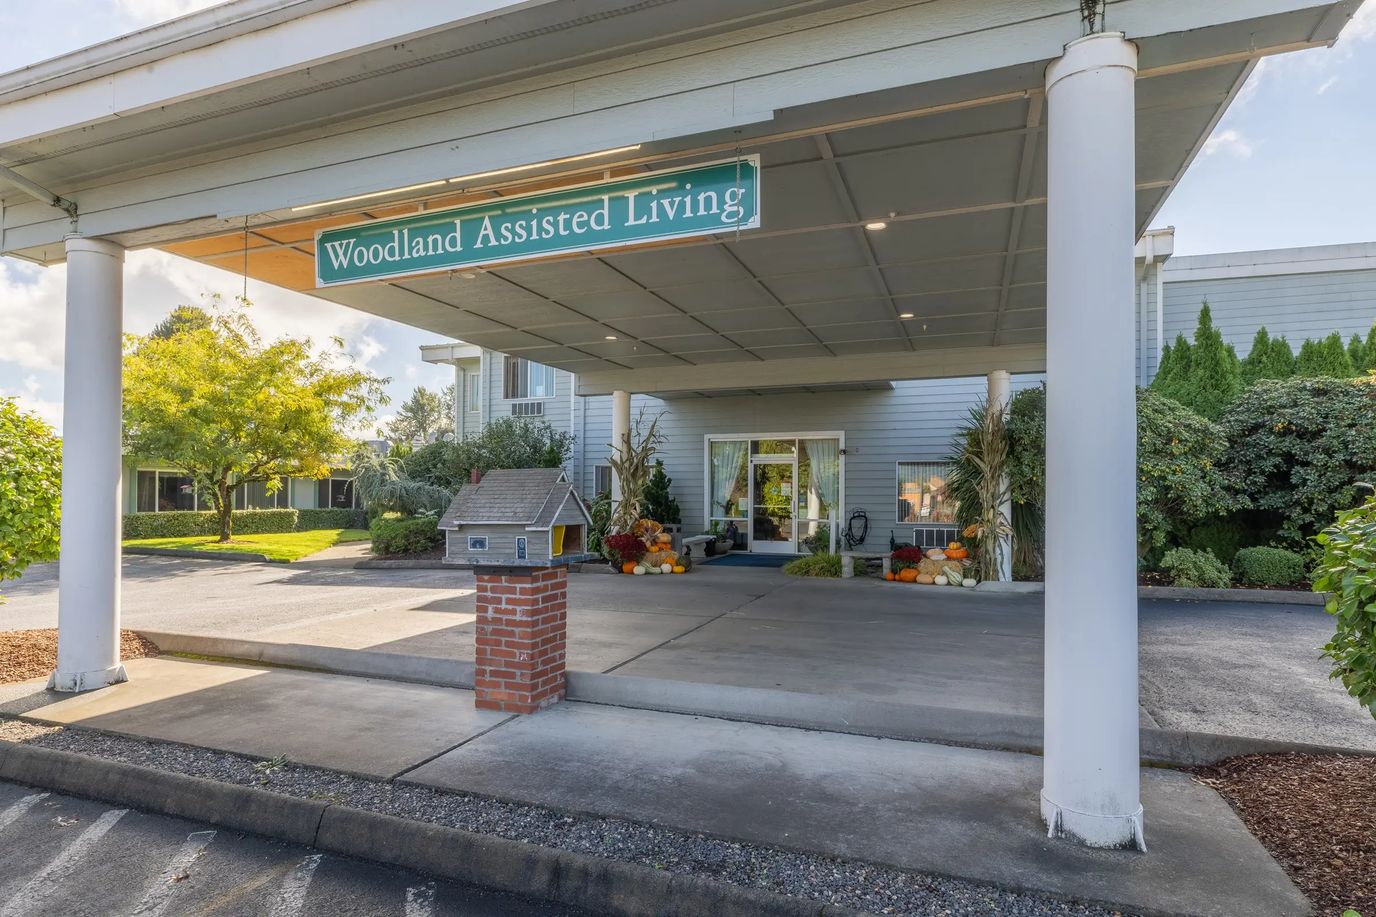
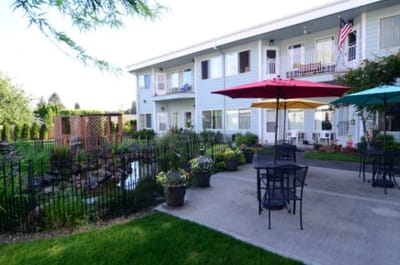
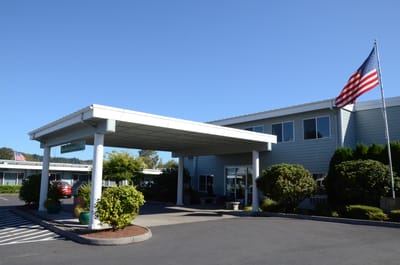
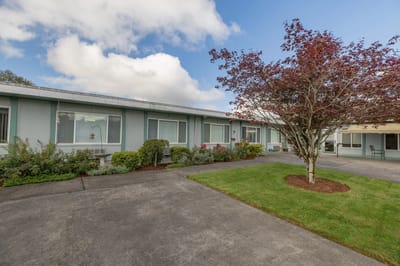
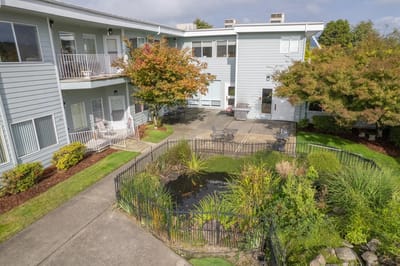
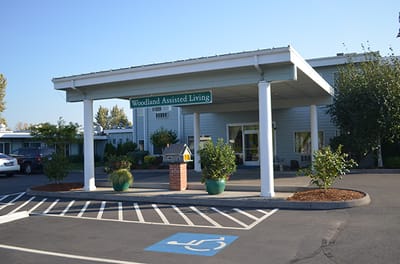
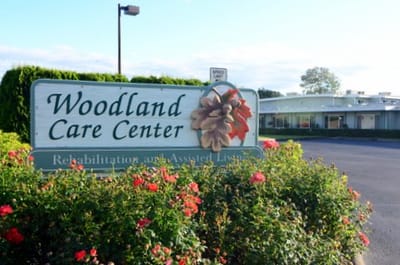
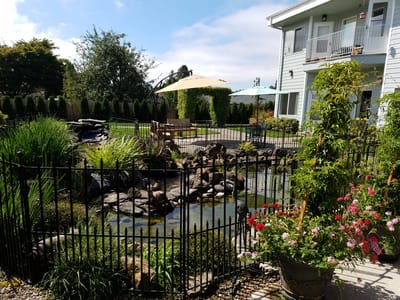
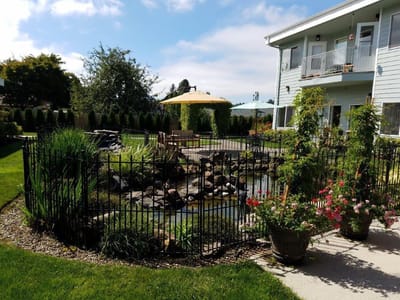
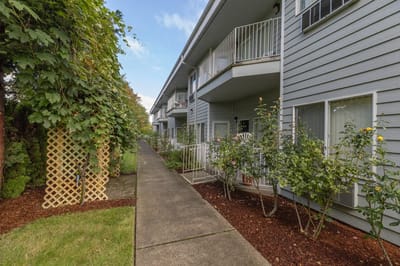
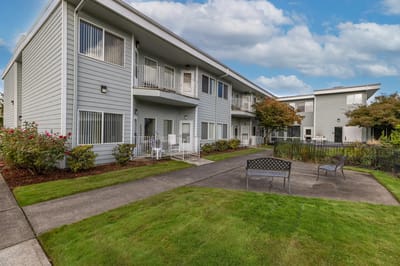
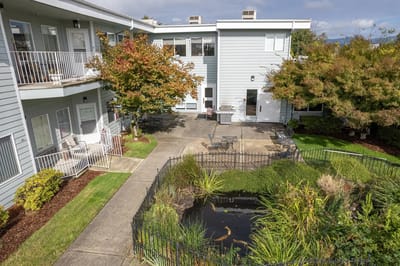
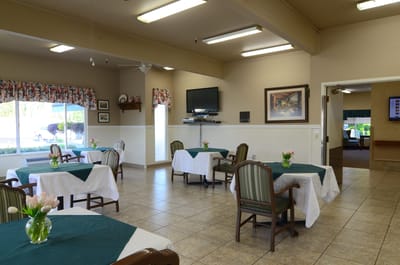
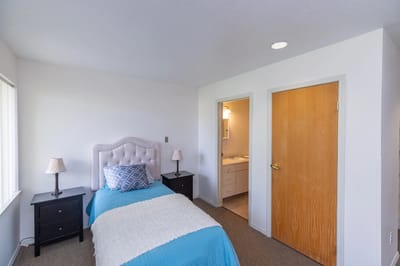
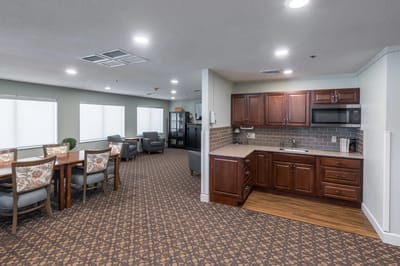
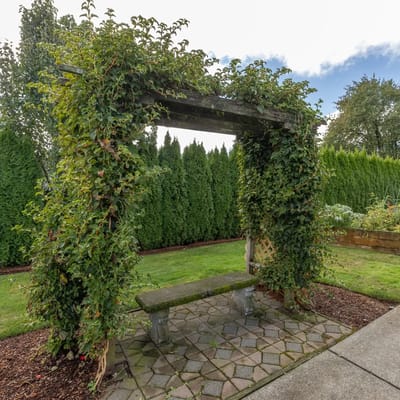
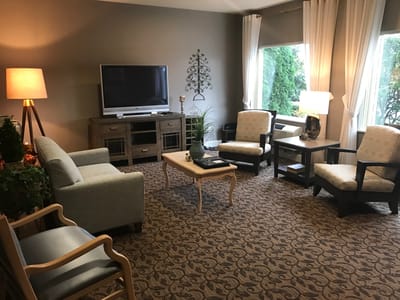
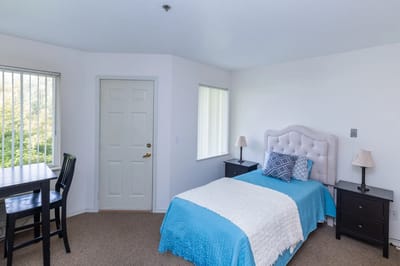
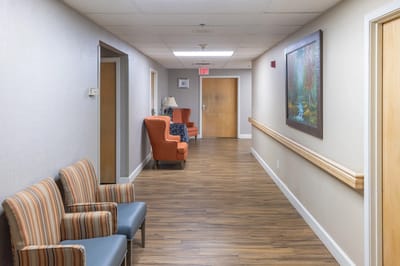
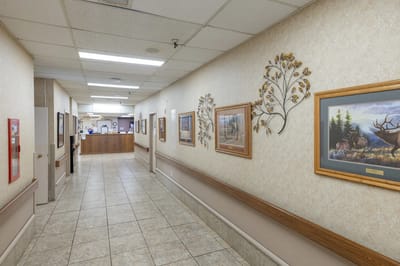
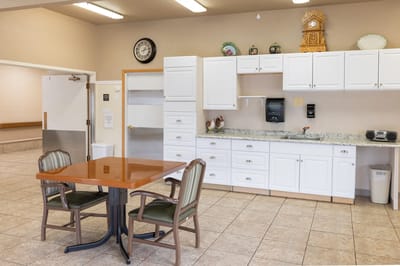
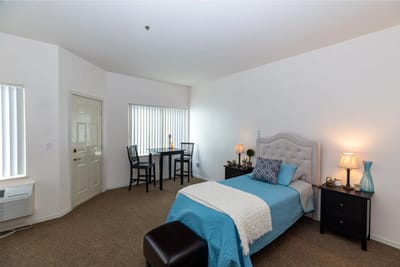
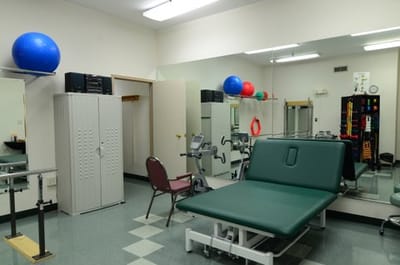
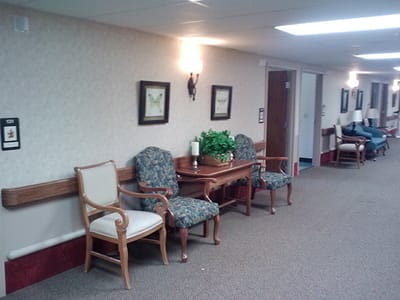
Operating since 1994 under owner Caroline Settlemier, Woodland Assisted Living balances skilled nursing, short-term rehabilitation, and memory care within a 32-bed campus. The facility features 14 private rehabilitation suites, a hydrotherapy tub, restorative nursing programs, and three daily meals. Local van trips and secure courtyards handle social engagement, while the physical location carries a Walk Score of 62. Residents maintain an average stay of 145 days, though modern financial records report a 16% occupancy rate, pointing to a recent drop in the building’s resident census.

State health summaries tracking four separate inspections since 2023 show a total of 19 citations, a volume running 61% below the Washington state baseline. Out of these reviews, zero critical or serious infractions were documented, though a $300 civil fine was issued in January 2024 due to delayed employee training updates.

While early 2025 audits flagged several fire safety and staff credentialing items, the facility’s latest check on November 10, 2025, came back entirely clean with zero deficiencies. Daily staffing averages 4 hours and 4 minutes per resident, with weekend nursing coverage tracking at 3 hours and 43 minutes. Clinical tracking files show strong preventive outcomes for short-term stays, including high vaccination numbers and zero increases in antipsychotic medications, though long-term residents experienced higher rates of functional decline.

Individuals researching regional post-acute rehabilitation choices can analyze these multi-year government logs to evaluate the operator’s current performance. Since the state archives show that past fire safety and training hurdles have been resolved—resulting in a completely flawless review at the end of 2025, the records indicate effective corrective actions. Arranging an in-person walkthrough is a practical next step to inspect the hydrotherapy setup, view the private suites, and directly question the management team about their strategies for rebuilding the resident census.

Quality ratings

Measured by Centers for Medicare & Medicaid Services (CMS)

Overall rating Info The Overall CMS Rating combines results from health inspections, staffing levels and quality measures. Health inspections carry the most weight. Staffing and quality scores can increase or decrease the final rating based on performance compared to state and national standards.
Health Inspection Info Based on the results of the facility's three most recent standard inspections and any complaint investigations. CMS reviews the number, scope, and severity of deficiencies, with more recent findings weighted more heavily.
Staffing Info Measures average nursing staff hours per resident per day, including Registered Nurses (RNs) and total nursing staff. Ratings are adjusted based on the level of care residents require and are compared to state and national benchmarks.
Quality Measures Info Based on clinical and physical health indicators reported to CMS, such as hospital readmissions, falls, pressure ulcers, and improvements in mobility. These measures reflect how well residents' health needs are being managed.

Staffing hours breakdown

Info Daily nursing hours per resident by staff type, reported to CMS. Higher is generally better — compare this facility to state and national averages to see where staffing stands.

Hours per resident per day — compared to state averages

Total nursing care / resident Info Total adjusted nursing hours per resident per day, combining RN, LPN, and aide time. CMS adjusts this for case-mix so facilities can be fairly compared.
4h 4m per day
Rank #47 / 90Nurse hours — State benchmarkedThis home is ranked 47th out of 90 homes in Washington. Shows adjusted nurse hours per resident per day benchmarked to the Washington average, with a ranking across 90 Washington facilities. More hours mean more direct care. The national average is about 3.5 hrs; below 3.0 is a red flag.Rankings are based only on facilities in Washington that report data for that category. Facilities without available data are excluded from the ranking.Click the rank badge to see the full State ranking.Click here to see the full State ranking.
vs avg
Staff typeHours / Day / Residentvs state avg
Registered Nurse (RN) Info RNs hold the highest nursing license and can assess residents, interpret test results, and direct care plans. More RN hours per day often signals stronger clinical oversight and faster response to health changes. 45m per day
LPN / LVN Info Licensed Practical Nurses (LPNs) or Licensed Vocational Nurses (LVNs) deliver routine hands-on care — medication administration, wound dressing, and monitoring vital signs. They work under RN supervision and make up a large share of daily bedside care. 45m per day
Nurse Aide Info Certified Nurse Aides (CNAs) provide the most direct day-to-day assistance: bathing, dressing, feeding, and mobility. Nurse aide hours are typically the largest staffing category and directly affect residents' quality of life. 2h 24m per day
Weekend Total Nursing Info Combined nursing hours (RN + LPN + Nurse Aide) per resident per day on weekends. Staffing often drops on weekends — this figure reveals whether the facility maintains adequate coverage outside of weekday hours. 3h 12m per day
Physical Therapist Info Hours per resident per day provided by licensed Physical Therapists (PTs) or PT Assistants. PT services help residents recover mobility after injury or illness and are especially important for post-acute (short-stay) rehabilitation. 1m per day
Weekend RN Info Registered nurse hours specifically on weekends. Facilities sometimes reduce RN presence on Saturdays and Sundays — a low weekend RN figure compared to weekday hours can indicate reduced clinical oversight when most administrative staff are absent. 26m per day

Capacity and availability

Avg. Length of Stay
145 days
Bed community size
32-bed community Rank #347 / 366Bed count — State benchmarkedThis home is ranked 347th out of 366 homes in Washington. Shows this facility's certified or reported bed count compared to other Washington facilities. Larger communities may offer more amenities, programs, and on-site services for residents and families.Rankings are based only on facilities in Washington that report data for that category. Facilities without available data are excluded from the ranking.Click the rank badge to see the full State ranking.Click here to see the full State ranking.
A moderately sized community that may balance personal attention with shared amenities and social activities.
Years in operation
32 years in operation
A longer operating history, which may indicate experience navigating regulations and delivering ongoing care.
Walk Score
Walk Score: 62 / 100 Rank #223 / 628Walk Score — State benchmarkedThis home is ranked 223rd out of 628 homes in Washington. Shows how walkable this facility's neighborhood is compared to the average Walk Score across Washington facilities. Higher scores benefit residents, families, and staff.Rankings are based only on facilities in Washington that report data for that category. Facilities without available data are excluded from the ranking.Click the rank badge to see the full State ranking.Click here to see the full State ranking.
Moderately walkable. Some errands can be accomplished on foot, with a mix of nearby amenities.
BBB Rating
BBB Rating: A+ (Not Accredited)
An independent rating from the Better Business Bureau based on factors such as complaint history, transparency, and business practices.
How BBB ratings work

About this community

Awards

Business of the Year 2023

License Details

Facility TypeBoarding Home
StatusOp
ExpirationApril 30, 2026 Expired
CountyClark
License Number1028
CMS Certification Number505232

Staffing

Key information about the people who lead and staff this community.

Leadership

ContactMr. Justin Settlemier, Administrator

Therapy & Rehabilitation

1 service
Rehabilitation Services

Staffing & Medical

1 service
24-Hour Staffing

Amenities & Lifestyle

14 Private Rehabilitation Suites
Wireless Internet And Cable Television
Hi/Low Electric Beds
Hydrotherapy Tub
Weekly Van/Bus Outings
Beautifully Landscaped Courtyards And Walking Path
Activities
Specific ProgramsWellness Program, Restorative Nursing Program, Restaurant + Dietary Program
Religious ServicesNon-denominational church services and bible study

Contact Woodland Assisted Living

Inspection History

In Washington, the Department of Social and Health Services, Residential Care Services conducts unannounced inspections and issues reports on the quality of care in all licensed settings.

Since 2023 · 3 years of data 29 deficiencies

Inspection Scorecard Info This scorecard compares key inspection, deficiency, and complaint metrics at this facility against the Washington state average. Metrics rated ≥15% worse than average are highlighted in red; those ≥15% better are highlighted in green.

Since 2023 vs. Washington state average
Overall vs. WA average 0 Worse No metrics in this bucket. 2 Better Metrics better than Washington average:
• Total deficiencies (6% below)
• Deficiencies per year (6% below)
Latest Inspection November 10, 2025 Follow Up

Deficiencies Info Deficiencies are formal regulatory issues recorded during state inspections.

This FacilityWA Averagevs. WA Avg
Total deficiencies Info Formal regulatory issues recorded by inspectors across all inspection types. 2931 This facility has 6% fewer total deficiencies than a typical Washington assisted living residence (29 vs. WA avg 31).↓ 6% better
Deficiencies per year Info Average deficiencies per year since 2023. 9.710.3 This facility has 6% fewer deficiencies per year than a typical Washington assisted living residence (9.7 vs. WA avg 10.3).↓ 6% better

Inspection Reports Summary Info An editor-reviewed summary of the themes and findings across this facility's recent inspection reports.

  • November 10, 2025 follow-up inspection found no deficiencies, confirming correction of prior issues with background checks, staff training, certification, tuberculosis testing, and fire extinguisher inspections.
  • March and May 2025 fire safety inspections found multiple serious violations including out-of-compliance fire doors, missing fire sprinkler inspection reports, incomplete fire alarm acceptance testing, combustibles near heaters, and holes in fire-rated construction.
  • January 18, 2024 enforcement visit imposed a $300 fine for failure to ensure two staff completed required training, a previously cited deficiency that remained uncorrected at that time.

Health Inspection History

Inspections since 2023
Total health inspections 4

State average N/A


Last Health inspection on Jun 2025

Total health citations
19 Rank #10 / 92Health citations — State benchmarkedThis home is ranked 10th out of 92 homes in Washington. Shows this facility's total health deficiency citations benchmarked to the Washington State average, with a ranking across all 92 WA facilities. Lower citation counts earn a better rank.Rankings are based only on facilities in Washington that report data for that category. Facilities without available data are excluded from the ranking.Click the rank badge to see the full State ranking.Click here to see the full State ranking.

State average N/A

Citations per inspection
4.75 Rank #23 / 92Citations per inspection — State benchmarkedThis home is ranked 23rd out of 92 homes in Washington. Shows average deficiency citations per CMS inspection for this facility versus the Washington mean across 92 facilities with citation data. Lower is better.Rankings are based only on facilities in Washington that report data for that category. Facilities without available data are excluded from the ranking.Click the rank badge to see the full State ranking.Click here to see the full State ranking.

State average N/A


Health citations are formal notices following inspections when they fail to comply with safety and care standards.

18 of 19 citations resulted from standard inspections; and 1 of 19 resulted from complaint investigations.

Breakdown of citation severity (last 3 years)
Critical health citations
0
In line with State average

State average: N/A


Serious health citations
0
In line with State average

State average: N/A

0 critical citations State average: N/A

0 serious citations State average: N/A

19 moderate citations State average: N/A

0 minor citations State average: N/A
Citations history (last 3 years)
Abuse/Neglect moderate citation Jun 20, 2025
Corrected

Pharmacy moderate citation Jun 20, 2025
Corrected

Pharmacy moderate citation Jun 20, 2025
Corrected

Quality of Care moderate citation Jun 20, 2025
Corrected

Staffing Data

Reporting period: October 1 – December 31, 2025 (Q4 2025). Source: CMS Payroll-Based Journal report.

Total staff 76
Employees 50
Contractors 26
Staff to resident ratio 1.52 : 1
0% compared with State average

State average ratio: 0 : 0

Avg staff/day 26
Average shift 7.2 hours
0% compared with State average

State average: 0 hours

Total staff hours (quarter) 17,170

Nursing staff breakdown

Q4 2025 · Oct 1 – Dec 31 More info This data comes from the CMS Payroll-Based Journal report covering October 1 – December 31, 2025.
Registered Nurse

Manages medical care and health needs.

RN Staff Info All 4 RN Staff are full-time employees. No contractors work on this role. 4
Average shift length Info Average shift length. Calculated as total hours divided by days worked and average staff per day. 7.5 hours
Licensed Practical Nurse

Assists with medical care and medications.

LPN Staff Info All 8 LPN Staff are full-time employees. No contractors work on this role. 8
Average shift length Info Average shift length. Calculated as total hours divided by days worked and average staff per day. 7.6 hours
Certified Nursing Assistant

Helps with daily care and mobility.

CNA Staff Info 41 total: 30 full-time employees and 11 contractors. 41
Average shift length Info Average shift length. Calculated as total hours divided by days worked and average staff per day. 7.6 hours

Contractor staffing

Q4 2025 · Oct 1 – Dec 31 More info This data comes from the CMS Payroll-Based Journal report covering October 1 – December 31, 2025.

Total hours from contractors

7.5%

1,293 contractor hours this quarter

Certified Nursing Assistant: 11 Physical Therapy Assistant: 3 Speech Language Pathologist: 2 Diagnostic X-ray Services Staff: 2 Qualified Social Worker: 2 Other Physician: 1 Respiratory Therapy Technician: 1 Physical Therapy Aide: 1 Medical Director: 1 Occupational Therapy Aide: 1 Occupational Therapy Assistant: 1

Staff by category

Q4 2025 · Oct 1 – Dec 31 More info This data comes from the CMS Payroll-Based Journal report covering October 1 – December 31, 2025.
Certified Nursing Assistant3011419,77592100%7.6
Licensed Practical Nurse8082,62692100%7.6
Registered Nurse4041,2988693%7.5
Clinical Nurse Specialist3031,1687582%6.8
Nurse Practitioner1016126470%9.6
RN Director of Nursing1014055863%7
Physical Therapist2023304347%5.9
Dental Services Staff1012714549%6
Diagnostic X-ray Services Staff0221982426%6
Speech Language Pathologist0221255863%2.2
Physical Therapy Assistant0331024043%2.6
Medical Director011961213%8
Occupational Therapy Aide0115678%8
Respiratory Therapy Technician011541921%2.8
Occupational Therapy Assistant0113233%10.6
Other Physician0111233%4
Qualified Social Worker022744%1.6
Physical Therapy Aide011222%1.2
41 Certified Nursing Assistant
% of Days 100%
8 Licensed Practical Nurse
% of Days 100%
4 Registered Nurse
% of Days 93%
3 Clinical Nurse Specialist
% of Days 82%
1 Nurse Practitioner
% of Days 70%
1 RN Director of Nursing
% of Days 63%
2 Physical Therapist
% of Days 47%
1 Dental Services Staff
% of Days 49%
2 Diagnostic X-ray Services Staff
% of Days 26%
2 Speech Language Pathologist
% of Days 63%
3 Physical Therapy Assistant
% of Days 43%
1 Medical Director
% of Days 13%
1 Occupational Therapy Aide
% of Days 8%
1 Respiratory Therapy Technician
% of Days 21%
1 Occupational Therapy Assistant
% of Days 3%
1 Other Physician
% of Days 3%
2 Qualified Social Worker
% of Days 4%
1 Physical Therapy Aide
% of Days 2%

Penalties and fines

Includes penalties issued in 2023-2025

Federal penalties imposed by CMS for regulatory violations, including civil money penalties (fines) and denials of payment for new Medicare/Medicaid admissions.

Source: CMS Penalties Database (Data as of Jan 2026)

Total fines amount $18K Rank #45 / 92Federal fines — State benchmarkedThis home is ranked 45th out of 92 homes in Washington. Shows this facility's cumulative CMS federal fine dollars versus the Washington average among facilities with fines, and where it ranks among 92 facilities in the pool. Lower total dollars mean a better rank.Rankings are based only on facilities in Washington that report data for that category. Facilities without available data are excluded from the ranking.Click the rank badge to see the full State ranking.Click here to see the full State ranking.
78% lower than State average

State average: $82K

Number of fines 1
46% fewer fines than State average

State average: 1.8

Payment Denials Info Serious action where Medicare and/or Medicaid temporarily stops payments for new residents until issues are fixed. 1
261% more payment denials than State average

State average: 0.3

Fines amount comparison
This facility $18K
State average $82K
Penalty History

Penalties are imposed by CMS for violations of federal nursing home regulations.

2 penalties in the past 3 years

Multiple penalties were reported in the last 3 years.

Payment Denial Info Serious action where Medicare and/or Medicaid temporarily stops payments for new residents until issues are fixed. Jun 20, 2025
23 days
Civil Money Penalty Info Fines imposed for noncompliance, which can be assessed per day or per instance of violation. Oct 27, 2023
$18K

Last updated: Jan 2026

Quality of care over time

These measures show how residents usually do over time at this home, based on health outcomes and preventive care.

High-risk clinical events score Info A composite score based on pressure ulcers, falls with injury, weight loss, walking ability decline, and activities of daily living decline. 14.1
40% worse than State average

State average: 10.0

Functional decline score Info A composite score based on activities of daily living decline, walking ability decline, and incontinence. 29.6
42% worse than State average

State average: 20.9

Long-stay resident measures
Need for Help with Daily Activities Increased Info Percent of long-stay residents whose need for help with daily activities has increased 17.6%
7% worse than State average

State average: 16.4%

Walking Ability Worsened Info Percent of long-stay residents whose ability to move independently worsened 38.5%
77% worse than State average

State average: 21.8%

Low Risk Residents with Bowel/Bladder Incontinence Info Percent of low risk long-stay residents who lose control of their bowels or bladder 32.6%
34% worse than State average

State average: 24.3%

Falls with Major Injury Info Percent of long-stay residents experiencing one or more falls with major injury 0.0%
100% better than State average

State average: 2.6%

High Risk Residents with Pressure Ulcers Info Percent of long-stay high risk residents with pressure ulcers 5.0%
In line with State average

State average: 4.9%

Urinary Tract Infection Info Percent of long-stay residents with a urinary tract infection 0.0%
100% better than State average

State average: 1.7%

Lost Too Much Weight Info Percent of long-stay residents who lose too much weight 9.1%
56% worse than State average

State average: 5.8%

Depressive Symptoms Info Percent of long-stay residents who have depressive symptoms 4.5%
72% better than State average

State average: 16.2%

Antipsychotic Use Info Percent of long-stay residents who received an antipsychotic medication 21.2%
47% worse than State average

State average: 14.5%

Pneumococcal Vaccine Info Percent of long-stay residents assessed and appropriately given the pneumococcal vaccine 100.0%
In line with State average

State average: 96.2%

Influenza Vaccine Info Percent of long-stay residents assessed and appropriately given the seasonal influenza vaccine 98.1%
5% better than State average

State average: 93.8%

Short-stay resident measures
Pneumococcal Vaccine Info Percent of short-stay residents assessed and appropriately given the pneumococcal vaccine 98.7%
12% better than State average

State average: 88.1%

Antipsychotic medication increase Info Percent of short-stay residents who newly received an antipsychotic medication 0.0%
100% better than State average

State average: 1.4%

Influenza Vaccine Info Percent of short-stay residents assessed and appropriately given the seasonal influenza vaccine 94.4%
15% better than State average

State average: 82.0%

Breakdown by payment type

Medicare

19% of new residents, usually for short-term rehab.

Typical stay 29 days

Private pay

70% of new residents, often for short stays.

Typical stay 1 - 2 months

Medicaid

12% of new residents, often for long-term daily care.

Typical stay 2 years

Facility Characteristics

Source: CMS Long-Term Care Facility Characteristics (Data as of Jan 2026)

Total residents 50
Medicare
1
2% of residents
Medicaid
35
70% of residents
Private pay or other
14
28% of residents
Programs & Services
Residents Group

Residents meet regularly to discuss policies, care quality, and activities

Active Resident Council

Organized group of residents that meets regularly to discuss facility policies, quality of life, and activities.

Finances and operations

Based on CMS SNF Cost Report for fiscal year ending in 12/2023.

For-profit
Corporation
Net patient revenue Info Net patient revenue — what the home actually collects for resident care, after contractual allowances, bad debt and discounts are subtracted from its gross charges (CMS cost report, Worksheet G-3). It covers resident care only; money the home earns from other sources is shown separately as "Other income."
$5.9M
Net patient income Info Net patient income: net patient revenue minus the home's total operating expenses. A positive figure means it earns more from resident care than it spends to deliver it; a negative figure means the opposite. It excludes non-operating "other income."
-$439.3K
For-profit Corporation
Net patient revenue Info Net patient revenue — what the home actually collects for resident care, after contractual allowances, bad debt and discounts are subtracted from its gross charges (CMS cost report, Worksheet G-3). It covers resident care only; money the home earns from other sources is shown separately as "Other income."
$5.9M Rank #82 / 94Revenue — State benchmarkedThis home is ranked 82nd out of 94 homes in Washington. Shows this facility's annual revenue compared to the Washington average. Higher revenue generally means more resources for staffing and capital — read alongside Payroll %.Rankings are based only on facilities in Washington that report data for that category. Facilities without available data are excluded from the ranking.Click the rank badge to see the full State ranking.Click here to see the full State ranking.
Net patient income Info Net patient income: net patient revenue minus the home's total operating expenses. A positive figure means it earns more from resident care than it spends to deliver it; a negative figure means the opposite. It excludes non-operating "other income."
-$439.3K
Other income Info Money the home earns outside of resident care — such as investments, grants, rentals and other non-operating sources (CMS cost report, Worksheet G-3). It is tracked separately from net patient revenue: it is not part of that figure, and it is not included in net patient income.
$1.6M
Payroll costs Info Staff salaries plus wage-related costs — benefits such as payroll taxes, health insurance and retirement — from the home's own accounting records (CMS cost report, Worksheet A). Contract or agency labor is counted separately, under other operating costs. Rank #74 / 94Payroll — State benchmarkedThis home is ranked 74th out of 94 homes in Washington. Shows total annual staff payroll benchmarked to the Washington average. Higher payroll investment relative to peers often signals better staffing and less reliance on cheaper contract labor.Rankings are based only on facilities in Washington that report data for that category. Facilities without available data are excluded from the ranking.Click the rank badge to see the full State ranking.Click here to see the full State ranking.
$3.9M 65.4% of net patient revenue Info Payroll as a share of revenue: staff salaries and wage-related benefits divided by net patient revenue. A higher figure means more of each revenue dollar goes to staff pay. Rank #21 / 94Payroll % — State benchmarkedThis home is ranked 21st out of 94 homes in Washington. Shows payroll as a percentage of revenue versus the Washington average. Well-run Washington facilities typically land around 53–61% — the top third Statewide. Below 25% may signal understaffing or heavy agency use — read with Staffing ratings.Rankings are based only on facilities in Washington that report data for that category. Facilities without available data are excluded from the ranking.Click the rank badge to see the full State ranking.Click here to see the full State ranking.
Other operating costs Info Everything it costs to run the home apart from payroll — food, utilities, supplies, maintenance, contract labor and administration. Calculated as total operating expense minus payroll (staff salaries and wage-related benefits).
$2.5M
Total costs Info The home's total operating expense for the year — all the costs of running it, salaries included (CMS cost report, Worksheet G-3).
$6.4M

Who this home usually serves

TYPE OF STAY

Primarily short stays

Residents typically stay for brief periods, with frequent admissions and discharges throughout the year.

Most new residents arrive under private pay (70% of admissions), and a typical private pay stay runs around 1 - 2 months.

Admissions
128 total

Coverage residents most often arrive under.

Medicare 19%
Private pay 70%
Medicaid 12%
Discharges
119 total

Coverage residents most often leave under.

Medicare 14%
Private pay 69%
Medicaid 17%

Places of interest near Woodland Assisted Living

Address 0.0 miles from city center Info Estimated distance in miles from Woodland's city center to Woodland Assisted Living's address, calculated via Google Maps.

Calculate Travel Distance to Woodland Assisted Living

Add your location

Address

Compare Nursing Homes around the area

The information below is reported by the Washington Department of Social and Health Services, Residential Care Services.

Woodland Assisted Living
NH
AL
HC
IL
PC
RC
Woodland -32 A+ 62 -
Bonaventure of Lacey
NH
AL
IL
MC
Lacey -126 A+ 55 1 Bed / 2 Bed
Weatherly Inn Renton
NH
AL
MC
Renton (Talbot Road South) -65 - 27 Studio / 1 Bed / 2 Bed
Washington Odd Fellows Home
NH
AL
Walla Walla -71 - 67 Studio / 1 Bed
Timber Ridge
NH
AL
IL
MC
Issaquah (Talus) -26 A+ 19 -

Frequently Asked Questions about Woodland Assisted Living

Is Woodland Assisted Living in a walkable area?

Woodland Assisted Living has a walk score of 62. Moderately walkable. Some errands can be accomplished on foot, with a mix of nearby amenities.

What is the license number of Woodland Assisted Living?

According to WA state health department records, Woodland Assisted Living's license number is 1028.

When does Woodland Assisted Living's license expire?

According to WA state health department records, Woodland Assisted Living's license expires on April 30, 2026.

What is the occupancy rate at Woodland Assisted Living?

Woodland Assisted Living's occupancy is 76.3%.

Does Woodland Assisted Living operate as a for-profit or non-profit?

Woodland Assisted Living is registered as a for-profit in WA.

How many beds does Woodland Assisted Living have?

Woodland Assisted Living has 32 beds.

Are there photos of Woodland Assisted Living?

Yes — there are 54 photos of Woodland Assisted Living in the photo gallery on this page.

Guides for Better Senior Living

Care Cost Calculator: See Prices in Your Area

Nursing Home Data Explorer

Don’t Wait Too Long: 7 Red Flag Signs Your Parent Needs Assisted Living Now

The True Cost of Assisted Living in 2025 – And How Families Are Paying For It

Understanding Senior Living Costs: Pricing Models, Discounts & Financial Assistance