


Total staff
64
Employees
50
Contractors
14
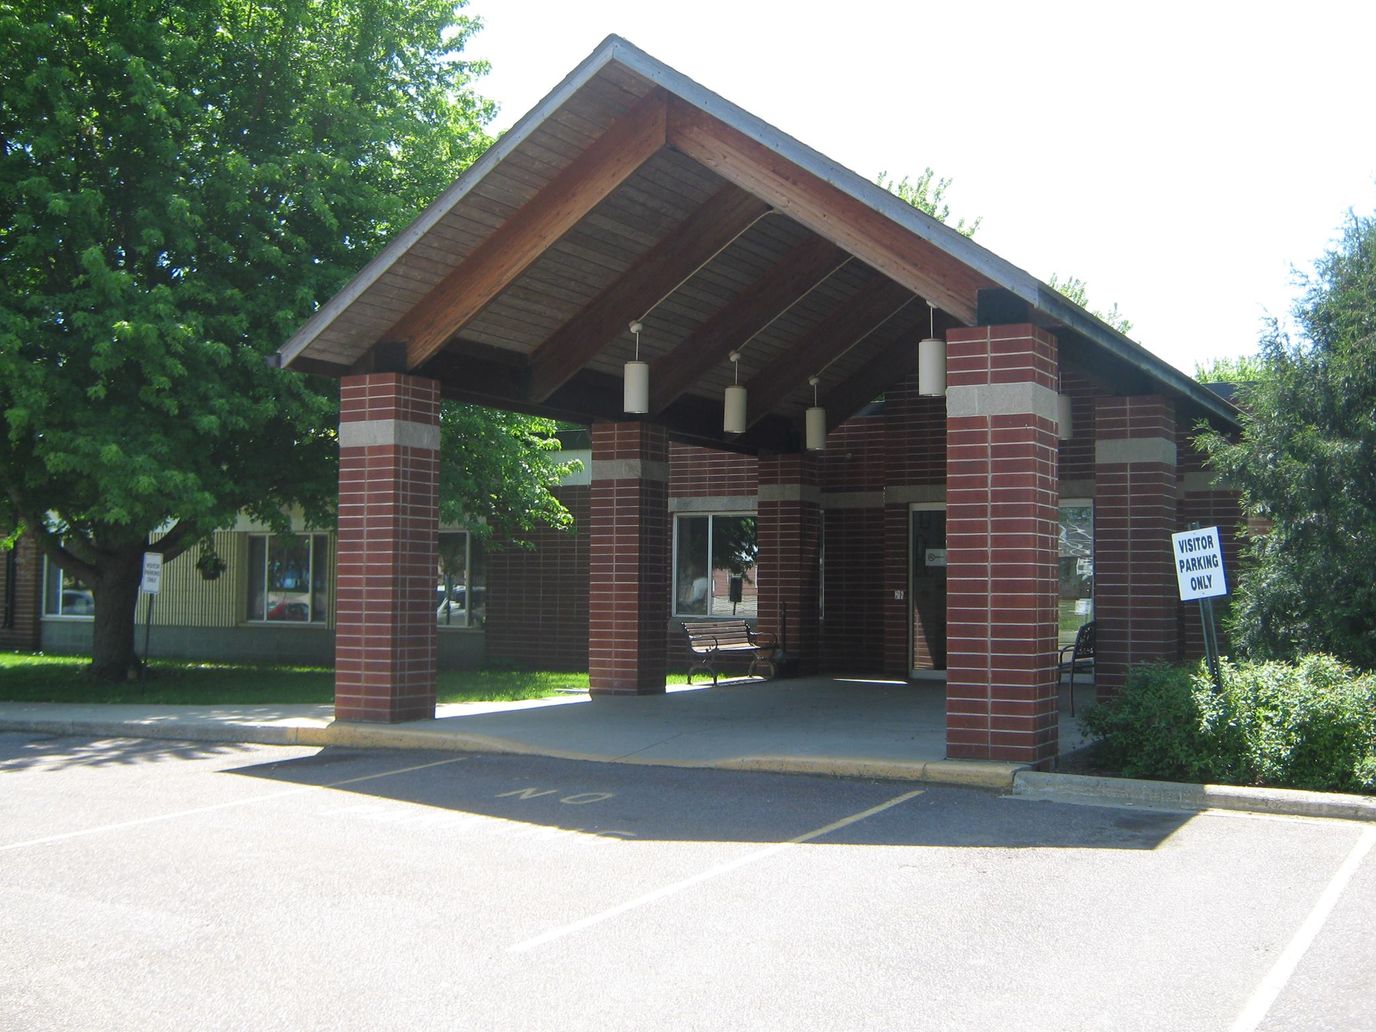
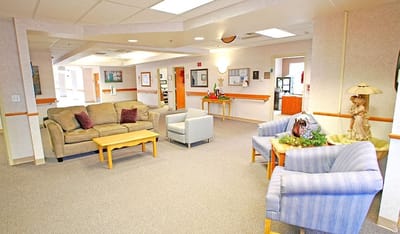
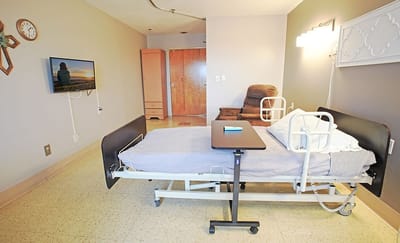
Valley View Manor, is a medium sized skilled nursing facility found in Lamberton, MN. They offer short-term care, respite care, rehabilitation services, long term care, and hospice care. This nursing facility takes pride in the quality of care they provide their residents, from 24/7 nursing care to medication management, and assistance with daily living activities.
Additionally, Valley View Manor also provides its residents regular meals and snacks, prepared in a way that it is both delicious and nutritious. Furthermore, housekeeping and laundry services are also provided, so that the residents may be able to use their time and energy in exploring the community and taking advantage of their well thought amenities.
| Staff type | Hours / Day / Resident | vs state avg |
|---|---|---|
|
Registered Nurse (RN)
| 1h 6m per day | ▲ 3% State avg: 1h 4m per day · National avg: 41m per day |
|
LPN / LVN
| 23m per day | ▼ 38% State avg: 37m per day · National avg: 52m per day |
|
Nurse Aide
| 2h 38m per day | ▲ 3% State avg: 2h 33m per day · National avg: 2h 21m per day |
|
Weekend Total Nursing
| 3h 25m per day | ▼ 7% State avg: 3h 41m per day · National avg: 3h 26m per day |
|
Weekend RN
| 40m per day | ■ Avg State avg: 41m per day · National avg: 29m per day |
Reporting period: July 1 – September 30, 2025 (Q3 2025). Source: CMS Payroll-Based Journal report.
Manages medical care and health needs.
Assists with medical care and medications.
Helps with daily care and mobility.
Total hours from contractors
1,837 contractor hours this quarter
| Certified Nursing Assistant | 19 | 9 | 28 | 5,453 | 92 | 100% | 7.3 |
| Registered Nurse | 4 | 4 | 8 | 2,288 | 92 | 100% | 8 |
| Medication Aide/Technician | 10 | 0 | 10 | 1,452 | 90 | 98% | 6.6 |
| Licensed Practical Nurse | 6 | 1 | 7 | 1,024 | 85 | 92% | 7 |
| Other Dietary Services Staff | 4 | 0 | 4 | 598 | 77 | 84% | 4.2 |
| Clinical Nurse Specialist | 1 | 0 | 1 | 496 | 62 | 67% | 8 |
| Physical Therapy Aide | 1 | 0 | 1 | 495 | 63 | 68% | 7.9 |
| Dental Services Staff | 1 | 0 | 1 | 438 | 57 | 62% | 7.7 |
| Dietitian | 1 | 0 | 1 | 436 | 57 | 62% | 7.6 |
| Administrator | 1 | 0 | 1 | 432 | 54 | 59% | 8 |
| Nurse Practitioner | 1 | 0 | 1 | 96 | 12 | 13% | 8 |
| Mental Health Service Worker | 1 | 0 | 1 | 1 | 1 | 1% | 1 |
Includes penalties issued in 2023
Federal penalties imposed by CMS for regulatory violations, including civil money penalties (fines) and denials of payment for new Medicare/Medicaid admissions.
Source: CMS Penalties Database (Data as of Jan 2026)
Minnesota average: $44K
Minnesota average: 2.0
Minnesota average: 0.4
Penalties are imposed by CMS for violations of federal nursing home regulations.
1 penalty in the past 3 years
Aug 21, 2023 · 33 days
Last updated: Jan 2026
These measures show how residents usually do over time at this home, based on health outcomes and preventive care.
Minnesota average: 11.1
Minnesota average: 22.6
Minnesota average: 18.9%
Minnesota average: 23.8%
Minnesota average: 25.0%
Minnesota average: 3.7%
Minnesota average: 5.4%
Minnesota average: 2.7%
Minnesota average: 4.1%
Minnesota average: 4.4%
Minnesota average: 17.2%
Minnesota average: 97.3%
Minnesota average: 96.0%
Minnesota average: 88.9%
Minnesota average: 1.9%
Quality measures are calculated from Minimum Data Set (MDS) assessments. For most measures, lower percentages indicate better care quality.
20% of new residents, usually for short-term rehab.
30% of new residents, often for short stays.
51% of new residents, often for long-term daily care.
Source: CMS Long-Term Care Facility Characteristics (Data as of Jan 2026)
Residents meet regularly to discuss policies, care quality, and activities
Family members meet regularly to discuss policies, care quality, and activities
Organized group of family members that meets regularly to discuss facility policies, resident care, and activities.
Organized group of residents that meets regularly to discuss facility policies, quality of life, and activities.
Data sourced from CMS Long-Term Care Facility Characteristics quarterly report. Payer mix reflects the current resident census by primary payment source.
Historical financial and operational data for Valley View Manor from 2012–2023, based on CMS SNF Cost Reports.
Key figures below are for fiscal year ending in 09/2023.
Based on CMS SNF Cost Report for fiscal year ending in 09/2023.
Most residents stay for extended periods and receive ongoing daily care.
Most new residents arrive under Medicaid (51% of admissions), and a typical Medicaid stay runs around 5 - 6 months.
Coverage residents most often arrive under.
Coverage residents most often leave under.
![]() 0.5 miles from city center
0.5 miles from city center
![]() Estimated distance in miles from Lamberton's city center to Valley View Manor's address, calculated via Google Maps.
— 15.17 miles to nearest hospital (Sanford Westbrook Medical Center)
Estimated distance in miles from Lamberton's city center to Valley View Manor's address, calculated via Google Maps.
— 15.17 miles to nearest hospital (Sanford Westbrook Medical Center)
Add your location
Info below is compiled from CMS reports & the MN Dept. of Health, senior community websites & trusted data sources such as Walk Score & BBB.
Communities are listed from highest to lowest based on our ranking methodology.
| Presbyterian Homes of Bloomington | NH AL IL MC SNF | Bloomington (West Bloomington) | 111
Facility
111
MN AVG
61
Rank
#97 / 528 |
81.1%
Facility
81.1%
MN AVG
72.9
Rank
#111 / 282 | +11% | 5.39
Facility
5.39
MN AVG
4.77
Rank
#13 / 67 | +16% | +13% | $0
Facility
$0
MN AVG
$47.9k
Rank
#1 / 67 | 12
Facility
12
MN AVG
23.2
Rank
#10 / 67 | 4.0
Facility
4.0
MN AVG
3.8
Rank
#32 / 67 | - | 90 | - |
37
Facility
37
MN AVG
43
Rank
#357 / 632 | Michelle Sullivan | $15.1MFiscal year ending 09/2023
Facility
$15.1MFiscal year ending 09/2023
MN AVG
$9.9M
Rank
#10 / 67 | $14.0MFiscal year ending 09/2023
Facility
$14.0MFiscal year ending 09/2023
MN AVG
$4.9M
Rank
#9 / 67 | 93.1%Fiscal year ending 09/2023
Facility
93.1%Fiscal year ending 09/2023
MN AVG
50.7%
Rank
#45 / 67 | 245556 | ||||
| Trillium Woods | NH AL IL MC SNF | Plymouth (Glacier Vista) | 44
Facility
44
MN AVG
61
Rank
#273 / 528 |
72.7%
Facility
72.7%
MN AVG
72.9
Rank
#175 / 282 | 0% | 6.18
Facility
6.18
MN AVG
4.77
Rank
#5 / 67 | +8% | +30% | $0
Facility
$0
MN AVG
$47.9k
Rank
#1 / 67 | 4
Facility
4
MN AVG
23.2
Rank
#1 / 67 | 2.0
Facility
2.0
MN AVG
3.8
Rank
#3 / 67 | - | 32 | A+ |
4
Facility
4
MN AVG
43
Rank
#585 / 632 | Lcs Trillium Woods Jv LLC | $3.9MFiscal year ending 12/2023
Facility
$3.9MFiscal year ending 12/2023
MN AVG
$9.9M
Rank
#11 / 67 | $8.8MFiscal year ending 12/2023
Facility
$8.8MFiscal year ending 12/2023
MN AVG
$4.9M
Rank
#22 / 67 | 223.4%Fiscal year ending 12/2023
Facility
223.4%Fiscal year ending 12/2023
MN AVG
50.7%
Rank
#61 / 67 | 245627 | ||||
| Redeemer Health Care Center | NH HOS PC RC SNF | Minneapolis (Powderhorn) | 119
Facility
119
MN AVG
61
Rank
#77 / 528 |
93.9%
Facility
93.9%
MN AVG
72.9
Rank
#45 / 282 | +29% | 5.23
Facility
5.23
MN AVG
4.77
Rank
#17 / 67 | -28% | +10% | $0
Facility
$0
MN AVG
$47.9k
Rank
#1 / 67 | 25
Facility
25
MN AVG
23.2
Rank
#30 / 67 | 5.0
Facility
5.0
MN AVG
3.8
Rank
#46 / 67 | - | 112 | - |
95
Facility
95
MN AVG
43
Rank
#3 / 632 | Danny Colgan | $15.5MFiscal year ending 12/2023
Facility
$15.5MFiscal year ending 12/2023
MN AVG
$9.9M
Rank
#24 / 67 | $9.9MFiscal year ending 12/2023
Facility
$9.9MFiscal year ending 12/2023
MN AVG
$4.9M
Rank
#16 / 67 | 63.5%Fiscal year ending 12/2023
Facility
63.5%Fiscal year ending 12/2023
MN AVG
50.7%
Rank
#24 / 67 | 245520 | ||||
| Pelican Valley Senior Living | NH AL HOS MC RC SNF | Pelican Rapids (East Mill Avenue) | 28
Facility
28
MN AVG
61
Rank
#344 / 528 |
91.1%
Facility
91.1%
MN AVG
72.9
Rank
#63 / 282 | +25% | 5.36
Facility
5.36
MN AVG
4.77
Rank
#13 / 67 | -10% | +12% | $0
Facility
$0
MN AVG
$47.9k
Rank
#1 / 67 | 9
Facility
9
MN AVG
23.2
Rank
#8 / 67 | 3.0
Facility
3.0
MN AVG
3.8
Rank
#14 / 67 | - | 26 | - |
58
Facility
58
MN AVG
43
Rank
#191 / 632 | Pelican Valley Health Center | $4.2MFiscal year ending 09/2023
Facility
$4.2MFiscal year ending 09/2023
MN AVG
$9.9M
Rank
#50 / 67 | $4.6MFiscal year ending 09/2023
Facility
$4.6MFiscal year ending 09/2023
MN AVG
$4.9M
Rank
#48 / 67 | 110.5%Fiscal year ending 09/2023
Facility
110.5%Fiscal year ending 09/2023
MN AVG
50.7%
Rank
#38 / 67 | 245373 | ||||
| Valley View Manor | NH HOS RC SNF | Lamberton | 50
Facility
50
MN AVG
61
Rank
#257 / 528 |
62.0%
Facility
62.0%
MN AVG
72.9
Rank
#200 / 282 | -15% | 4.75
Facility
4.75
MN AVG
4.77
Rank
#33 / 67 | -12% | 0% | $125.3k
Facility
$125.3k
MN AVG
$47.9k
Rank
#62 / 67 | 40
Facility
40
MN AVG
23.2
Rank
#53 / 67 | 4.0
Facility
4.0
MN AVG
3.8
Rank
#32 / 67 | - | 31 | - |
31
Facility
31
MN AVG
43
Rank
#404 / 632 | Shawna Dorr-Jones | $3.9MFiscal year ending 09/2023
Facility
$3.9MFiscal year ending 09/2023
MN AVG
$9.9M
Rank
#63 / 67 | $2.1MFiscal year ending 09/2023
Facility
$2.1MFiscal year ending 09/2023
MN AVG
$4.9M
Rank
#66 / 67 | 53.5%Fiscal year ending 09/2023
Facility
53.5%Fiscal year ending 09/2023
MN AVG
50.7%
Rank
#28 / 67 | 245378 |
Valley View Manor is in the Lamberton neighborhood.
Valley View Manor has a walk score of 31. Somewhat walkable. A few nearby services may be reachable on foot, but most trips require transportation.
Valley View Manor's occupancy is 63.3%.
No, Valley View Manor has a no-pet policy.
Valley View Manor is registered as a for-profit.
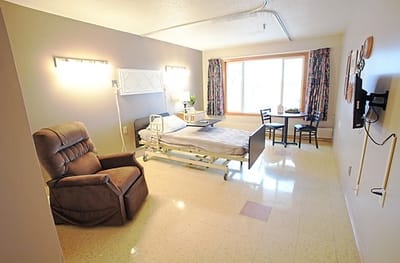
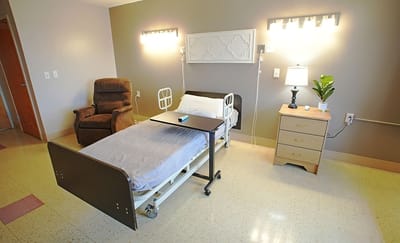
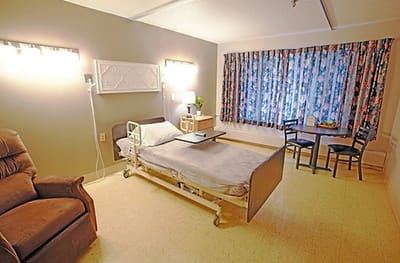
Yes — there are 6 photos of Valley View Manor in the photo gallery on this page.
Valley View Manor is located at 200 9Th Ave W, Lamberton, MN 56152.
Care Cost Calculator: See Prices in Your Area
Nursing Home Data Explorer
Don’t Wait Too Long: 7 Red Flag Signs Your Parent Needs Assisted Living Now
The True Cost of Assisted Living in 2025 – And How Families Are Paying For It
Understanding Senior Living Costs: Pricing Models, Discounts & Financial Assistance


