


Total health inspections
9
Arizona average 6.3
Last Health inspection on Aug 2025
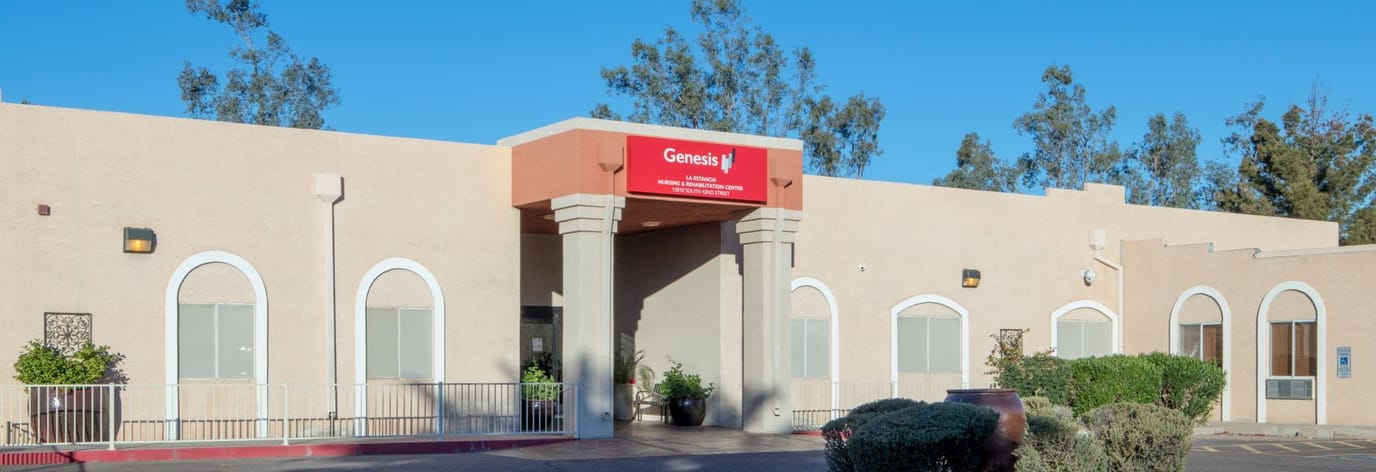
La Estancia Nursing and Rehabilitation Center is a 192-bed, single-story facility in Phoenix’s Ahwatukee Foothills Village neighborhood, 18 years into operation at 15810 S 42nd St. The campus covers nursing home care, assisted living, independent living, and memory care. The Walk Score is 81, which puts the immediate area in genuinely walkable territory for a Phoenix location. The nearest hospital, HonorHealth Tempe Medical Center, is 8.09 miles out.
Occupancy sits at 55.9%, with residents staying an average of 125 days. Total nursing hours run 3 hours and 10 minutes per resident per day. Nurse aides account for 1 hour and 39 minutes; LPNs contribute 1 hour and 3 minutes; registered nurses come in at 12 minutes. That RN figure is the number to pay attention to. An active resident council meets regularly. Medicare, Medicaid, and private pay are all accepted.
Arizona’s Department of Health Services, Bureau of Long Term Care Licensing inspects this facility, and inspection themes have included infection prevention and control, care planning and documentation, and fall and injury prevention.
For families in the south Phoenix and Ahwatukee area looking at a large-footprint facility with full care-level coverage and complete payment flexibility, La Estancia fits that profile.
| Staff type | Hours / Day / Resident | vs state avg |
|---|---|---|
|
Registered Nurse (RN)
| 12m per day | ▼ 71% State avg: 43m per day · National avg: 41m per day |
|
LPN / LVN
| 1h 3m per day | ■ Avg State avg: 1h 3m per day · National avg: 52m per day |
|
Nurse Aide
| 1h 39m per day | ▼ 30% State avg: 2h 22m per day · National avg: 2h 21m per day |
|
Weekend Total Nursing
| 2h 53m per day | ▼ 20% State avg: 3h 38m per day · National avg: 3h 26m per day |
|
Physical Therapist
| 5m per day | ▼ 20% State avg: 6m per day · National avg: 4m per day |
|
Weekend RN
| 18m per day | ▼ 43% State avg: 31m per day · National avg: 29m per day |
Key information about the people who lead and staff this community.
In Arizona, the Department of Health Services, Bureau of Long Term Care Licensing performs regular onsite inspections and investigates complaints for all licensed residential and nursing facilities.
Inspection score unavailable
Not enough inspection history to generate a score.
Average score for Arizona nursing homes: B- 82/100
Deficiencies
| This Facility | AZ Average | vs. AZ Avg |
|---|---|---|---|
|
Total deficiencies
| 79 | 9 | This facility has 778% more total deficiencies than a typical Arizona nursing home (79 vs. AZ avg 9).↑ 778% worse Rank #491 / 500 Total deficiencies — State benchmarked This home is ranked 491st out of 500 homes in Arizona. Shows this facility's deficiencies compared to the Arizona average among 500 comparable communities in the ranking pool. Rankings are based only on facilities in Arizona that report data for that category. Facilities without available data are excluded from the ranking. |
|
Deficiencies per year
| 13.2 | 1.5 | This facility has 780% more deficiencies per year than a typical Arizona nursing home (13.2 vs. AZ avg 1.5).↑ 780% worse |
|
Enforcement actions
| 0 | 0.9 | This facility has 100% fewer enforcement actions than a typical Arizona nursing home (0 vs. AZ avg 0.9).↓ 100% better |
Arizona average 6.3
Last Health inspection on Aug 2025
Arizona average 23.2
Arizona average 3.82
Health citations are formal notices following inspections when they fail to comply with safety and care standards.
29 of 43 citations resulted from standard inspections; 13 of 43 resulted from complaint investigations; and 1 of 43 came from combined inspections (standard and complaint).
Arizona average: 0.1
Arizona average: 0.6
Reporting period: October 1 – December 31, 2025 (Q4 2025). Source: CMS Payroll-Based Journal report.
Manages medical care and health needs.
Assists with medical care and medications.
Helps with daily care and mobility.
Total hours from contractors
2,070 contractor hours this quarter
| Certified Nursing Assistant | 56 | 28 | 84 | 19,781 | 92 | 100% | 9.7 |
| Licensed Practical Nurse | 30 | 44 | 74 | 12,524 | 92 | 100% | 9.4 |
| Registered Nurse | 6 | 0 | 6 | 1,763 | 87 | 95% | 10.2 |
| Physical Therapy Aide | 3 | 0 | 3 | 1,030 | 70 | 76% | 7.4 |
| Speech Language Pathologist | 6 | 0 | 6 | 996 | 70 | 76% | 5.9 |
| Respiratory Therapy Technician | 3 | 0 | 3 | 955 | 70 | 76% | 6.8 |
| Physical Therapy Assistant | 2 | 0 | 2 | 921 | 80 | 87% | 7.4 |
| Other Dietary Services Staff | 2 | 0 | 2 | 900 | 89 | 97% | 7.8 |
| Administrator | 1 | 0 | 1 | 512 | 64 | 70% | 8 |
| Dental Services Staff | 1 | 0 | 1 | 512 | 64 | 70% | 8 |
| Dietitian | 1 | 0 | 1 | 506 | 61 | 66% | 8.3 |
| Nurse Practitioner | 1 | 0 | 1 | 464 | 58 | 63% | 8 |
| Qualified Social Worker | 3 | 0 | 3 | 451 | 68 | 74% | 6.6 |
| Clinical Nurse Specialist | 2 | 0 | 2 | 245 | 31 | 34% | 7.9 |
| Therapeutic Recreation Specialist | 3 | 0 | 3 | 239 | 25 | 27% | 7 |
| Respiratory Therapist | 1 | 0 | 1 | 196 | 22 | 24% | 8.9 |
| Medical Director | 0 | 1 | 1 | 36 | 13 | 14% | 2.8 |
Federal penalties imposed by CMS for regulatory violations, including civil money penalties (fines) and denials of payment for new Medicare/Medicaid admissions.
Source: CMS Penalties Database
No penalties in the past 3 years
No civil money penalties or payment denials were reported in the last 3 years.
These measures show how residents usually do over time at this home, based on health outcomes and preventive care.
Arizona average: 7.6
Arizona average: 16.1
Arizona average: 11.2%
Arizona average: 15.8%
Arizona average: 20.8%
Arizona average: 2.1%
Arizona average: 5.1%
Arizona average: 1.3%
Arizona average: 5.4%
Arizona average: 4.5%
Arizona average: 10.3%
Arizona average: 97.2%
Arizona average: 94.6%
Arizona average: 91.5%
Arizona average: 1.0%
Arizona average: 87.3%
Arizona average: 24.6%
Arizona average: 10.7%
Arizona average: 0.8%
Arizona average: 53.7%
Arizona average: 50.6%
Quality measures are calculated from Minimum Data Set (MDS) assessments. For most measures, lower percentages indicate better care quality.
15% of new residents, usually for short-term rehab.
84% of new residents, often for short stays.
1% of new residents, often for long-term daily care.
Source: CMS Long-Term Care Facility Characteristics (Data as of Jan 2026)
Residents meet regularly to discuss policies, care quality, and activities
Organized group of residents that meets regularly to discuss facility policies, quality of life, and activities.
Data sourced from CMS Long-Term Care Facility Characteristics quarterly report. Payer mix reflects the current resident census by primary payment source.
Historical financial and operational data for La Estancia Nursing and Rehabilitation Center from 2011–2023, based on CMS SNF Cost Reports.
Based on CMS SNF Cost Report for fiscal year ending in 12/2023.
Building Type: Single-story
Residents typically stay for brief periods, with frequent admissions and discharges throughout the year.
Most new residents arrive under private pay (84% of admissions), and a typical private pay stay runs around 4 - 5 months.
Coverage residents most often arrive under.
Coverage residents most often leave under.
![]() 16.3 miles from city center
16.3 miles from city center
![]() Estimated distance in miles from Phoenix's city center to La Estancia Nursing and Rehabilitation Center's address, calculated via Google Maps.
— 8.09 miles to nearest hospital (HonorHealth Tempe Medical Center)
Estimated distance in miles from Phoenix's city center to La Estancia Nursing and Rehabilitation Center's address, calculated via Google Maps.
— 8.09 miles to nearest hospital (HonorHealth Tempe Medical Center)
Add your location
The information below is reported by the Arizona Department of Health Services, Bureau of Long Term Care Licensing.
| Acacia Health Center at Sagewood | NH | Phoenix (Desert Ridge West) | 78 |
96.2%
Facility
96.2%
AZ AVG
72.7%
Rank
#6 / 76 | +32% | 5.51
Facility
5.51
AZ AVG
4.06
Rank
#6 / 71 | +50% | +36% | $0
Facility
$0
AZ AVG
$31.7k
Rank
#1 / 75 | - | 3
Facility
3
AZ AVG
23.2
Rank
#1 / 75 | 3.0
Facility
3.0
AZ AVG
3.8
Rank
#24 / 75 | - | 72 | A+ | 15 | Lcs Desert Ridge LLC | $15.2M
Facility
$15.2M
AZ AVG
$14.7M
Rank
#2 / 79 | $20.0M
Facility
$20.0M
AZ AVG
$6.4M
Rank
#3 / 79 | 131.9%
Facility
131.9%
AZ AVG
48.1%
Rank
#71 / 79 | 35279 | ||||
| Desert Terrace Healthcare Center | NH MC | Phoenix (Encanto Village) | 108 |
75.9%
Facility
75.9%
AZ AVG
72.7%
Rank
#33 / 76 | +4% | 3.90
Facility
3.90
AZ AVG
4.06
Rank
#35 / 71 | -22% | -4% | $1.3k
Facility
$1.3k
AZ AVG
$31.7k
Rank
#55 / 75 | 67
Facility
67
AZ AVG
82
Rank
#40 / 53 | 24
Facility
24
AZ AVG
23.2
Rank
#41 / 75 | 3.4
Facility
3.4
AZ AVG
3.8
Rank
#33 / 75 | - | 87 | C+ | 67 | Bandera Healthcare LLC | $11.5M
Facility
$11.5M
AZ AVG
$14.7M
Rank
#56 / 79 | $6.0M
Facility
$6.0M
AZ AVG
$6.4M
Rank
#45 / 79 | 52.3%
Facility
52.3%
AZ AVG
48.1%
Rank
#19 / 79 | 35014 | ||||
| La Estancia Nursing and Rehabilitation Center | NH AL IL MC | Phoenix (Ahwatukee Foothills Village) | 192 |
46.4%
Facility
46.4%
AZ AVG
72.7%
Rank
#63 / 76 | -36% | 3.17
Facility
3.17
AZ AVG
4.06
Rank
#63 / 71 | -69% | -22% | $0
Facility
$0
AZ AVG
$31.7k
Rank
#1 / 75 | - | 43
Facility
43
AZ AVG
23.2
Rank
#67 / 75 | 4.8
Facility
4.8
AZ AVG
3.8
Rank
#56 / 75 | - | 89 | A+ | 81 | Waqas Qamar | $3.4M
Facility
$3.4M
AZ AVG
$14.7M
Rank
#78 / 79 | $2.3M
Facility
$2.3M
AZ AVG
$6.4M
Rank
#78 / 79 | 69.7%
Facility
69.7%
AZ AVG
48.1%
Rank
#43 / 79 | 35270 | ||||
| Phoenix Mountain Post-Acute | NH MC | Phoenix (Paradise Valley Village) | 130 |
80.0%
Facility
80.0%
AZ AVG
72.7%
Rank
#29 / 76 | +10% | 3.62
Facility
3.62
AZ AVG
4.06
Rank
#47 / 71 | -4% | -11% | $8.0k
Facility
$8.0k
AZ AVG
$31.7k
Rank
#60 / 75 | 65
Facility
65
AZ AVG
82
Rank
#42 / 53 | 30
Facility
30
AZ AVG
23.2
Rank
#53 / 75 | 5.0
Facility
5.0
AZ AVG
3.8
Rank
#58 / 75 | 2 | 112 | A+ | 67 | Phoenix Mountain Post Acute | $16.7M
Facility
$16.7M
AZ AVG
$14.7M
Rank
#28 / 79 | $9.0M
Facility
$9.0M
AZ AVG
$6.4M
Rank
#26 / 79 | 53.9%
Facility
53.9%
AZ AVG
48.1%
Rank
#28 / 79 | 35072 | ||||
| Haven Health Sky Harbor | NH | Phoenix (Montezuma Heights) | 120 |
66.7%
Facility
66.7%
AZ AVG
72.7%
Rank
#45 / 76 | -8% | 2.89
Facility
2.89
AZ AVG
4.06
Rank
#68 / 71 | -25% | -29% | $0
Facility
$0
AZ AVG
$31.7k
Rank
#1 / 75 | 64
Facility
64
AZ AVG
82
Rank
#44 / 53 | 46
Facility
46
AZ AVG
23.2
Rank
#69 / 75 | 4.2
Facility
4.2
AZ AVG
3.8
Rank
#45 / 75 | 1 | 80 | - | 60 | Brigham Curran | $5.0M
Facility
$5.0M
AZ AVG
$14.7M
Rank
#72 / 79 | $4.2M
Facility
$4.2M
AZ AVG
$6.4M
Rank
#71 / 79 | 84.3%
Facility
84.3%
AZ AVG
48.1%
Rank
#39 / 79 | 35290 |
La Estancia Nursing and Rehabilitation Center is located in Phoenix, Arizona.
Here are the financial assistance programs available to residents in Arizona.
La Estancia Nursing and Rehabilitation Center is in the Ahwatukee Foothills Village neighborhood of Phoenix.
La Estancia Nursing and Rehabilitation Center has a walk score of 81. Very walkable. Most errands can be accomplished on foot, and many essentials are within a short walk.
La Estancia Nursing and Rehabilitation Center's occupancy is 55.9%.
La Estancia Nursing and Rehabilitation Center is registered as a for-profit in AZ.
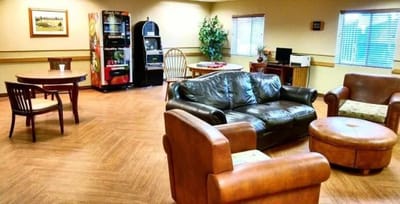
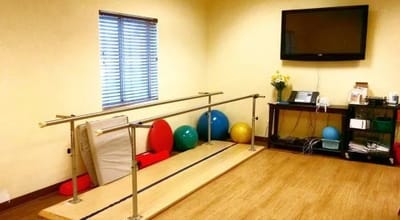
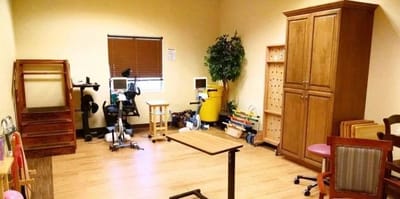
Yes — there are 5 photos of La Estancia Nursing and Rehabilitation Center in the photo gallery on this page.
La Estancia Nursing and Rehabilitation Center is located at 15810 S 42Nd St, Phoenix, AZ 85048.
(480) 759-0358 will put you in contact with the team at La Estancia Nursing and Rehabilitation Center.
Care Cost Calculator: See Prices in Your Area
Nursing Home Data Explorer
Don’t Wait Too Long: 7 Red Flag Signs Your Parent Needs Assisted Living Now
The True Cost of Assisted Living in 2025 – And How Families Are Paying For It
Understanding Senior Living Costs: Pricing Models, Discounts & Financial Assistance


