Compare Senior Care around Maryland
Info below is compiled from the MD Dept. of Health (OHCQ), senior community websites & trusted data sources such as Walk Score & BBB.
Communities are listed from highest to lowest based on our ranking methodology.
| Bedford Court, a CCRC | SC AL HOS IL MC NH RC SNF | Silver Spring (International Drive) | 76
Facility
76
MD AVG
42
Rank
#174 / 685 | Yes |
64
Facility
64
MD AVG
43
Rank
#261 / 985 | Studio / 1 Bed | 34
Facility
34
MD AVG
21
Rank
#22 / 210 | - |
15% Male Residents — State Benchmarked 15% of residents are male, compared to the Maryland average of 31%. This facility caters to a majority female resident pool (85% female), consistent with the broader assisted living trend where women significantly outnumber men. |
85% Female Residents — State Benchmarked 85% of residents are female, compared to the Maryland average of 69%. Women comprise the large majority, consistent with national assisted living demographics where women live longer and enter care facilities at higher rates. |
95% White Residents — State Benchmarked 95% of residents are reported as White, compared to the Maryland average of 81%. A higher White share than is typical for assisted living in Maryland in this dataset — compare with peer facilities for local context. |
3% African American Residents — State Benchmarked 3% of residents are reported as African American or Black, compared to the Maryland average of 13%. A lower African American share than is typical in Maryland; local markets still vary widely. |
2% Other Ethnicity Residents — State Benchmarked 2% of residents fall into categories other than White or African American (combined), compared to the Maryland average of 6%. This column aggregates Hispanic, Asian, multiracial, and any other labeled groups that are not classified as White or African American. Reported subgroups in this total: Asian (2%). |
2% Residents Age 65–74 — State Benchmarked 2% of residents are 65–74, compared to the Maryland average of 13%. Fewer younger seniors suggests the resident population skews older, likely requiring higher acuity care and more hands-on support. |
8% Residents Age 75–84 — State Benchmarked 8% of residents are 75–84, compared to the Maryland average of 31%. Below the state norm — the resident mix may skew either younger or older than this typical middle bracket. |
65% Residents Age 85–94 — State Benchmarked 65% of residents are 85–94, compared to the Maryland average of 44%. A high concentration of very elderly residents signals a higher-acuity facility with experience caring for advanced age-related needs. |
26% Residents Age 95+ — State Benchmarked 26% of residents are 95 or older, compared to the Maryland average of 16%. A high proportion of the oldest-old suggests strong end-of-life care experience and very-high-acuity capabilities. |
| Edenwald Senior Living | SC AL IL MC NH SNF | Towson (Southerly Road) | 94
Facility
94
MD AVG
42
Rank
#139 / 685 | No |
83
Facility
83
MD AVG
43
Rank
#70 / 985 | 1 Bed / 2 Bed | - | A+ |
18% Male Residents — State Benchmarked 18% of residents are male, compared to the Maryland average of 31%. This facility caters to a majority female resident pool (82% female), consistent with the broader assisted living trend where women significantly outnumber men. |
82% Female Residents — State Benchmarked 82% of residents are female, compared to the Maryland average of 69%. Women comprise the large majority, consistent with national assisted living demographics where women live longer and enter care facilities at higher rates. |
100% White Residents — State Benchmarked 100% of residents are reported as White, compared to the Maryland average of 81%. A higher White share than is typical for assisted living in Maryland in this dataset — compare with peer facilities for local context. |
0% African American Residents — State Benchmarked 0% of residents are reported as African American or Black, compared to the Maryland average of 13%. A lower African American share than is typical in Maryland; local markets still vary widely. |
0% Other Ethnicity Residents — State Benchmarked 0% of residents fall into categories other than White or African American (combined), compared to the Maryland average of 6%. This column aggregates Hispanic, Asian, multiracial, and any other labeled groups that are not classified as White or African American. | - |
13% Residents Age 75–84 — State Benchmarked 13% of residents are 75–84, compared to the Maryland average of 31%. Below the state norm — the resident mix may skew either younger or older than this typical middle bracket. |
53% Residents Age 85–94 — State Benchmarked 53% of residents are 85–94, compared to the Maryland average of 44%. A high concentration of very elderly residents signals a higher-acuity facility with experience caring for advanced age-related needs. |
35% Residents Age 95+ — State Benchmarked 35% of residents are 95 or older, compared to the Maryland average of 16%. A high proportion of the oldest-old suggests strong end-of-life care experience and very-high-acuity capabilities. |
| Lutheran Village at Miller’s Grant | SC AL IL NH SNF | Ellicott City (Lutheran Village At Miller’s Grant) | 36
Facility
36
MD AVG
42
Rank
#230 / 685 | Yes |
19
Facility
19
MD AVG
43
Rank
#746 / 985 | 1 Bed / 2 Bed | 21
Facility
21
MD AVG
21
Rank
#108 / 210 | - |
17% Male Residents — State Benchmarked 17% of residents are male, compared to the Maryland average of 31%. This facility caters to a majority female resident pool (83% female), consistent with the broader assisted living trend where women significantly outnumber men. |
83% Female Residents — State Benchmarked 83% of residents are female, compared to the Maryland average of 69%. Women comprise the large majority, consistent with national assisted living demographics where women live longer and enter care facilities at higher rates. |
83% White Residents — State Benchmarked 83% of residents are reported as White, compared to the Maryland average of 81%. Close to the average for this category among assisted living facilities in Maryland with reported race/ethnicity data. |
11% African American Residents — State Benchmarked 11% of residents are reported as African American or Black, compared to the Maryland average of 13%. In line with the Maryland average for African American residents among facilities reporting this breakdown. |
6% Other Ethnicity Residents — State Benchmarked 6% of residents fall into categories other than White or African American (combined), compared to the Maryland average of 6%. This column aggregates Hispanic, Asian, multiracial, and any other labeled groups that are not classified as White or African American. Reported subgroups in this total: Asian (6%). | - |
33% Residents Age 75–84 — State Benchmarked 33% of residents are 75–84, compared to the Maryland average of 31%. This is the second most common age bracket in assisted living, representing residents with moderate care needs. |
44% Residents Age 85–94 — State Benchmarked 44% of residents are 85–94, compared to the Maryland average of 44%. This is typically the most common age bracket in assisted living — this facility is in line with the statewide norm. |
22% Residents Age 95+ — State Benchmarked 22% of residents are 95 or older, compared to the Maryland average of 16%. A high proportion of the oldest-old suggests strong end-of-life care experience and very-high-acuity capabilities. |
| Friends House Retirement Community | SC AL IL NH SNF | Sandy Spring | 24
Facility
24
MD AVG
42
Rank
#242 / 685 | Yes |
6
Facility
6
MD AVG
43
Rank
#891 / 985 | - | 20
Facility
20
MD AVG
21
Rank
#112 / 210 | - |
6% Male Residents — State Benchmarked 6% of residents are male, compared to the Maryland average of 31%. This facility caters to a majority female resident pool (94% female), consistent with the broader assisted living trend where women significantly outnumber men. |
94% Female Residents — State Benchmarked 94% of residents are female, compared to the Maryland average of 69%. Women comprise the large majority, consistent with national assisted living demographics where women live longer and enter care facilities at higher rates. |
94% White Residents — State Benchmarked 94% of residents are reported as White, compared to the Maryland average of 81%. A higher White share than is typical for assisted living in Maryland in this dataset — compare with peer facilities for local context. |
0% African American Residents — State Benchmarked 0% of residents are reported as African American or Black, compared to the Maryland average of 13%. A lower African American share than is typical in Maryland; local markets still vary widely. |
6% Other Ethnicity Residents — State Benchmarked 6% of residents fall into categories other than White or African American (combined), compared to the Maryland average of 6%. This column aggregates Hispanic, Asian, multiracial, and any other labeled groups that are not classified as White or African American. Reported subgroups in this total: Asian (6%). |
6% Residents Age 65–74 — State Benchmarked 6% of residents are 65–74, compared to the Maryland average of 13%. Fewer younger seniors suggests the resident population skews older, likely requiring higher acuity care and more hands-on support. |
18% Residents Age 75–84 — State Benchmarked 18% of residents are 75–84, compared to the Maryland average of 31%. Below the state norm — the resident mix may skew either younger or older than this typical middle bracket. |
53% Residents Age 85–94 — State Benchmarked 53% of residents are 85–94, compared to the Maryland average of 44%. A high concentration of very elderly residents signals a higher-acuity facility with experience caring for advanced age-related needs. |
24% Residents Age 95+ — State Benchmarked 24% of residents are 95 or older, compared to the Maryland average of 16%. A high proportion of the oldest-old suggests strong end-of-life care experience and very-high-acuity capabilities. |
| Sunrise of Rockville | SC AL HOS MC | Rockville (Baltimore Road) | 89
Facility
89
MD AVG
42
Rank
#150 / 685 | Yes |
89
Facility
89
MD AVG
43
Rank
#32 / 985 | Studio / 1 Bed / 2 Bed | 45
Facility
45
MD AVG
21
Rank
#4 / 210 | A- |
23% Male Residents — State Benchmarked 23% of residents are male, compared to the Maryland average of 31%. This facility caters to a majority female resident pool (77% female), consistent with the broader assisted living trend where women significantly outnumber men. |
77% Female Residents — State Benchmarked 77% of residents are female, compared to the Maryland average of 69%. Women comprise the large majority, consistent with national assisted living demographics where women live longer and enter care facilities at higher rates. |
87% White Residents — State Benchmarked 87% of residents are reported as White, compared to the Maryland average of 81%. Close to the average for this category among assisted living facilities in Maryland with reported race/ethnicity data. |
2% African American Residents — State Benchmarked 2% of residents are reported as African American or Black, compared to the Maryland average of 13%. A lower African American share than is typical in Maryland; local markets still vary widely. |
11% Other Ethnicity Residents — State Benchmarked 11% of residents fall into categories other than White or African American (combined), compared to the Maryland average of 6%. This column aggregates Hispanic, Asian, multiracial, and any other labeled groups that are not classified as White or African American. Reported subgroups in this total: Mixed Race (6%), Hispanic (3%), Asian (2%). |
3% Residents Age 65–74 — State Benchmarked 3% of residents are 65–74, compared to the Maryland average of 13%. Fewer younger seniors suggests the resident population skews older, likely requiring higher acuity care and more hands-on support. |
31% Residents Age 75–84 — State Benchmarked 31% of residents are 75–84, compared to the Maryland average of 31%. This is the second most common age bracket in assisted living, representing residents with moderate care needs. |
56% Residents Age 85–94 — State Benchmarked 56% of residents are 85–94, compared to the Maryland average of 44%. A high concentration of very elderly residents signals a higher-acuity facility with experience caring for advanced age-related needs. |
10% Residents Age 95+ — State Benchmarked 10% of residents are 95 or older, compared to the Maryland average of 16%. Most residents here have not yet reached the oldest-old bracket, suggesting a younger overall community. |
| Maplewood Park Place | SC AL IL MC NH SNF | Bethesda (Pooks Hill) | 29
Facility
29
MD AVG
42
Rank
#240 / 685 | Yes |
38
Facility
38
MD AVG
43
Rank
#542 / 985 | 1 Bed / 2 Bed | 30
Facility
30
MD AVG
21
Rank
#44 / 210 | - |
18% Male Residents — State Benchmarked 18% of residents are male, compared to the Maryland average of 31%. This facility caters to a majority female resident pool (82% female), consistent with the broader assisted living trend where women significantly outnumber men. |
82% Female Residents — State Benchmarked 82% of residents are female, compared to the Maryland average of 69%. Women comprise the large majority, consistent with national assisted living demographics where women live longer and enter care facilities at higher rates. |
100% White Residents — State Benchmarked 100% of residents are reported as White, compared to the Maryland average of 81%. A higher White share than is typical for assisted living in Maryland in this dataset — compare with peer facilities for local context. |
0% African American Residents — State Benchmarked 0% of residents are reported as African American or Black, compared to the Maryland average of 13%. A lower African American share than is typical in Maryland; local markets still vary widely. |
0% Other Ethnicity Residents — State Benchmarked 0% of residents fall into categories other than White or African American (combined), compared to the Maryland average of 6%. This column aggregates Hispanic, Asian, multiracial, and any other labeled groups that are not classified as White or African American. | - |
6% Residents Age 75–84 — State Benchmarked 6% of residents are 75–84, compared to the Maryland average of 31%. Below the state norm — the resident mix may skew either younger or older than this typical middle bracket. |
24% Residents Age 85–94 — State Benchmarked 24% of residents are 85–94, compared to the Maryland average of 44%. The population here skews younger than the statewide norm, which may indicate a more active, lower-acuity community. |
71% Residents Age 95+ — State Benchmarked 71% of residents are 95 or older, compared to the Maryland average of 16%. A high proportion of the oldest-old suggests strong end-of-life care experience and very-high-acuity capabilities. |
| Ingleside at King Farm | SC AL IL MC NH SNF | Rockville (King Farm) | 45
Facility
45
MD AVG
42
Rank
#219 / 685 | Yes |
73
Facility
73
MD AVG
43
Rank
#152 / 985 | 1 Bed / 2 Bed | - | - | - | - | - | - | - | - | - | - | - |
| Homewood Living Frederick | SC AL IL MC NH SNF | Frederick | 120
Facility
120
MD AVG
42
Rank
#73 / 685 | Yes |
14
Facility
14
MD AVG
43
Rank
#788 / 985 | 1 Bed / 2 Bed | - | - | - | - | - | - | - | - | - | - | - |
| Residences at Vantage Point | SC AL HC IL MC NH SNF | Columbia (Town Center) | 44
Facility
44
MD AVG
42
Rank
#222 / 685 | Yes |
52
Facility
52
MD AVG
43
Rank
#402 / 985 | Studio / 1 Bed / 2 Bed | 36
Facility
36
MD AVG
21
Rank
#16 / 210 | - | - | - | - | - | - | - | - | - | - |
| Buckingham‘s Choice | SC AL MC NH RC SNF | Adamstown (Baker Circle) | 42
Facility
42
MD AVG
42
Rank
#223 / 685 | No |
3
Facility
3
MD AVG
43
Rank
#930 / 985 | Private Rooms | 31
Facility
31
MD AVG
21
Rank
#39 / 210 | - | - | - | - | - | - | - | - | - | - |
| Sunrise of Pikesville | SC NH AL HOS MC | Pikesville (Old Court Road) | 96
Facility
96
MD AVG
42
Rank
#131 / 685 | Yes |
75
Facility
75
MD AVG
43
Rank
#131 / 985 | Studio / 1 Bed / 2 Bed | 45
Facility
45
MD AVG
21
Rank
#4 / 210 | A- |
30% Male Residents — State Benchmarked 30% of residents are male, compared to the Maryland average of 31%. This facility caters to a majority female resident pool (70% female), consistent with the broader assisted living trend where women significantly outnumber men. |
70% Female Residents — State Benchmarked 70% of residents are female, compared to the Maryland average of 69%. Women comprise the large majority, consistent with national assisted living demographics where women live longer and enter care facilities at higher rates. |
63% White Residents — State Benchmarked 63% of residents are reported as White, compared to the Maryland average of 81%. A lower White share than the Maryland average — the community may draw a more diverse resident mix relative to other facilities in Maryland. |
37% African American Residents — State Benchmarked 37% of residents are reported as African American or Black, compared to the Maryland average of 13%. A higher African American share than the typical Maryland average — useful context when comparing cultural fit and community composition. |
0% Other Ethnicity Residents — State Benchmarked 0% of residents fall into categories other than White or African American (combined), compared to the Maryland average of 6%. This column aggregates Hispanic, Asian, multiracial, and any other labeled groups that are not classified as White or African American. |
15% Residents Age 65–74 — State Benchmarked 15% of residents are 65–74, compared to the Maryland average of 13%. In line with the statewide profile for this youngest senior bracket in assisted living. |
27% Residents Age 75–84 — State Benchmarked 27% of residents are 75–84, compared to the Maryland average of 31%. This is the second most common age bracket in assisted living, representing residents with moderate care needs. |
41% Residents Age 85–94 — State Benchmarked 41% of residents are 85–94, compared to the Maryland average of 44%. This is typically the most common age bracket in assisted living — this facility is in line with the statewide norm. |
15% Residents Age 95+ — State Benchmarked 15% of residents are 95 or older, compared to the Maryland average of 16%. In line with the statewide profile for the oldest resident bracket. |
| Brighton Gardens of Friendship Heights | SC AL HOS MC | Chevy Chase (Friendship Boulevard) | 154
Facility
154
MD AVG
42
Rank
#39 / 685 | Yes |
86
Facility
86
MD AVG
43
Rank
#47 / 985 | Studio / 1 Bed / 2 Bed | 29
Facility
29
MD AVG
21
Rank
#48 / 210 | - |
20% Male Residents — State Benchmarked 20% of residents are male, compared to the Maryland average of 31%. This facility caters to a majority female resident pool (80% female), consistent with the broader assisted living trend where women significantly outnumber men. |
80% Female Residents — State Benchmarked 80% of residents are female, compared to the Maryland average of 69%. Women comprise the large majority, consistent with national assisted living demographics where women live longer and enter care facilities at higher rates. |
96% White Residents — State Benchmarked 96% of residents are reported as White, compared to the Maryland average of 81%. A higher White share than is typical for assisted living in Maryland in this dataset — compare with peer facilities for local context. |
1% African American Residents — State Benchmarked 1% of residents are reported as African American or Black, compared to the Maryland average of 13%. A lower African American share than is typical in Maryland; local markets still vary widely. |
3% Other Ethnicity Residents — State Benchmarked 3% of residents fall into categories other than White or African American (combined), compared to the Maryland average of 6%. This column aggregates Hispanic, Asian, multiracial, and any other labeled groups that are not classified as White or African American. Reported subgroups in this total: Asian (2%), Hispanic (1%). |
3% Residents Age 65–74 — State Benchmarked 3% of residents are 65–74, compared to the Maryland average of 13%. Fewer younger seniors suggests the resident population skews older, likely requiring higher acuity care and more hands-on support. |
31% Residents Age 75–84 — State Benchmarked 31% of residents are 75–84, compared to the Maryland average of 31%. This is the second most common age bracket in assisted living, representing residents with moderate care needs. |
49% Residents Age 85–94 — State Benchmarked 49% of residents are 85–94, compared to the Maryland average of 44%. A high concentration of very elderly residents signals a higher-acuity facility with experience caring for advanced age-related needs. |
15% Residents Age 95+ — State Benchmarked 15% of residents are 95 or older, compared to the Maryland average of 16%. In line with the statewide profile for the oldest resident bracket. |
| Sunrise of Frederick | SC AL MC | Frederick (Waterford) | 88
Facility
88
MD AVG
42
Rank
#152 / 685 | Yes |
62
Facility
62
MD AVG
43
Rank
#286 / 985 | Studio / Suite / 2 Bed | 45
Facility
45
MD AVG
21
Rank
#4 / 210 | A- |
31% Male Residents — State Benchmarked 31% of residents are male, compared to the Maryland average of 31%. This facility caters to a majority female resident pool (69% female), consistent with the broader assisted living trend where women significantly outnumber men. |
69% Female Residents — State Benchmarked 69% of residents are female, compared to the Maryland average of 69%. Women comprise the large majority, consistent with national assisted living demographics where women live longer and enter care facilities at higher rates. |
97% White Residents — State Benchmarked 97% of residents are reported as White, compared to the Maryland average of 81%. A higher White share than is typical for assisted living in Maryland in this dataset — compare with peer facilities for local context. |
2% African American Residents — State Benchmarked 2% of residents are reported as African American or Black, compared to the Maryland average of 13%. A lower African American share than is typical in Maryland; local markets still vary widely. |
2% Other Ethnicity Residents — State Benchmarked 2% of residents fall into categories other than White or African American (combined), compared to the Maryland average of 6%. This column aggregates Hispanic, Asian, multiracial, and any other labeled groups that are not classified as White or African American. Reported subgroups in this total: Hispanic (2%). |
10% Residents Age 65–74 — State Benchmarked 10% of residents are 65–74, compared to the Maryland average of 13%. Fewer younger seniors suggests the resident population skews older, likely requiring higher acuity care and more hands-on support. |
34% Residents Age 75–84 — State Benchmarked 34% of residents are 75–84, compared to the Maryland average of 31%. This is the second most common age bracket in assisted living, representing residents with moderate care needs. |
48% Residents Age 85–94 — State Benchmarked 48% of residents are 85–94, compared to the Maryland average of 44%. This is typically the most common age bracket in assisted living — this facility is in line with the statewide norm. |
6% Residents Age 95+ — State Benchmarked 6% of residents are 95 or older, compared to the Maryland average of 16%. Most residents here have not yet reached the oldest-old bracket, suggesting a younger overall community. |
| Autumn Lake Healthcare at Riverview | SC HOS NH PC RC SNF | Essex | 238
Facility
238
MD AVG
42
Rank
#5 / 685 | No |
61
Facility
61
MD AVG
43
Rank
#301 / 985 | - | - | - | - | - | - | - | - | - | - | - | - |
| Sterling Care Hillhaven Assisted Living and Memory Care | SC AL HOS MC NH SNF | Adelphi (Knollwood) | 66
Facility
66
MD AVG
42
Rank
#188 / 685 | No |
25
Facility
25
MD AVG
43
Rank
#684 / 985 | Studio / 1 Bed | - | - | - | - | - | - | - | - | - | - | - |
Since 1924, Seabury at Springvale Terrace has been part of the Springvale Road neighborhood in Silver Spring, Maryland, giving it a longer history than most senior living communities in the area. The two-story building is among the most walkable pockets of Silver Spring, with a Walk Score of 92 that puts daily errands within easy reach on foot. It’s also close to the town center, less than a mile away, so it’s convenient for visiting families.
Occupants live in private rooms and can access a library, a TV lounge, a hair salon, and a wellness center. The community offers transportation services along with fitness and recreation space, and it welcomes pets. Dining is built to handle an array of dietary needs, so residents with specific requirements have options at mealtime. The home is set apart by its programming for specific communities: it offers explicit programming for LGBTQIA+ occupants and older adults with visual impairments. Many senior living communities don’t formally address either group, worth noting for families where that kind of tailored support is prioritized.
Families should confirm directly with Seabury at Springvale Terrace what level of everyday support is available.
Offering personal care, The Kensington in Cumberland is an assisted living community in Cumberland, Maryland. It has a variety of studio, one-bedroom, and two-bedroom residences in a mid-rise setting.
24-hour security and staffing are offered, complemented by RN-supervised care. Home-cooked meals, housekeeping, laundry, and utilities are also provided, as well as emergency call systems. On-site salon, gathering rooms, a wellness office, a game room, and exercise equipment are available.
Set in a highly walkable neighborhood with a Walk Score of 92, the community allows residents and visiting families to accomplish most daily errands on foot while enjoying convenient access to nearby amenities.
Linden Park Apartments sits in Bolton Hill, Baltimore’s cultural district, about 2.0 miles from downtown. It’s a high-rise, and it’s built specifically for adults 62 and up who want their own space without needing daily help or medical care built in. The Walk Score here is 87, so it’s very walkable and most errands don’t require a car.
Apartments come in three sizes: studios around 400 square feet, one-bedrooms at 525, two-bedrooms at 801, several with city views thrown in. Downstairs and around the building, there’s a fitness center, a computer lounge, and a billiards room, so there’s somewhere to go that isn’t just your own unit. Transportation services exist too, for anyone who wants to get around the city without driving themselves everywhere.
Something breaks at 2am? There’s 24-hour emergency maintenance for that, plus on-site management during regular hours. It’s the kind of infrastructure that matters more than people expect until they actually need it. Pets are welcome here too, which rules out one common reason people hesitate before downsizing.
Here’s the thing about independent living specifically: no medical care, no nursing staff, none of that. This is for people who are still fully capable of running their own lives and just want less of the maintenance and more of the community built in. Linden Park Apartments reads like exactly that kind of setup: apartment living with amenities and support infrastructure layered underneath it, in a genuinely walkable pocket of the city.
Charter Senior Living of Annapolis operates a 64-bed memory care community in Annapolis, Maryland, serving residents with Alzheimer’s disease and other dementias. The facility, which has been in operation for 25 years, is licensed as assisted living and is not Medicare or Medicaid certified. It is managed by Executive Director Susan Maupin.
The community delivers 17 documented services concentrated on dementia-specific care and daily living support. Clinical and therapeutic services include physical, occupational, and speech therapy. A dedicated secure Alzheimer’s unit houses residents across three defined care levels reflecting disease progression: mild, moderate, and severe. Staffing operates on a 24-hour awake model. Medical support encompasses catheter care, colostomy care, pressure ulcer management, portable oxygen provision, and on-site medication dispensing.
Home health agency services operate within the facility.
Barber and beauty services, complete laundry management, housekeeping, and three daily meals round out the service portfolio.
Behavioral management and individualized care planning are documented care emphases. The Flourish™ program structures daily activity and cognitive engagement. Lifestyle programming includes scheduled social and recreational activities. Respite care accommodates short-term admissions, enabling family caregivers to take breaks while residents remain in structured, secure environments.
Resident composition at Charter reflects demographic characteristics unusual for assisted living. The gender split is 50% male and 50% female; which is substantially higher male representation than the 31% Maryland average for memory care facilities. Age distribution concentrates at the oldest brackets: 45% are 75–84, and 40% are 85–94, reflecting the advanced age-related needs typical of dementia-focused communities. Racial and ethnic composition stands at 75% White, 20% African American, and 5% Asian, with African American residents represented at rates significantly higher than state averages.
Monthly pricing: shared suites at $7,750; private rooms at $9,795. Pet-friendly policies apply. Visitors are welcome around the clock.
Single-story construction with studio-style accommodations. A minimum age of 62 applies to admission. The secured perimeter environment addresses wandering risk and safety for residents with cognitive impairment.
The facility sits 6.2 miles from central Annapolis with a Walk Score of 16, requiring automobile transportation for most activities.
Charter Senior Living of Annapolis is structured for individuals in middle to advanced dementia stages seeking specialized memory care with behavioral support, therapeutic services, and family-inclusive respite options within a long-established community setting.
Overlooking the beautiful area of Nottingham, MD, Brightview Perry Hall is an elegant senior living community that offers Independent living, assisted living, and memory care. Live life on your terms at the beautifully designed apartments, with a wide selection of studios, companion, or one or two-bedroom homes to choose from. A dedicated team is on duty 24/7 to ensure residents are safe and secure at all times. Housekeeping, maintenance, and transportation services are offered to free residents from the common stressors of daily living.
Daily programs, outings, and cultural events are conducted to provide residents plenty of opportunities for learning new skills, making new friends, or getting entertained. Three chef-prepared meals are prepared daily to make sure residents are always full and happy. Resort-style amenities include comfortable conversation areas, a courtyard with fire pit, an arts, crafts and hobbies room, well-curated library, salon, a movie theater, and an upscale pub with billiards and TV.
Brightview Rolling Hills is an assisted living and memory care community located in the College Hills neighborhood of Catonsville, Maryland. With over 8 years of operation, the community offers 81 residences with studio, one-bedroom, and two-bedroom floor plans within a three-story building. Private accommodations start at $250 per day.
Through Wellspring Village, a specialized memory care program with separate care approaches for mild, moderate, and advanced stages of the condition, the community provides cognitive support for those living with Alzheimer’s and dementia. The community also maintains 24-hour staffing and security-controlled entrances to promote safety and support. Furthermore, it has also received recognition as a Best Workplace in Aging Services and was included on U.S. News & World Report’s 2025 Best Senior Living list. Pet-friendly policies and transportation services are available as well.
A variety of amenities contribute to daily comfort and engagement, including a fitness center, arts and crafts space, spa and massage room, private dining rooms for special gatherings, concierge services, and resident parking.
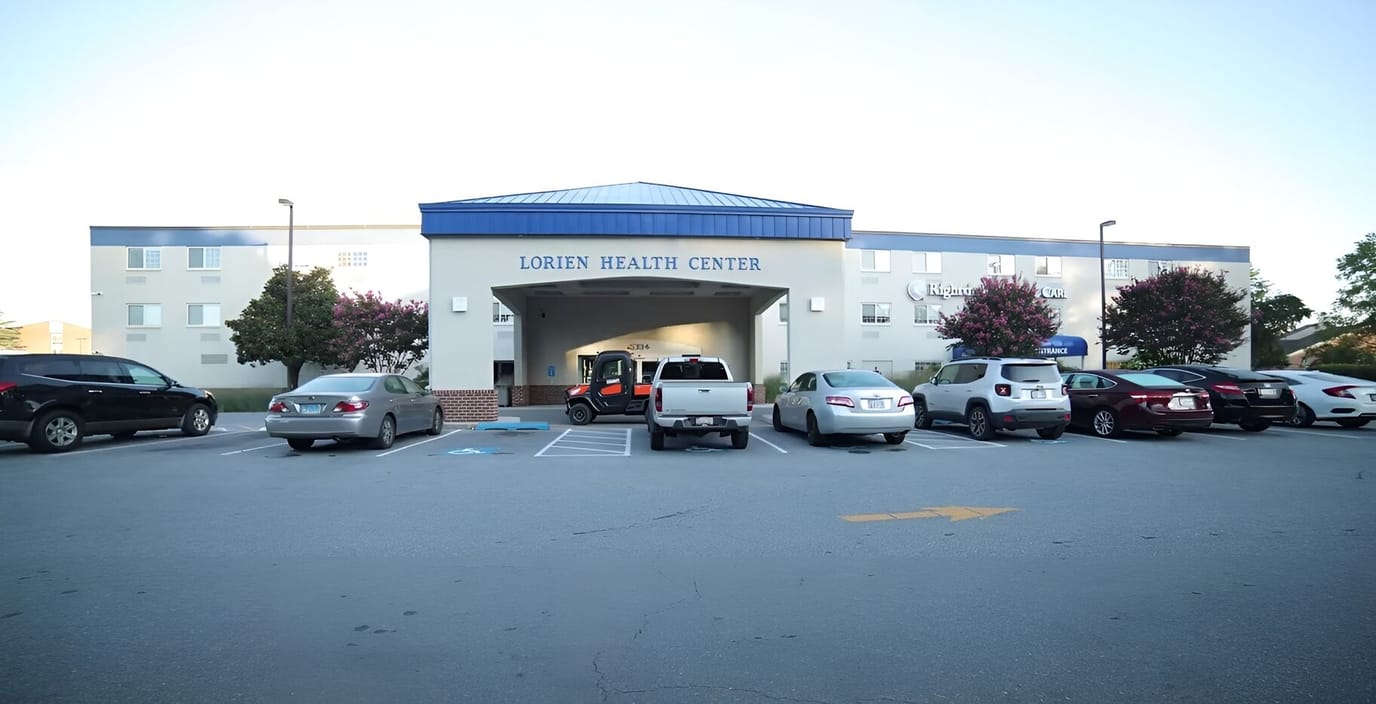
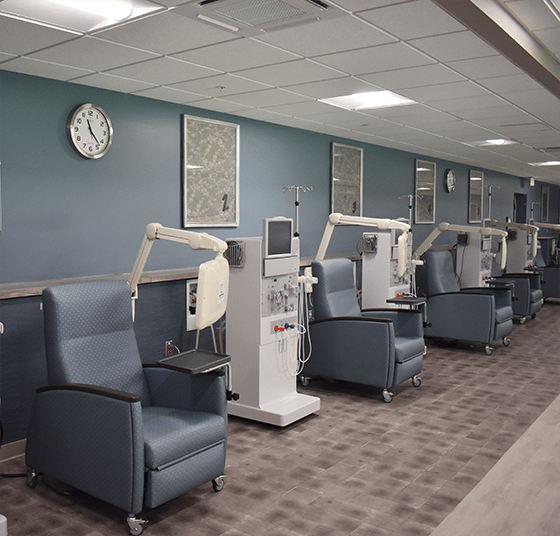
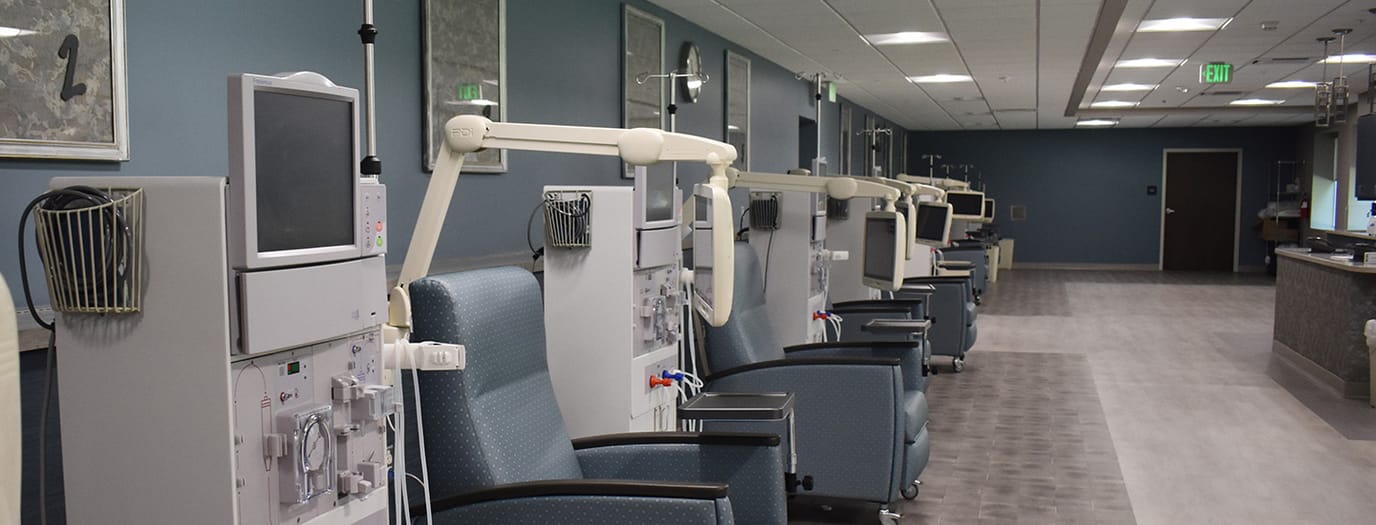
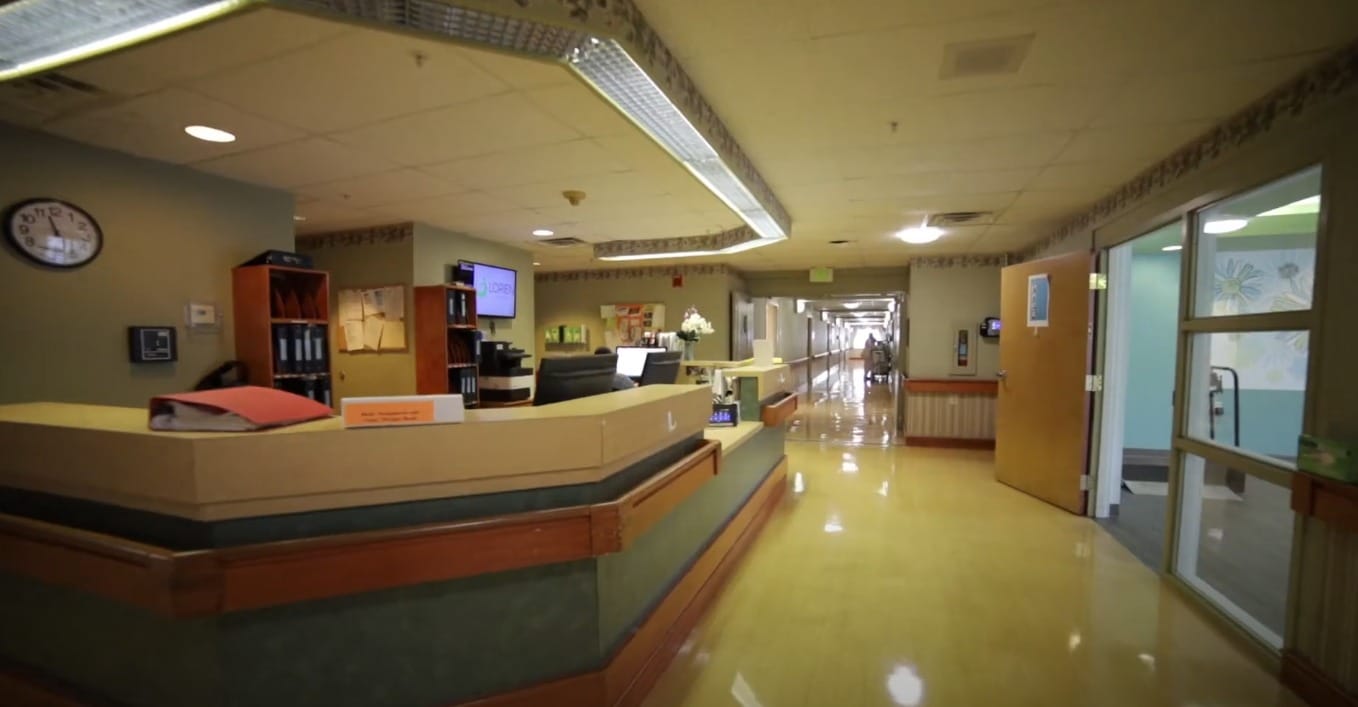
Located in Ellicott City, Maryland, Lorien Encore at Turf Valley is a skilled nursing and rehabilitation center set in a suburban, car-dependent location near Maryland Route 29. The community has been operating for 16 years and is owned by Jim Hummer. With 110 beds, it accepts Medicare, Medicaid, and private pay, giving families several ways to cover short-term rehabilitation stays and longer-term skilled nursing care.
The community’s clinical focus is on rehabilitation and skilled nursing. Total nurse staffing averages 3 hours and 44 minutes per resident each day; this level of staffing is robust enough to support hands-on care for post-acute patients. The home’s level of support makes it suitable for patients recovering from surgery or hospitalization, or for those managing a chronic condition requiring skilled oversight. Residents stay an average of 66 days, including a population that skews toward shorter-term rehabilitation and transitional care rather than long-term residence.
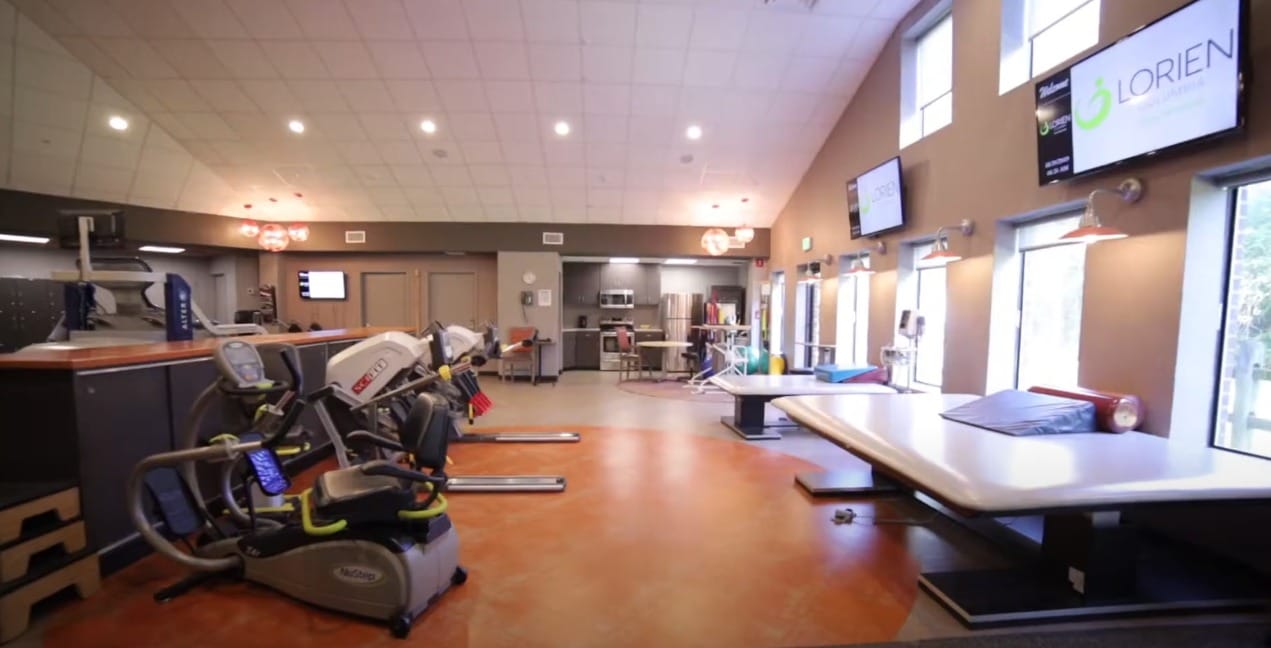
Parkinson’s Wellness is a specialized on-site program, so the community is a great option for residents with that diagnosis. The home’s respite care and hospice services can ease both short-term coverage gaps and end-of-life transitions. Rehabilitation services are also available on-site so residents won’t need to go outside for therapy appointments during recovery.
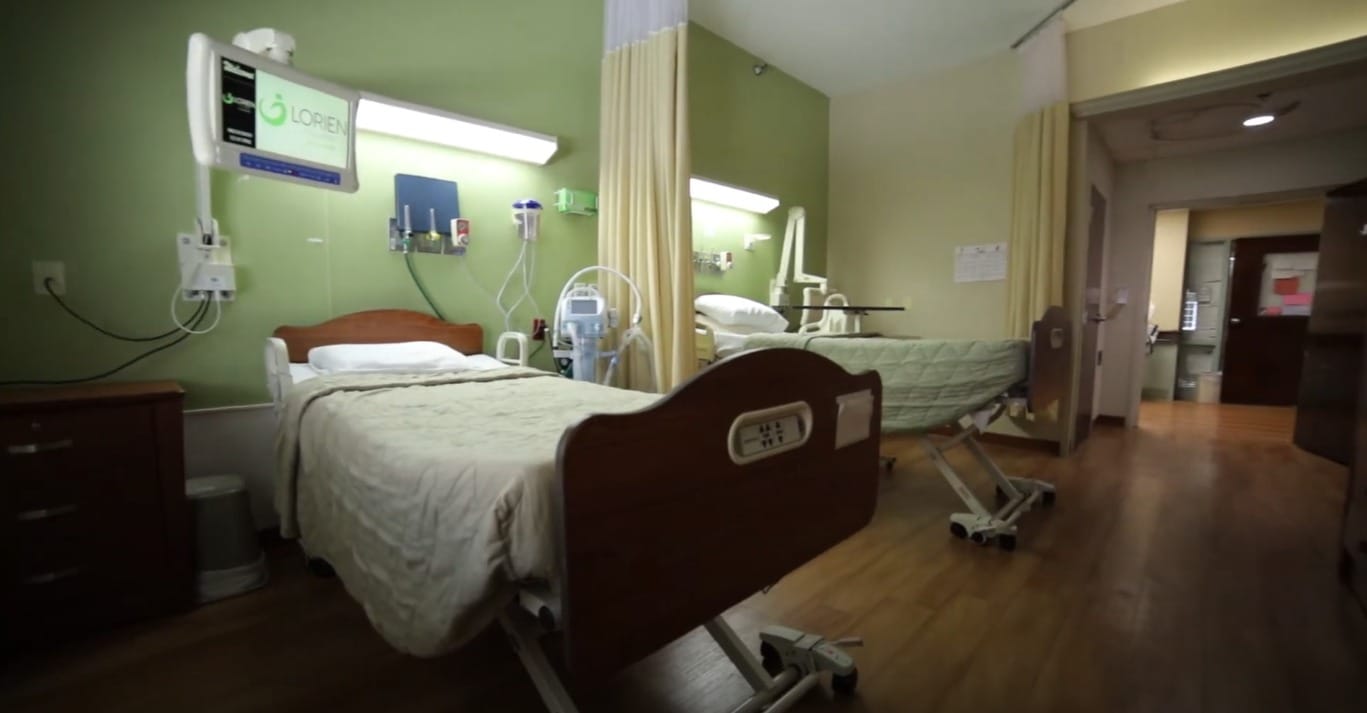
Rooms available range from private to semi-private options. Each has a private bathroom, and assisted living private suites have a kitchenette and bath, offering flexibility for residents at different care levels. Residents’ dining offers a restaurant-style model with attention to specialized diets.
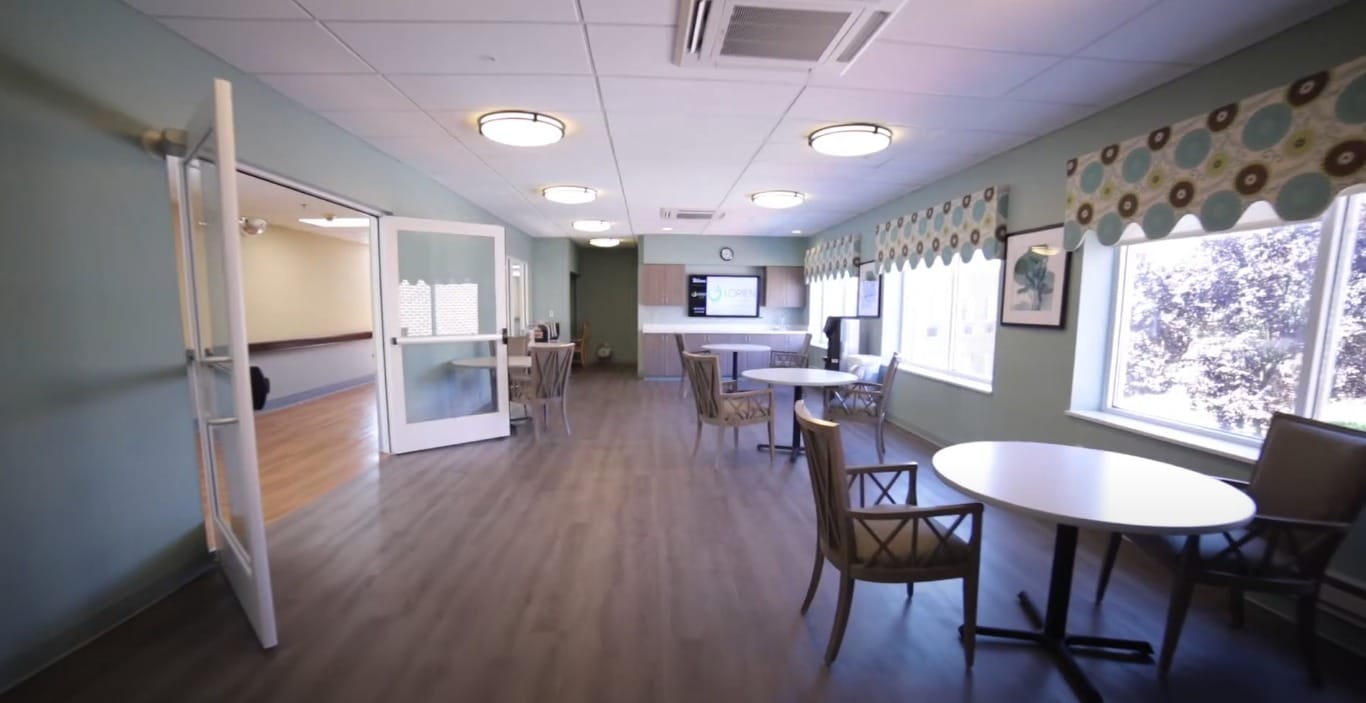
Day-to-day life is supported by amenities such as a salon and spa, a movie theater, an on-site putting green, and a courtyard. Residents can access a wellness program and a seven-day weekly activities calendar to stay engaged. The home offers scheduled daily transportation, which can be helpful for medical appointments and family outings. Free Wi-Fi and cable television are also available.
Lorien Encore’s car-dependent location means family visits will require a car. However, its proximity to Route 29 provides convenient regional access, which may benefit families traveling from surrounding areas.
Sharpe Square Senior Apartments is an exceptional community located near Frederick Health Hospital Emergency Department in Frederick, MD, offering independent living. The community is dedicated to the comfort of those 62+, providing purposely built one-bedroom floor plans. Laundry spaces, maintenance, and management are provided on-site, so residents have more time to do the things they love.
Unique local shops and entertainment sites surround the area, providing residents with unending leisure and wellness opportunities. Fun activities are also conducted to promote social interactions. A fully equipped kitchen is also available, so residents can prepare meals according to their dietary needs and preferences. The community is ideal for those aiming to downsize in retirement, especially with its bright and welcoming setting.
Surrounded by delightful local amenities in Silver Spring, MD, The Leggett at Elizabeth Square is an idyllic retreat that offers independent living. Dedicated to the comfort of those 62+, the community has beautifully furnished and spacious one-bedroom floor plans. Here, residents enjoy a worry-free lifestyle with maintenance services and plenty of convenient apartment features.
Residents will not run out of things to do with a variety of leisure opportunities and cozy communal spaces. Plenty of restaurants and shops also surround the area, ensuring easy access to dining options that cater to their dietary needs and preferences. Healthcare is also easily accessible with Holy Cross Health Partners residing nearby. The community is a great option for those seeking independence in their golden years.
Experience the luxury of a worry-free retirement in Locust Lodge Assisted Living, a vibrant community in Pasadena, MD dedicated to compassionate assisted living. This community guarantees a cozy and well-cared-for living experience with attentive supervision and personalized care services. Residents here enjoy the convenience of having assistance with their daily living activities while maintaining the right level of independence.
Locust Lodge Assisted Living also features cozy common areas which are designed to foster relaxation and social interaction among residents. Residents can also savor delicious and well-balanced home-cooked meals to ensure they maintain proper nourishment and nutrition. The community also handles tedious chores, allowing residents to freely engage in vibrant and enriching activities for a fulfilling living experience.
Ranking Methodology
How we rank these communities
Every community above is evaluated across six weighted categories using public data including state inspection records, review platforms, BBB profiles, and operator-published materials.
Weighting overview
- 35%Resident Experience
- 25%Regulatory
- 15%Visual Media
- 10%Website
- 10%Stability
- 5%Environment
01
Resident & Family Experience 35%
The single largest share of every ranking. Aggregated review sentiment and volume from major platforms — the closest signal to real resident experience.
- Includes
- Review Sentiment
- Review Volume
02
Regulatory & Safety Record 25%
State inspection records, citations, and complaint visits. We weight per-inspection rates more heavily than raw counts.
- Includes
- State Inspections
- Citations/Inspection
- % Inspections w/ Citations
- Complaint Visits
- Accreditations
- BBB Rating
03
Visual Media & Transparency 15%
Communities that publish high-quality visuals give families a real preview. No photos or tours = a negative transparency signal.
- Includes
- Video Tours
- Virtual Walkthroughs
- Photo Quantity
- Photo Quality
04
Website & Operator Transparency 10%
Site quality and whether the operator publishes basic accountability information — staff names, contact details, ownership.
- Includes
- Website Content
- Mobile Usability
- Staff Info Available
- Owner Info Available
05
Community Stability 10%
Operational signals indicating whether a community is well-run and meeting demand.
- Includes
- Occupancy Rate
- Bed Options
06
Environment & Pricing 5%
Walkability and pricing transparency. Walk Score is weighted higher for Independent Living than for Memory Care, where most residents do not leave unaccompanied.
- Includes
- Walk Score
- Pricing Transparency
Nearby Cities
Who we are
Your Senior Care Partner, Every Step of the Way
We help families find affordable senior communities and unlock same day discounts, Medicaid, and Medicare options tailored to your needs.
Contact us Today