


Compare Senior Care around Maryland
Info below is compiled from the MD Dept. of Health (OHCQ), senior community websites & trusted data sources such as Walk Score & BBB.
Communities are listed from highest to lowest based on our ranking methodology.
| Bedford Court, a CCRC | SC AL HOS IL MC NH RC SNF | Silver Spring (International Drive) | 76
Facility
76
MD AVG
42
Rank
#174 / 685 | Yes |
64
Facility
64
MD AVG
43
Rank
#261 / 985 | Studio / 1 Bed | 34
Facility
34
MD AVG
21
Rank
#22 / 210 | - |
15% Male Residents — State Benchmarked 15% of residents are male, compared to the Maryland average of 31%. This facility caters to a majority female resident pool (85% female), consistent with the broader assisted living trend where women significantly outnumber men. |
85% Female Residents — State Benchmarked 85% of residents are female, compared to the Maryland average of 69%. Women comprise the large majority, consistent with national assisted living demographics where women live longer and enter care facilities at higher rates. |
95% White Residents — State Benchmarked 95% of residents are reported as White, compared to the Maryland average of 81%. A higher White share than is typical for assisted living in Maryland in this dataset — compare with peer facilities for local context. |
3% African American Residents — State Benchmarked 3% of residents are reported as African American or Black, compared to the Maryland average of 13%. A lower African American share than is typical in Maryland; local markets still vary widely. |
2% Other Ethnicity Residents — State Benchmarked 2% of residents fall into categories other than White or African American (combined), compared to the Maryland average of 6%. This column aggregates Hispanic, Asian, multiracial, and any other labeled groups that are not classified as White or African American. Reported subgroups in this total: Asian (2%). |
2% Residents Age 65–74 — State Benchmarked 2% of residents are 65–74, compared to the Maryland average of 13%. Fewer younger seniors suggests the resident population skews older, likely requiring higher acuity care and more hands-on support. |
8% Residents Age 75–84 — State Benchmarked 8% of residents are 75–84, compared to the Maryland average of 31%. Below the state norm — the resident mix may skew either younger or older than this typical middle bracket. |
65% Residents Age 85–94 — State Benchmarked 65% of residents are 85–94, compared to the Maryland average of 44%. A high concentration of very elderly residents signals a higher-acuity facility with experience caring for advanced age-related needs. |
26% Residents Age 95+ — State Benchmarked 26% of residents are 95 or older, compared to the Maryland average of 16%. A high proportion of the oldest-old suggests strong end-of-life care experience and very-high-acuity capabilities. |
| Edenwald Senior Living | SC AL IL MC NH SNF | Towson (Southerly Road) | 94
Facility
94
MD AVG
42
Rank
#139 / 685 | No |
83
Facility
83
MD AVG
43
Rank
#70 / 985 | 1 Bed / 2 Bed | - | A+ |
18% Male Residents — State Benchmarked 18% of residents are male, compared to the Maryland average of 31%. This facility caters to a majority female resident pool (82% female), consistent with the broader assisted living trend where women significantly outnumber men. |
82% Female Residents — State Benchmarked 82% of residents are female, compared to the Maryland average of 69%. Women comprise the large majority, consistent with national assisted living demographics where women live longer and enter care facilities at higher rates. |
100% White Residents — State Benchmarked 100% of residents are reported as White, compared to the Maryland average of 81%. A higher White share than is typical for assisted living in Maryland in this dataset — compare with peer facilities for local context. |
0% African American Residents — State Benchmarked 0% of residents are reported as African American or Black, compared to the Maryland average of 13%. A lower African American share than is typical in Maryland; local markets still vary widely. |
0% Other Ethnicity Residents — State Benchmarked 0% of residents fall into categories other than White or African American (combined), compared to the Maryland average of 6%. This column aggregates Hispanic, Asian, multiracial, and any other labeled groups that are not classified as White or African American. | - |
13% Residents Age 75–84 — State Benchmarked 13% of residents are 75–84, compared to the Maryland average of 31%. Below the state norm — the resident mix may skew either younger or older than this typical middle bracket. |
53% Residents Age 85–94 — State Benchmarked 53% of residents are 85–94, compared to the Maryland average of 44%. A high concentration of very elderly residents signals a higher-acuity facility with experience caring for advanced age-related needs. |
35% Residents Age 95+ — State Benchmarked 35% of residents are 95 or older, compared to the Maryland average of 16%. A high proportion of the oldest-old suggests strong end-of-life care experience and very-high-acuity capabilities. |
| Lutheran Village at Miller’s Grant | SC AL IL NH SNF | Ellicott City (Lutheran Village At Miller’s Grant) | 36
Facility
36
MD AVG
42
Rank
#230 / 685 | Yes |
19
Facility
19
MD AVG
43
Rank
#746 / 985 | 1 Bed / 2 Bed | 21
Facility
21
MD AVG
21
Rank
#108 / 210 | - |
17% Male Residents — State Benchmarked 17% of residents are male, compared to the Maryland average of 31%. This facility caters to a majority female resident pool (83% female), consistent with the broader assisted living trend where women significantly outnumber men. |
83% Female Residents — State Benchmarked 83% of residents are female, compared to the Maryland average of 69%. Women comprise the large majority, consistent with national assisted living demographics where women live longer and enter care facilities at higher rates. |
83% White Residents — State Benchmarked 83% of residents are reported as White, compared to the Maryland average of 81%. Close to the average for this category among assisted living facilities in Maryland with reported race/ethnicity data. |
11% African American Residents — State Benchmarked 11% of residents are reported as African American or Black, compared to the Maryland average of 13%. In line with the Maryland average for African American residents among facilities reporting this breakdown. |
6% Other Ethnicity Residents — State Benchmarked 6% of residents fall into categories other than White or African American (combined), compared to the Maryland average of 6%. This column aggregates Hispanic, Asian, multiracial, and any other labeled groups that are not classified as White or African American. Reported subgroups in this total: Asian (6%). | - |
33% Residents Age 75–84 — State Benchmarked 33% of residents are 75–84, compared to the Maryland average of 31%. This is the second most common age bracket in assisted living, representing residents with moderate care needs. |
44% Residents Age 85–94 — State Benchmarked 44% of residents are 85–94, compared to the Maryland average of 44%. This is typically the most common age bracket in assisted living — this facility is in line with the statewide norm. |
22% Residents Age 95+ — State Benchmarked 22% of residents are 95 or older, compared to the Maryland average of 16%. A high proportion of the oldest-old suggests strong end-of-life care experience and very-high-acuity capabilities. |
| Friends House Retirement Community | SC AL IL NH SNF | Sandy Spring | 24
Facility
24
MD AVG
42
Rank
#242 / 685 | Yes |
6
Facility
6
MD AVG
43
Rank
#891 / 985 | - | 20
Facility
20
MD AVG
21
Rank
#112 / 210 | - |
6% Male Residents — State Benchmarked 6% of residents are male, compared to the Maryland average of 31%. This facility caters to a majority female resident pool (94% female), consistent with the broader assisted living trend where women significantly outnumber men. |
94% Female Residents — State Benchmarked 94% of residents are female, compared to the Maryland average of 69%. Women comprise the large majority, consistent with national assisted living demographics where women live longer and enter care facilities at higher rates. |
94% White Residents — State Benchmarked 94% of residents are reported as White, compared to the Maryland average of 81%. A higher White share than is typical for assisted living in Maryland in this dataset — compare with peer facilities for local context. |
0% African American Residents — State Benchmarked 0% of residents are reported as African American or Black, compared to the Maryland average of 13%. A lower African American share than is typical in Maryland; local markets still vary widely. |
6% Other Ethnicity Residents — State Benchmarked 6% of residents fall into categories other than White or African American (combined), compared to the Maryland average of 6%. This column aggregates Hispanic, Asian, multiracial, and any other labeled groups that are not classified as White or African American. Reported subgroups in this total: Asian (6%). |
6% Residents Age 65–74 — State Benchmarked 6% of residents are 65–74, compared to the Maryland average of 13%. Fewer younger seniors suggests the resident population skews older, likely requiring higher acuity care and more hands-on support. |
18% Residents Age 75–84 — State Benchmarked 18% of residents are 75–84, compared to the Maryland average of 31%. Below the state norm — the resident mix may skew either younger or older than this typical middle bracket. |
53% Residents Age 85–94 — State Benchmarked 53% of residents are 85–94, compared to the Maryland average of 44%. A high concentration of very elderly residents signals a higher-acuity facility with experience caring for advanced age-related needs. |
24% Residents Age 95+ — State Benchmarked 24% of residents are 95 or older, compared to the Maryland average of 16%. A high proportion of the oldest-old suggests strong end-of-life care experience and very-high-acuity capabilities. |
| Sunrise of Rockville | SC AL HOS MC | Rockville (Baltimore Road) | 89
Facility
89
MD AVG
42
Rank
#150 / 685 | Yes |
89
Facility
89
MD AVG
43
Rank
#32 / 985 | Studio / 1 Bed / 2 Bed | 45
Facility
45
MD AVG
21
Rank
#4 / 210 | A- |
23% Male Residents — State Benchmarked 23% of residents are male, compared to the Maryland average of 31%. This facility caters to a majority female resident pool (77% female), consistent with the broader assisted living trend where women significantly outnumber men. |
77% Female Residents — State Benchmarked 77% of residents are female, compared to the Maryland average of 69%. Women comprise the large majority, consistent with national assisted living demographics where women live longer and enter care facilities at higher rates. |
87% White Residents — State Benchmarked 87% of residents are reported as White, compared to the Maryland average of 81%. Close to the average for this category among assisted living facilities in Maryland with reported race/ethnicity data. |
2% African American Residents — State Benchmarked 2% of residents are reported as African American or Black, compared to the Maryland average of 13%. A lower African American share than is typical in Maryland; local markets still vary widely. |
11% Other Ethnicity Residents — State Benchmarked 11% of residents fall into categories other than White or African American (combined), compared to the Maryland average of 6%. This column aggregates Hispanic, Asian, multiracial, and any other labeled groups that are not classified as White or African American. Reported subgroups in this total: Mixed Race (6%), Hispanic (3%), Asian (2%). |
3% Residents Age 65–74 — State Benchmarked 3% of residents are 65–74, compared to the Maryland average of 13%. Fewer younger seniors suggests the resident population skews older, likely requiring higher acuity care and more hands-on support. |
31% Residents Age 75–84 — State Benchmarked 31% of residents are 75–84, compared to the Maryland average of 31%. This is the second most common age bracket in assisted living, representing residents with moderate care needs. |
56% Residents Age 85–94 — State Benchmarked 56% of residents are 85–94, compared to the Maryland average of 44%. A high concentration of very elderly residents signals a higher-acuity facility with experience caring for advanced age-related needs. |
10% Residents Age 95+ — State Benchmarked 10% of residents are 95 or older, compared to the Maryland average of 16%. Most residents here have not yet reached the oldest-old bracket, suggesting a younger overall community. |
| Maplewood Park Place | SC AL IL MC NH SNF | Bethesda (Pooks Hill) | 29
Facility
29
MD AVG
42
Rank
#240 / 685 | Yes |
38
Facility
38
MD AVG
43
Rank
#542 / 985 | 1 Bed / 2 Bed | 30
Facility
30
MD AVG
21
Rank
#44 / 210 | - |
18% Male Residents — State Benchmarked 18% of residents are male, compared to the Maryland average of 31%. This facility caters to a majority female resident pool (82% female), consistent with the broader assisted living trend where women significantly outnumber men. |
82% Female Residents — State Benchmarked 82% of residents are female, compared to the Maryland average of 69%. Women comprise the large majority, consistent with national assisted living demographics where women live longer and enter care facilities at higher rates. |
100% White Residents — State Benchmarked 100% of residents are reported as White, compared to the Maryland average of 81%. A higher White share than is typical for assisted living in Maryland in this dataset — compare with peer facilities for local context. |
0% African American Residents — State Benchmarked 0% of residents are reported as African American or Black, compared to the Maryland average of 13%. A lower African American share than is typical in Maryland; local markets still vary widely. |
0% Other Ethnicity Residents — State Benchmarked 0% of residents fall into categories other than White or African American (combined), compared to the Maryland average of 6%. This column aggregates Hispanic, Asian, multiracial, and any other labeled groups that are not classified as White or African American. | - |
6% Residents Age 75–84 — State Benchmarked 6% of residents are 75–84, compared to the Maryland average of 31%. Below the state norm — the resident mix may skew either younger or older than this typical middle bracket. |
24% Residents Age 85–94 — State Benchmarked 24% of residents are 85–94, compared to the Maryland average of 44%. The population here skews younger than the statewide norm, which may indicate a more active, lower-acuity community. |
71% Residents Age 95+ — State Benchmarked 71% of residents are 95 or older, compared to the Maryland average of 16%. A high proportion of the oldest-old suggests strong end-of-life care experience and very-high-acuity capabilities. |
| Ingleside at King Farm | SC AL IL MC NH SNF | Rockville (King Farm) | 45
Facility
45
MD AVG
42
Rank
#219 / 685 | Yes |
73
Facility
73
MD AVG
43
Rank
#152 / 985 | 1 Bed / 2 Bed | - | - | - | - | - | - | - | - | - | - | - |
| Homewood Living Frederick | SC AL IL MC NH SNF | Frederick | 120
Facility
120
MD AVG
42
Rank
#73 / 685 | Yes |
14
Facility
14
MD AVG
43
Rank
#788 / 985 | 1 Bed / 2 Bed | - | - | - | - | - | - | - | - | - | - | - |
| Residences at Vantage Point | SC AL HC IL MC NH SNF | Columbia (Town Center) | 44
Facility
44
MD AVG
42
Rank
#222 / 685 | Yes |
52
Facility
52
MD AVG
43
Rank
#402 / 985 | Studio / 1 Bed / 2 Bed | 36
Facility
36
MD AVG
21
Rank
#16 / 210 | - | - | - | - | - | - | - | - | - | - |
| Buckingham‘s Choice | SC AL MC NH RC SNF | Adamstown (Baker Circle) | 42
Facility
42
MD AVG
42
Rank
#223 / 685 | No |
3
Facility
3
MD AVG
43
Rank
#930 / 985 | Private Rooms | 31
Facility
31
MD AVG
21
Rank
#39 / 210 | - | - | - | - | - | - | - | - | - | - |
| Sunrise of Pikesville | SC NH AL HOS MC | Pikesville (Old Court Road) | 96
Facility
96
MD AVG
42
Rank
#131 / 685 | Yes |
75
Facility
75
MD AVG
43
Rank
#131 / 985 | Studio / 1 Bed / 2 Bed | 45
Facility
45
MD AVG
21
Rank
#4 / 210 | A- |
30% Male Residents — State Benchmarked 30% of residents are male, compared to the Maryland average of 31%. This facility caters to a majority female resident pool (70% female), consistent with the broader assisted living trend where women significantly outnumber men. |
70% Female Residents — State Benchmarked 70% of residents are female, compared to the Maryland average of 69%. Women comprise the large majority, consistent with national assisted living demographics where women live longer and enter care facilities at higher rates. |
63% White Residents — State Benchmarked 63% of residents are reported as White, compared to the Maryland average of 81%. A lower White share than the Maryland average — the community may draw a more diverse resident mix relative to other facilities in Maryland. |
37% African American Residents — State Benchmarked 37% of residents are reported as African American or Black, compared to the Maryland average of 13%. A higher African American share than the typical Maryland average — useful context when comparing cultural fit and community composition. |
0% Other Ethnicity Residents — State Benchmarked 0% of residents fall into categories other than White or African American (combined), compared to the Maryland average of 6%. This column aggregates Hispanic, Asian, multiracial, and any other labeled groups that are not classified as White or African American. |
15% Residents Age 65–74 — State Benchmarked 15% of residents are 65–74, compared to the Maryland average of 13%. In line with the statewide profile for this youngest senior bracket in assisted living. |
27% Residents Age 75–84 — State Benchmarked 27% of residents are 75–84, compared to the Maryland average of 31%. This is the second most common age bracket in assisted living, representing residents with moderate care needs. |
41% Residents Age 85–94 — State Benchmarked 41% of residents are 85–94, compared to the Maryland average of 44%. This is typically the most common age bracket in assisted living — this facility is in line with the statewide norm. |
15% Residents Age 95+ — State Benchmarked 15% of residents are 95 or older, compared to the Maryland average of 16%. In line with the statewide profile for the oldest resident bracket. |
| Brighton Gardens of Friendship Heights | SC AL HOS MC | Chevy Chase (Friendship Boulevard) | 154
Facility
154
MD AVG
42
Rank
#39 / 685 | Yes |
86
Facility
86
MD AVG
43
Rank
#47 / 985 | Studio / 1 Bed / 2 Bed | 29
Facility
29
MD AVG
21
Rank
#48 / 210 | - |
20% Male Residents — State Benchmarked 20% of residents are male, compared to the Maryland average of 31%. This facility caters to a majority female resident pool (80% female), consistent with the broader assisted living trend where women significantly outnumber men. |
80% Female Residents — State Benchmarked 80% of residents are female, compared to the Maryland average of 69%. Women comprise the large majority, consistent with national assisted living demographics where women live longer and enter care facilities at higher rates. |
96% White Residents — State Benchmarked 96% of residents are reported as White, compared to the Maryland average of 81%. A higher White share than is typical for assisted living in Maryland in this dataset — compare with peer facilities for local context. |
1% African American Residents — State Benchmarked 1% of residents are reported as African American or Black, compared to the Maryland average of 13%. A lower African American share than is typical in Maryland; local markets still vary widely. |
3% Other Ethnicity Residents — State Benchmarked 3% of residents fall into categories other than White or African American (combined), compared to the Maryland average of 6%. This column aggregates Hispanic, Asian, multiracial, and any other labeled groups that are not classified as White or African American. Reported subgroups in this total: Asian (2%), Hispanic (1%). |
3% Residents Age 65–74 — State Benchmarked 3% of residents are 65–74, compared to the Maryland average of 13%. Fewer younger seniors suggests the resident population skews older, likely requiring higher acuity care and more hands-on support. |
31% Residents Age 75–84 — State Benchmarked 31% of residents are 75–84, compared to the Maryland average of 31%. This is the second most common age bracket in assisted living, representing residents with moderate care needs. |
49% Residents Age 85–94 — State Benchmarked 49% of residents are 85–94, compared to the Maryland average of 44%. A high concentration of very elderly residents signals a higher-acuity facility with experience caring for advanced age-related needs. |
15% Residents Age 95+ — State Benchmarked 15% of residents are 95 or older, compared to the Maryland average of 16%. In line with the statewide profile for the oldest resident bracket. |
| Sunrise of Frederick | SC AL MC | Frederick (Waterford) | 88
Facility
88
MD AVG
42
Rank
#152 / 685 | Yes |
62
Facility
62
MD AVG
43
Rank
#286 / 985 | Studio / Suite / 2 Bed | 45
Facility
45
MD AVG
21
Rank
#4 / 210 | A- |
31% Male Residents — State Benchmarked 31% of residents are male, compared to the Maryland average of 31%. This facility caters to a majority female resident pool (69% female), consistent with the broader assisted living trend where women significantly outnumber men. |
69% Female Residents — State Benchmarked 69% of residents are female, compared to the Maryland average of 69%. Women comprise the large majority, consistent with national assisted living demographics where women live longer and enter care facilities at higher rates. |
97% White Residents — State Benchmarked 97% of residents are reported as White, compared to the Maryland average of 81%. A higher White share than is typical for assisted living in Maryland in this dataset — compare with peer facilities for local context. |
2% African American Residents — State Benchmarked 2% of residents are reported as African American or Black, compared to the Maryland average of 13%. A lower African American share than is typical in Maryland; local markets still vary widely. |
2% Other Ethnicity Residents — State Benchmarked 2% of residents fall into categories other than White or African American (combined), compared to the Maryland average of 6%. This column aggregates Hispanic, Asian, multiracial, and any other labeled groups that are not classified as White or African American. Reported subgroups in this total: Hispanic (2%). |
10% Residents Age 65–74 — State Benchmarked 10% of residents are 65–74, compared to the Maryland average of 13%. Fewer younger seniors suggests the resident population skews older, likely requiring higher acuity care and more hands-on support. |
34% Residents Age 75–84 — State Benchmarked 34% of residents are 75–84, compared to the Maryland average of 31%. This is the second most common age bracket in assisted living, representing residents with moderate care needs. |
48% Residents Age 85–94 — State Benchmarked 48% of residents are 85–94, compared to the Maryland average of 44%. This is typically the most common age bracket in assisted living — this facility is in line with the statewide norm. |
6% Residents Age 95+ — State Benchmarked 6% of residents are 95 or older, compared to the Maryland average of 16%. Most residents here have not yet reached the oldest-old bracket, suggesting a younger overall community. |
| Autumn Lake Healthcare at Riverview | SC HOS NH PC RC SNF | Essex | 238
Facility
238
MD AVG
42
Rank
#5 / 685 | No |
61
Facility
61
MD AVG
43
Rank
#301 / 985 | - | - | - | - | - | - | - | - | - | - | - | - |
| Sterling Care Hillhaven Assisted Living and Memory Care | SC AL HOS MC NH SNF | Adelphi (Knollwood) | 66
Facility
66
MD AVG
42
Rank
#188 / 685 | No |
25
Facility
25
MD AVG
43
Rank
#684 / 985 | Studio / 1 Bed | - | - | - | - | - | - | - | - | - | - | - |
Rows per page:

View all Nearby Homes
Surrounded by convenient local amenities in Baltimore, MD, Esther’s Place at Montebello is a blissful retreat that offers assisted living. A compassionate and well-trained team also provides top-tier care tailored to residents’ daily living activities, including bathing and grooming, 24/7. With specially designed and secure accommodations, the community ensures residents feel at ease during their stay.
A variety of engaging programs and fun social events, including group exercises and movie nights, are conducted for residents’ leisure and wellness. Delicious and healthy meals are also served to meet residents’ dietary needs and preferences, ensuring a satisfactory dining experience. Residents are also reminded to take their medicine as prescribed with medication management. The community is ideal for those needing assistance to live comfortably in retirement, especially with its state-of-the-art amenities and friendly setting.
Overview of Assisted Living at Goodwill

Owned and operated by Tim Bender, Assisted Living at Goodwill is a 45-bed residential community in Grantsville, Maryland. Medicare and private pay are welcome to provide flexible coverage options for families exploring residential care. With a 97 percent occupancy rate and an average resident stay duration of 660 days, the home has a stable, established population and a settled daily culture.
Staffing is significant for a community of this size. Total nursing care averages just under 5 hours per resident day, anchored by registered nurses, nurse aides, and licensed practical nurses who provide 24-hour on-site presence. This level of attentive support reflects a commitment to daily assistance and clinical oversight, making the home suitable for residents needing ongoing care coordination and medical attention. It underscores rehabilitation and therapeutic services as core features. Occupants can access physical therapy, occupational therapy, and speech therapy on-site, which can lessen the need for outside appointments and keep recovery-focused care under one roof. In-room physician visits are also available, further streamlining medical management for those with complex health needs. Daily life is supported by a full array of amenities and services. Meals are included as part of the daily rate to exclude meal planning from family responsibilities. Housekeeping, laundry, and scheduling of medical appointments are handled by staff, along with planned activities and beauty and barber services. Transportation is provided, which is useful given that the surrounding area scores 30 on the Walk Score scale. While a few nearby services are walkable, most errands demand a vehicle.
The Grantsville location places Assisted Living at Goodwill in a quieter, more rural setting, which some families find captivating for the calmer daily environment it offers versus busier urban areas.
Create unforgettable moments with the idyllic senior living community of Taylor and Jackie Assisted Living II in Hamilton Avenue, Baltimore, MD, that offers assisted living. Seniors ease their minds with a reliable and highly skilled team helping with their daily living activities and personal hygiene. The community goes above and beyond to provide a comfortable and safe space for seniors with round-the-clock supervision.
There is always something to enjoy with carefully curated activities and engaging programs that highlight residents’ aspirations and strengths. Mealtimes provide opportunities for interactions with friends over diverse dining options that cater to dietary needs and preferences. Taylor and Jackie Assisted Living II promotes a bright and friendly environment for seniors to experience a wondrous retirement.
Peacefully nestled in Baltimore, MD, A Nurturing Hand Assisted Living provides a safe and relaxing setting for assisted living. Their wonderful care team ensures residents are loved and cared for by offering 24/7 supervision and assistance with daily activities like grooming, dressing, and medication reminders. Residents can comfortably enjoy their time in their cozy accommodations with convenient features and housekeeping services included for a worry-free lifestyle.
There is no shortage of fun, with an array of activities and events held by the community regularly. Residents’ nutrition is also properly maintained with healthy and tasty meals that cater to special dietary restrictions and preferences. At A Nurturing Hand Assisted Living, they continuously work hard to maintain a supportive environment that allows residents to flourish.
Situated in Towson, Maryland, Seaton Towson is a distinguished senior living community offering unparalleled assisted living services. Their commitment to unsurpassed care, superior value, and outstanding lifestyle quality sets them apart.
Seaton Towson is dedicated to creating a vibrant and caring environment where residents can thrive. Suites and apartment homes provide warm and welcoming settings for seniors to enjoy their daily lives. With best-in-class amenities and the support of friendly care professionals, the community is the preferred choice for high-quality Assisted Living in the area. Residents delight in three chef-prepared meals daily, engage in daily activities and social events, explore Towson’s modern-day entertainment options, or simply relax and connect with friends and family in and around the community.
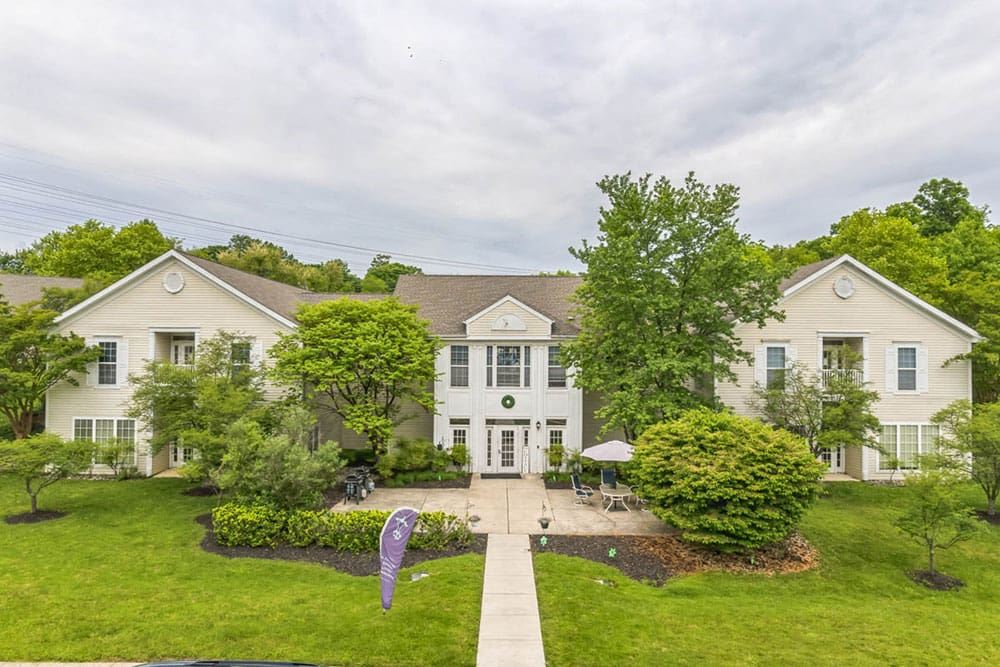
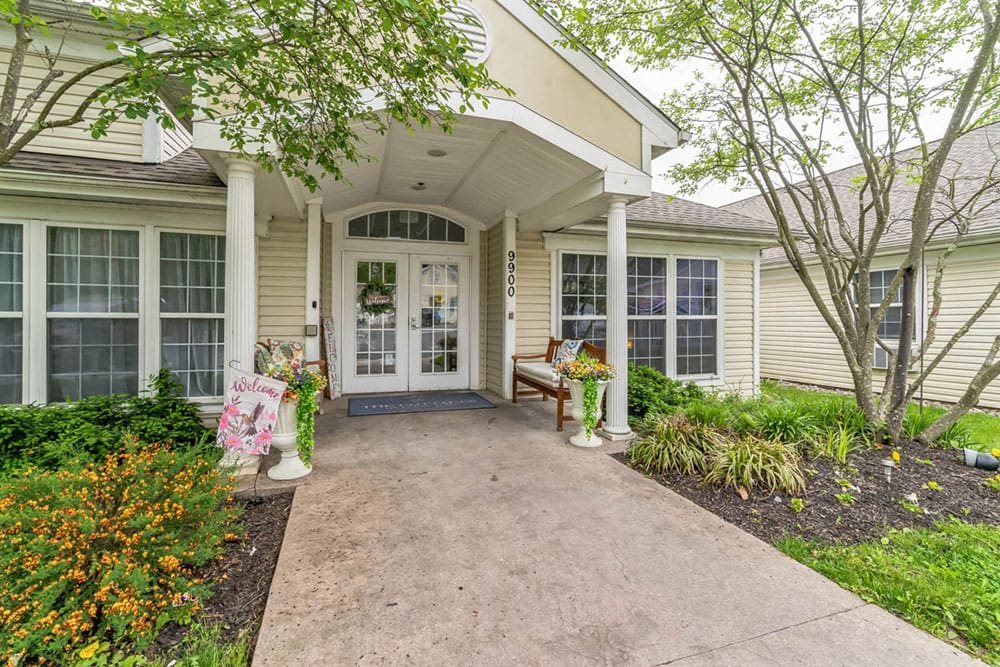
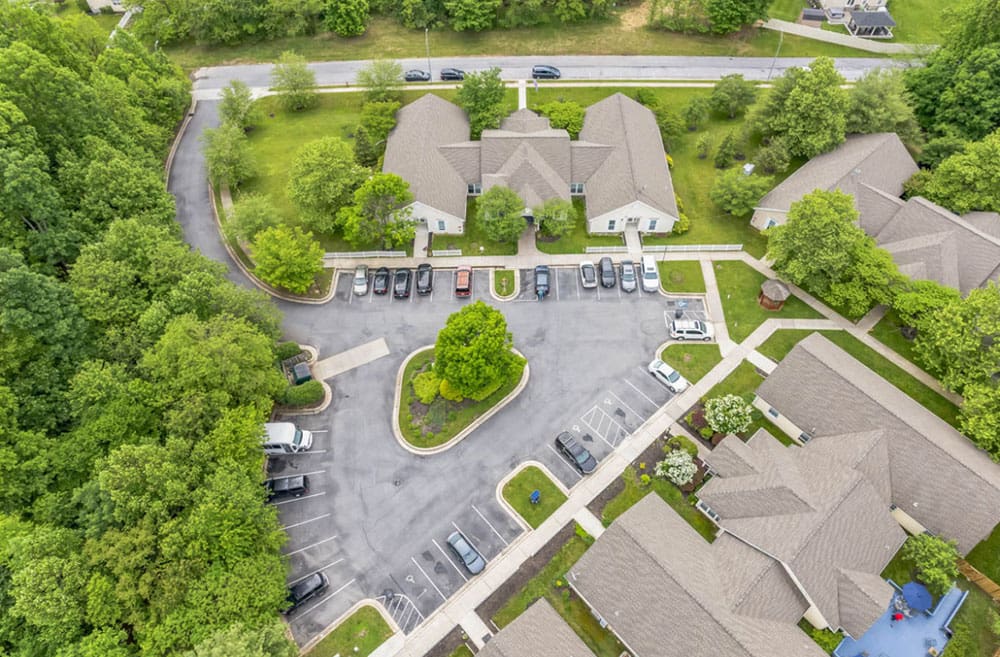
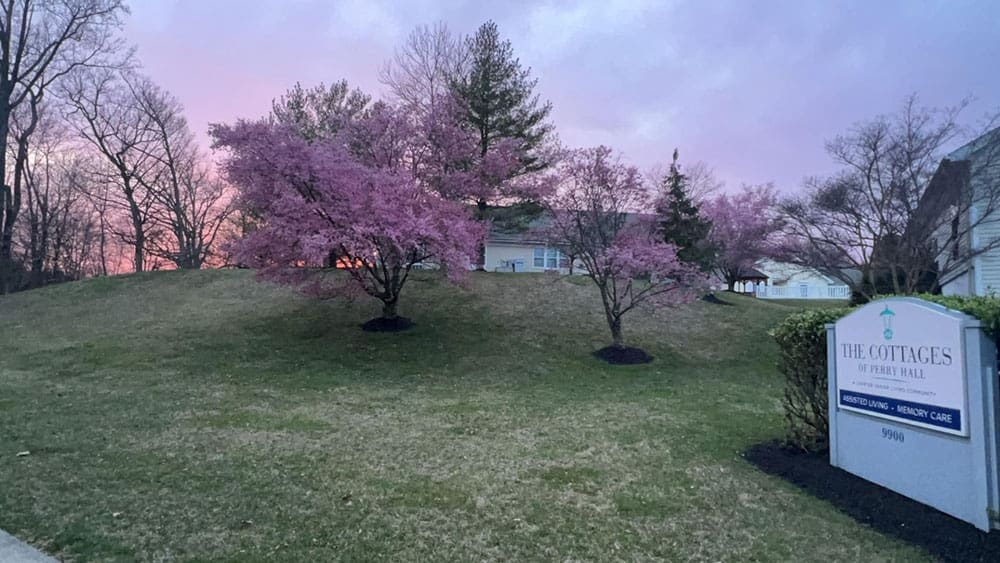
Overview of The Cottages of Perry Hall

Tucked away in the peaceful community of Parkville, MD, The Cottages of Perry Hall is a unique senior living community that offers assisted living and memory care. The community ensures a comfortable residence with a variety of spacious studio suites with access to personalized care services tailored to residents’ unique needs. A dedicated and highly trained care team is available to provide various assistance to residents living with dementia.
Residents can leave their tedious chores behind with services like weekly housekeeping, laundry services, and maintenance. Nursing care and emergency call systems are available to ensure residents’ care needs are met immediately. A culinary team ensures residents get the nourishment they need to participate actively in community activities and explore the wide array of amenities available.
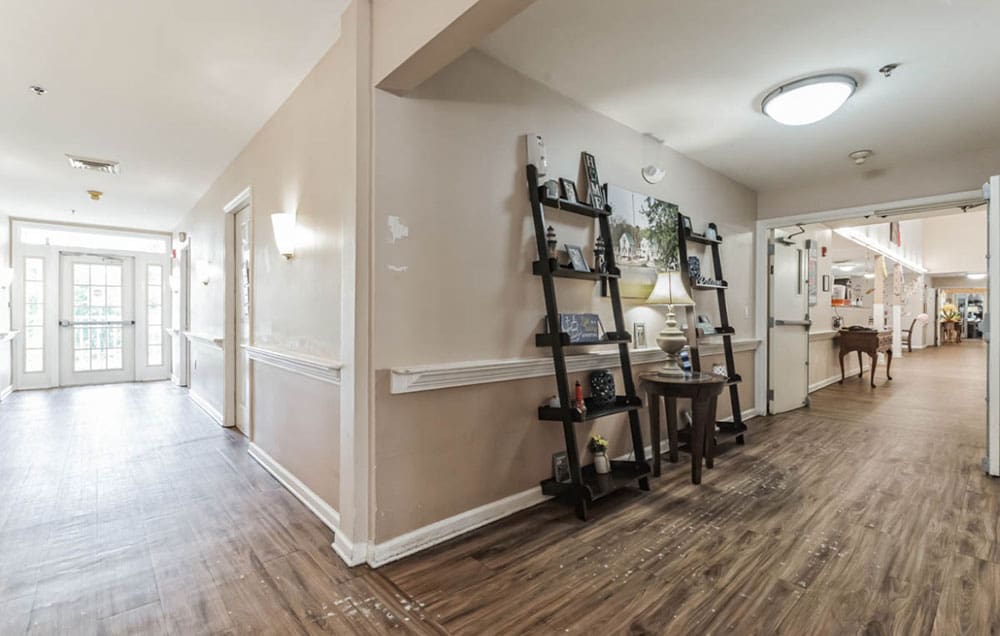
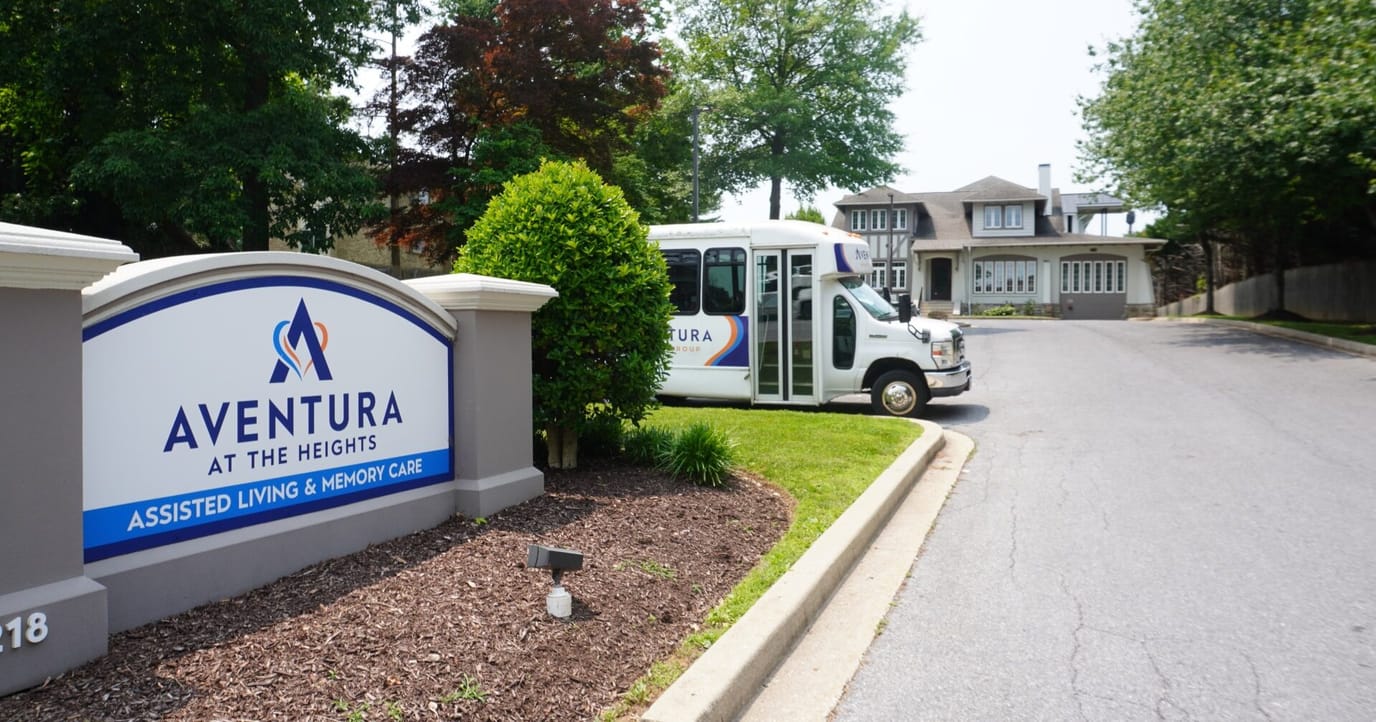
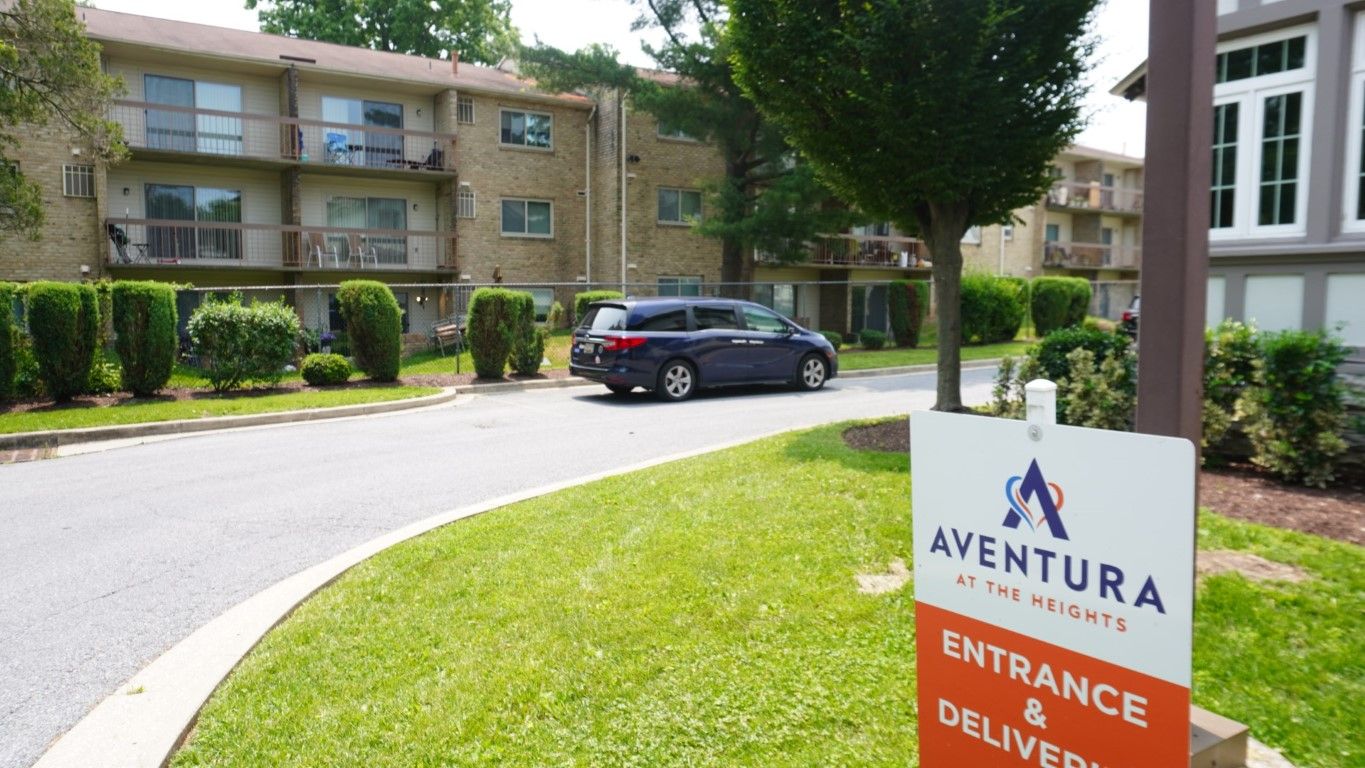
Overview of Aventura at the Heights

Aventura at the Heights is an assisted living community focused on assisting memory care for all seniors seeking additional support to enhance their quality of life. A proud member of the Aventura, The Heights is ensured to provide a professional senior living environment focused on the wellness, health, and social aspects of each resident. The Aventura experience present in The Heights in Baltimore is guaranteed to create connections and provide engaging experiences among members of the community while maintaining a balance of independence and extra comprehensive assistance.
Life at The Heights provides the Aventura way, they provide an array of services: stroke recovery, respite care, transitional care, long-term care, respite stays, and ventilator care– all designed to fit the lifestyle of seniors with specific needs. Aventura also provides a wound care program where residents with surgical or diabetic wounds may need therapy for a complication-free recovery; with that, there are respiratory therapists on-site who are ready to offer relief for residents who are struggling with respiratory emergencies.
Overview of Morningside House of Ellicott City

Morningside House of Ellicott City, situated in the heart of Ellicott City, MD, is a perfect retirement haven in quiet residential areas. The community offers a variety of studio, one-bedroom, and two-bedroom apartments, providing options suited to different preferences and budgets. With assisted living, hospice care, and memory care services, this community offers residents a warm and enriching place to call home. Conveniently located near restaurants and shopping centers, it combines peaceful surroundings with easy access to local attractions.
A highlight of this exceptional community is its diverse wellness programs, designed to support the physical, emotional, and mental health of residents. These programs provide each individual with personalized care within a nurturing environment. With high-quality services, residents can enjoy a vibrant and fulfilling lifestyle at Morningside House of Ellicott City.
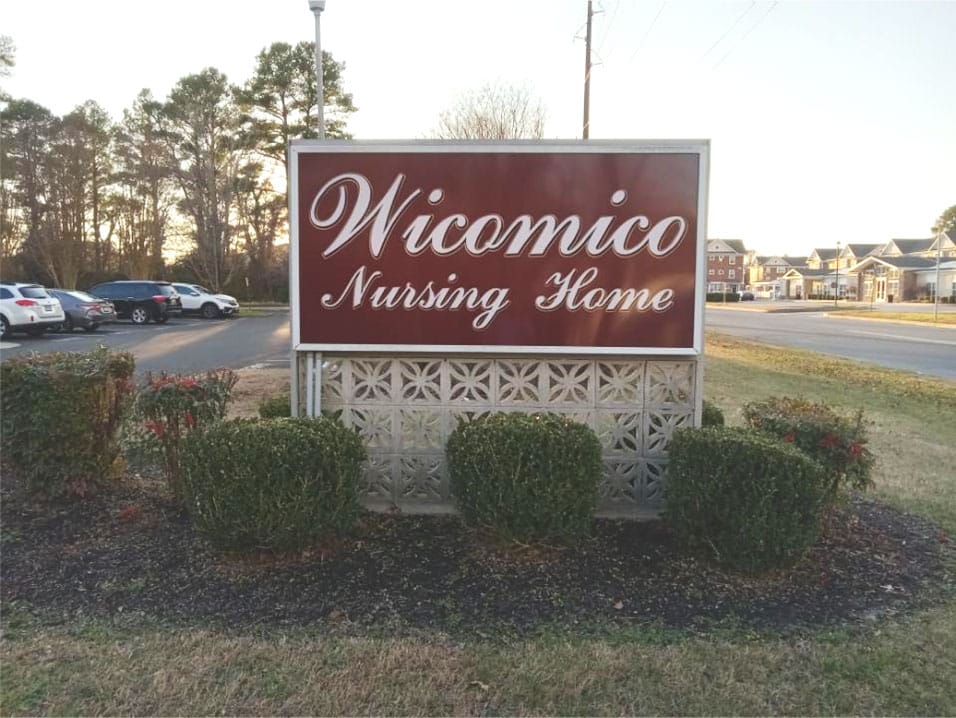
Overview of Wicomico Nursing Home
Wicomico Nursing Home is a nursing home in Salisbury, MD, offering rehabilitation and skilled nursing. Promoting a comfortable and supportive environment, the community ensures older adults experience a worry-free lifestyle. Dietitian-approved meals, 24-hour care, and comprehensive therapies are among the exceptional services provided to improve residents’ quality of life. Through individualized care plans, residents receive the utmost attention and care for their unique needs and preferences.
Arts and crafts, food socials, and beauty services help residents maintain holistic wellness and keep them happy. Wheelchair-accessible amenities and cozy rooms also ensure residents’ relaxation and wellness. Residents have a quiet and convenient retirement, as it is nestled in the tree-lined neighborhood of Salisbury. As one of the highly rated options for senior living in Maryland, this nursing home continuously provides exceptional services for older adults’ well-being.
Overview of Maryland Masonic Homes

Maryland Masonic Homes is a 110-bed nursing home located in Cockeysville, Maryland. The facility accepts Medicare, Medicaid, and private pay to cover care expenses. The surrounding neighborhood is car-dependent, meaning visitors will need a vehicle for most trips and errands.
The building operates at 51 percent occupancy, and residents stay for an average of 74 days. This timeline shows that the daily routine supports both short-term post-hospital recovery and continuous long-term care.
To manage daily medical needs, the floor staff logs 3 hours and 51 minutes of total nursing care per resident each day, which includes 54 minutes from registered nurses and 2 hours and 1 minute from nurse aides. The clinical setup also incorporates dedicated rehabilitation services and temporary respite care.
Families evaluating regional care options can connect with the admissions department to verify current room openings and review financial coverage structures. Arranging an in-person walkthrough allows open discussion with the nursing team regarding daily schedules, meal setups, and therapy routines.
Ranking Methodology
How we rank these communities
Every community above is evaluated across six weighted categories using public data including state inspection records, review platforms, BBB profiles, and operator-published materials.
Weighting overview
- 35%Resident Experience
- 25%Regulatory
- 15%Visual Media
- 10%Website
- 10%Stability
- 5%Environment
01
Resident & Family Experience 35%
The single largest share of every ranking. Aggregated review sentiment and volume from major platforms — the closest signal to real resident experience.
- Includes
- Review Sentiment
- Review Volume
02
Regulatory & Safety Record 25%
State inspection records, citations, and complaint visits. We weight per-inspection rates more heavily than raw counts.
- Includes
- State Inspections
- Citations/Inspection
- % Inspections w/ Citations
- Complaint Visits
- Accreditations
- BBB Rating
03
Visual Media & Transparency 15%
Communities that publish high-quality visuals give families a real preview. No photos or tours = a negative transparency signal.
- Includes
- Video Tours
- Virtual Walkthroughs
- Photo Quantity
- Photo Quality
04
Website & Operator Transparency 10%
Site quality and whether the operator publishes basic accountability information — staff names, contact details, ownership.
- Includes
- Website Content
- Mobile Usability
- Staff Info Available
- Owner Info Available
05
Community Stability 10%
Operational signals indicating whether a community is well-run and meeting demand.
- Includes
- Occupancy Rate
- Bed Options
06
Environment & Pricing 5%
Walkability and pricing transparency. Walk Score is weighted higher for Independent Living than for Memory Care, where most residents do not leave unaccompanied.
- Includes
- Walk Score
- Pricing Transparency
Nearby Cities
Who we are
Your Senior Care Partner, Every Step of the Way
We help families find affordable senior communities and unlock same day discounts, Medicaid, and Medicare options tailored to your needs.
Contact us Today
Updated on
