Brandon Community Carew Center
Nursing Home & Assisted Living · Brandon, MS
CMS overall rating Info CMS (the Centers for Medicare & Medicaid Services) is the federal agency that rates nursing home quality. Its Overall Rating runs from 1 to 5 stars, combining health inspections, staffing, and quality measures, with inspections weighted most heavily.

Brandon Community Carew Center

Nursing Home & Assisted Living · Brandon, MS
CMS overall rating Info CMS (the Centers for Medicare & Medicaid Services) is the federal agency that rates nursing home quality. Its Overall Rating runs from 1 to 5 stars, combining health inspections, staffing, and quality measures, with inspections weighted most heavily.
Calculator: See prices in your area
Brandon Community Carew Center accepts Medicaid, Medicare, and private pay.

Overview of Brandon Community Carew Center

Brandon Community Carew Center is a 230-bed skilled nursing facility at 355 Crossgate Boulevard, Brandon, Rankin County, MS, led by administrator Felicia Scott under ownership by Joyce Course. The privately-owned facility specializes in short-term Medicare rehabilitation, accepting about half its new admissions through Medicare, with typical stays around 288 days.

Brandon carries a 1-star overall CMS rating, the result of persistent deficiencies across health inspections, staffing, and quality outcomes. Over 11 inspections, the facility documented 43 total citations with a critical pattern: 6 critical violations (500% above the state average of 1 deficiency) and 4 serious violations (264% above state levels). Between 2022 and January 2026, complaint investigations revealed failures in environmental safety, most notably a January 2026 incident in which a resident fell on a wet floor that housekeeping had mopped without placing caution signs, resulting in an orbital blowout fracture, multiple facial lacerations requiring six sutures, and hospitalization. A separate January 2024 finding documented systematic failure to empty dialysis patients’ urine collection bags every eight hours, with one resident’s nephrostomy bag exceeding 700 milliliters (capacity 600) because nursing staff had not checked it since 7:00 AM that morning.

An April 2025 complaint investigation found staff failed to remove dialysis access site pressure dressings within the prescribed four to six hours post-treatment, creating risk for clotting and stenosis. Staff failed to recognize foot wounds identified and treated by dialysis clinic staff on April 16, 2025, and did not initiate facility wound care until April 21, a five-day delay. These patterns in housekeeping lapses, care plan implementation failures, and delayed clinical response signal systematic gaps in supervision and clinical judgment.

Staffing is 47% below state average for registered nurses (20 minutes per resident per day versus state average 38 minutes) and weekend RN coverage is 55% below state benchmark (10 minutes versus 22 minutes), marking a material reduction in clinical oversight outside weekday hours. Licensed practical nurse and certified nursing assistant hours are at or slightly above state levels. Physical therapist hours exceed state average by 150%, reflecting the facility’s emphasis on rehabilitation services.

Short-stay residents show concerning patterns. Re-hospitalization after nursing home admission stands at 35.6% (28% worse than state average 27.9%), and successful return to home or community is 37.1% (27% worse than state average 50.6%). Both figures suggest either higher-acuity admissions or gaps in post-acute care management. Long-stay residents experienced hospitalizations at 2.92 per 1,000 days (20% worse than state average 2.44).

Vaccination rates lag substantially: pneumococcal vaccination 74.2% long-stay and 69.6% short-stay (both significantly below state levels near 96% and 88% respectively), and influenza vaccination 50.5% long-stay and 50.4% short-stay (both 48-40% worse than state rates near 97% and 85%). Weight loss among long-stay residents was 14.2% (128% worse than state average of 6.2%), and antipsychotic use 28.8% (36% worse than state average of 21.2%).

The facility issued a $90,000 civil money penalty in January 2025 and received a payment denial (Medicare and Medicaid temporarily stopped payments for new admissions) for regulatory violations. Occupancy stands at 90.4%, above the state average, indicating strong demand and limited bed availability. The facility is located on a walk score of 28, meaning most trips require transportation, but is proximate to regional hospitals and medical resources in Rankin County.

Given persistent patterns of housekeeping and care implementation failures across multiple years, families evaluating Brandon should ask directly about corrective actions and current protocols.

Quality ratings

Measured by Centers for Medicare & Medicaid Services (CMS)

Overall rating Info The Overall CMS Rating combines results from health inspections, staffing levels and quality measures. Health inspections carry the most weight. Staffing and quality scores can increase or decrease the final rating based on performance compared to state and national standards.
Health Inspection Info Based on the results of the facility's three most recent standard inspections and any complaint investigations. CMS reviews the number, scope, and severity of deficiencies, with more recent findings weighted more heavily.
Staffing Info Measures average nursing staff hours per resident per day, including Registered Nurses (RNs) and total nursing staff. Ratings are adjusted based on the level of care residents require and are compared to state and national benchmarks.
Quality Measures Info Based on clinical and physical health indicators reported to CMS, such as hospital readmissions, falls, pressure ulcers, and improvements in mobility. These measures reflect how well residents' health needs are being managed.

Staffing hours breakdown

Info Daily nursing hours per resident by staff type, reported to CMS. Higher is generally better — compare this facility to state and national averages to see where staffing stands.

Hours per resident per day — compared to state averages

Total nursing care / resident Info Total adjusted nursing hours per resident per day, combining RN, LPN, and aide time. CMS adjusts this for case-mix so facilities can be fairly compared.
4h 51m per day
Rank #36 / 117Nurse hours — State benchmarkedThis home is ranked 36th out of 117 homes in Mississippi. Shows adjusted nurse hours per resident per day benchmarked to the Mississippi average, with a ranking across 117 Mississippi facilities. More hours mean more direct care. The national average is about 3.5 hrs; below 3.0 is a red flag.Rankings are based only on facilities in Mississippi that report data for that category. Facilities without available data are excluded from the ranking.Click the rank badge to see the full State ranking.Click here to see the full State ranking.
vs avg

2 of 6 metrics below state avg

Standout metric Physical Therapist is +120% above state avg
Staff type Hours / Day / Resident vs state avg
Registered Nurse (RN) Info RNs hold the highest nursing license and can assess residents, interpret test results, and direct care plans. More RN hours per day often signals stronger clinical oversight and faster response to health changes. 16m per day ▼ 57% State avg: 38m per day · National avg: 41m per day
LPN / LVN Info Licensed Practical Nurses (LPNs) or Licensed Vocational Nurses (LVNs) deliver routine hands-on care — medication administration, wound dressing, and monitoring vital signs. They work under RN supervision and make up a large share of daily bedside care. 1h 9m per day ▲ 5% State avg: 1h 6m per day · National avg: 52m per day
Nurse Aide Info Certified Nurse Aides (CNAs) provide the most direct day-to-day assistance: bathing, dressing, feeding, and mobility. Nurse aide hours are typically the largest staffing category and directly affect residents' quality of life. 2h 36m per day ▲ 5% State avg: 2h 29m per day · National avg: 2h 20m per day
Weekend Total Nursing Info Combined nursing hours (RN + LPN + Nurse Aide) per resident per day on weekends. Staffing often drops on weekends — this figure reveals whether the facility maintains adequate coverage outside of weekday hours. 3h 28m per day ■ Avg State avg: 3h 31m per day · National avg: 3h 26m per day
Physical Therapist Info Hours per resident per day provided by licensed Physical Therapists (PTs) or PT Assistants. PT services help residents recover mobility after injury or illness and are especially important for post-acute (short-stay) rehabilitation. 4m per day ▲ 120% State avg: 2m per day · National avg: 4m per day
Weekend RN Info Registered nurse hours specifically on weekends. Facilities sometimes reduce RN presence on Saturdays and Sundays — a low weekend RN figure compared to weekday hours can indicate reduced clinical oversight when most administrative staff are absent. 10m per day ▼ 56% State avg: 22m per day · National avg: 28m per day

Capacity and availability

Avg. Length of Stay
288 days
Bed community size
230-bed community Rank #1 / 267Bed count — State benchmarkedThis home is ranked 1st out of 267 homes in Mississippi. Shows this facility's certified or reported bed count compared to other Mississippi facilities. Larger communities may offer more amenities, programs, and on-site services for residents and families.Rankings are based only on facilities in Mississippi that report data for that category. Facilities without available data are excluded from the ranking.Click the rank badge to see the full State ranking.Click here to see the full State ranking.
A large-scale community that may provide a wide range of amenities, services, and structured programs.
Walk Score
Walk Score: 28 / 100 Rank #182 / 319Walk Score — State benchmarkedThis home is ranked 182nd out of 319 homes in Mississippi. Shows how walkable this facility's neighborhood is compared to the average Walk Score across Mississippi facilities. Higher scores benefit residents, families, and staff.Rankings are based only on facilities in Mississippi that report data for that category. Facilities without available data are excluded from the ranking.Click the rank badge to see the full State ranking.Click here to see the full State ranking.
Somewhat walkable. A few nearby services may be reachable on foot, but most trips require transportation.

About this community

License Details

Facility TypeNursing Home Facilities
CountyRankin

Ownership & Operating Entity

Brandon Community Carew Center is administered by Felicia Scott.

Payment & Insurance

2 services
Accept Medicaid
Accept Medicare

Therapy & Rehabilitation

1 service
Rehabilitation Services

Staffing & Medical

2 services
Doctor on Staff
24-Hour Staffing

Amenities & Lifestyle

Free In-Room Cable Access
Free Wi-Fi
State-Of-The-Art Therapy Equipment
Friendly Staff
Specific ProgramsSkilled Nursing Services, Outpatient Therapy Services, Rapid Recovery Rehabilitation Suites, Sub-Acute Rehabilitation, Enhancement Therapy, Post Surgery Rehabilitation, Endurance/Strength Training, Sports Medicine / Enhancement Therapy, Stroke Recovery, Cardiac Care, Post-Orthopedic Surgery, Stroke and cardiovascular rehab, Complex Wound Care / Wound Vacs, Respiratory services, Spa with whirlpool tub, Private courtyard, Caring Curls Beauty Salon, Dialysis Care, Clinical Laboratory Services, Dental Services, Podiatry Services, X-Ray Services, Ophthalmologist Services, Ambulation & Transfer Training, Balance/Falls Management, Care for Stroke Survivors, Cerebral Palsy, MS and Parkinson’s, Cognitive Linguistics Therapy, Dysphagia (Swallowing) Therapy, Pain Management, Positioning, Speech/Language Therapy, Strength/endurance training

Contact Brandon Community Carew Center

Inspection History

In Mississippi, the State Department of Health, Bureau of Health Facilities Licensure conducts unannounced surveys to monitor facility compliance with health, safety, and resident rights laws.

Since 2022 · 4 years of data 48 deficiencies 13 inspections

Inspection Scorecard Info This scorecard compares key inspection, deficiency, and complaint metrics at this facility against the Mississippi state average. Metrics rated ≥15% worse than average are highlighted in red; those ≥15% better are highlighted in green.

Since 2022 vs. Mississippi state average
Overall vs. MS average 3 Worse Metrics worse than Mississippi average:
• Total deficiencies (7% above)
• Deficiencies per year (6% above)
• Deficiencies per inspection (311% above)
1 Better Metrics better than Mississippi average:
• Total inspections (74% below)
Latest Inspection January 12, 2026 Complaint Investigation

Deficiencies Info Deficiencies are formal regulatory issues recorded during state inspections.

This Facility MS Average vs. MS Avg
Total deficiencies Info Formal regulatory issues recorded by inspectors across all inspection types. 48 45 This facility has 7% more total deficiencies than a typical Mississippi assisted living residence (48 vs. MS avg 45).↑ 7% worse
Deficiencies per year Info Average deficiencies per year since 2022. 12 11.3 This facility has 6% more deficiencies per year than a typical Mississippi assisted living residence (12 vs. MS avg 11.3).↑ 6% worse
Deficiencies per inspection Info Average deficiencies per inspection. 3.7 0.9 This facility has 311% more deficiencies per inspection than a typical Mississippi assisted living residence (3.7 vs. MS avg 0.9).↑ 311% worse

Inspections Info State inspections evaluate whether the facility meets health and safety standards.

This Facility MS Average vs. MS Avg
Total inspections Info Combined count of all routine and focused inspections. Excludes complaint investigations. 13 50 This facility has 74% fewer total inspections than a typical Mississippi assisted living residence (13 vs. MS avg 50).↓ 74% better

Health Inspection History

Inspections since 2022
Total health inspections 11

State average N/A


Last Health inspection on Jul 2025

Total health citations
43 Rank #117 / 120Health citations — State benchmarkedThis home is ranked 117th out of 120 homes in Mississippi. Shows this facility's total health deficiency citations benchmarked to the Mississippi State average, with a ranking across all 120 MS facilities. Lower citation counts earn a better rank.Rankings are based only on facilities in Mississippi that report data for that category. Facilities without available data are excluded from the ranking.Click the rank badge to see the full State ranking.Click here to see the full State ranking.

State average N/A

Citations per inspection
3.91 Rank #66 / 120Citations per inspection — State benchmarkedThis home is ranked 66th out of 120 homes in Mississippi. Shows average deficiency citations per CMS inspection for this facility versus the Mississippi mean across 120 facilities with citation data. Lower is better.Rankings are based only on facilities in Mississippi that report data for that category. Facilities without available data are excluded from the ranking.Click the rank badge to see the full State ranking.Click here to see the full State ranking.

State average N/A


Health citations are formal notices following inspections when they fail to comply with safety and care standards.

18 of 43 citations resulted from standard inspections; 22 of 43 resulted from complaint investigations; and 3 of 43 came from combined inspections (standard and complaint).

Breakdown of citation severity (last 4 years)
Critical health citations
6
In line with State average

State average: N/A


Serious health citations
4
In line with State average

State average: N/A

6 critical citations State average: N/A

4 serious citations State average: N/A

33 moderate citations State average: N/A

0 minor citations State average: N/A
Citations history (last 4 years)
Nutrition moderate citation Jul 31, 2025
Corrected

Nutrition moderate citation Jul 31, 2025
Corrected

Quality of Care moderate citation Jul 31, 2025
Corrected

Resident Rights moderate citation Jul 31, 2025
Corrected

Staffing Data

Reporting period: October 1 – December 31, 2025 (Q4 2025). Source: CMS Payroll-Based Journal report.

Total staff 285
Employees 283
Contractors 2
Staff to resident ratio 1.39 : 1
0% compared with State average

State average ratio: 0 : 0

Avg staff/day 108
Average shift 8.7 hours
0% compared with State average

State average: 0 hours

Total staff hours (quarter) 86,023

Nursing staff breakdown

Q4 2025 · Oct 1 – Dec 31 More info This data comes from the CMS Payroll-Based Journal report covering October 1 – December 31, 2025.
Registered Nurse

Manages medical care and health needs.

RN Staff Info All 9 RN Staff are full-time employees. No contractors work on this role. 9
Average shift length Info Average shift length. Calculated as total hours divided by days worked and average staff per day. 9.6 hours
Licensed Practical Nurse

Assists with medical care and medications.

LPN Staff Info All 51 LPN Staff are full-time employees. No contractors work on this role. 51
Average shift length Info Average shift length. Calculated as total hours divided by days worked and average staff per day. 9.2 hours
Certified Nursing Assistant

Helps with daily care and mobility.

CNA Staff Info All 147 CNA Staff are full-time employees. No contractors work on this role. 147
Average shift length Info Average shift length. Calculated as total hours divided by days worked and average staff per day. 8.9 hours

Contractor staffing

Q4 2025 · Oct 1 – Dec 31 More info This data comes from the CMS Payroll-Based Journal report covering October 1 – December 31, 2025.
Total hours from contractors 0% — all staff are direct employees this quarter

Staff by category

Q4 2025 · Oct 1 – Dec 31 More info This data comes from the CMS Payroll-Based Journal report covering October 1 – December 31, 2025.
Certified Nursing Assistant 147 0 147 44,997 92 100% 8.9
Licensed Practical Nurse 51 0 51 19,778 92 100% 9.2
Nurse Aide in Training 10 0 10 3,157 92 100% 7.9
Physical Therapist 17 0 17 2,381 31 34% 7.8
Registered Nurse 9 0 9 2,297 92 100% 9.6
Clinical Nurse Specialist 7 0 7 2,282 78 85% 7.8
RN Director of Nursing 6 0 6 1,621 79 86% 8.1
Respiratory Therapy Technician 5 0 5 1,353 72 78% 7.2
Dental Services Staff 3 0 3 1,155 67 73% 7.8
Speech Language Pathologist 4 0 4 1,080 69 75% 5.7
Qualified Social Worker 4 0 4 995 74 80% 6.7
Physical Therapy Aide 3 0 3 870 70 76% 6.8
Mental Health Service Worker 2 0 2 746 64 70% 7.7
Administrator 3 0 3 744 64 70% 8
Other Dietary Services Staff 1 0 1 591 70 76% 8.4
Nurse Practitioner 1 0 1 485 61 66% 8
Occupational Therapy Aide 1 0 1 471 61 66% 7.7
Dietitian 1 0 1 440 60 65% 7.3
Therapeutic Recreation Specialist 3 0 3 299 22 24% 7.3
Physical Therapy Assistant 5 0 5 264 23 25% 5.5
Medical Director 0 1 1 13 7 8% 1.9
Occupational Therapy Assistant 0 1 1 5 1 1% 4.5
147 Certified Nursing Assistant
% of Days 100%
51 Licensed Practical Nurse
% of Days 100%
10 Nurse Aide in Training
% of Days 100%
17 Physical Therapist
% of Days 34%
9 Registered Nurse
% of Days 100%
7 Clinical Nurse Specialist
% of Days 85%
6 RN Director of Nursing
% of Days 86%
5 Respiratory Therapy Technician
% of Days 78%
3 Dental Services Staff
% of Days 73%
4 Speech Language Pathologist
% of Days 75%
4 Qualified Social Worker
% of Days 80%
3 Physical Therapy Aide
% of Days 76%
2 Mental Health Service Worker
% of Days 70%
3 Administrator
% of Days 70%
1 Other Dietary Services Staff
% of Days 76%
1 Nurse Practitioner
% of Days 66%
1 Occupational Therapy Aide
% of Days 66%
1 Dietitian
% of Days 65%
3 Therapeutic Recreation Specialist
% of Days 24%
5 Physical Therapy Assistant
% of Days 25%
1 Medical Director
% of Days 8%
1 Occupational Therapy Assistant
% of Days 1%

Penalties and fines

Includes penalties issued in 2025

Federal penalties imposed by CMS for regulatory violations, including civil money penalties (fines) and denials of payment for new Medicare/Medicaid admissions.

Source: CMS Penalties Database (Data as of Jan 2026)

Total fines amount $90K Rank #116 / 121Federal fines — State benchmarkedThis home is ranked 116th out of 121 homes in Mississippi. Shows this facility's cumulative CMS federal fine dollars versus the Mississippi average among facilities with fines, and where it ranks among 121 facilities in the pool. Lower total dollars mean a better rank.Rankings are based only on facilities in Mississippi that report data for that category. Facilities without available data are excluded from the ranking.Click the rank badge to see the full State ranking.Click here to see the full State ranking.
128% higher than State average

State average: $39K

Number of fines 1
50% fewer fines than State average

State average: 2.0

Payment Denials Info Serious action where Medicare and/or Medicaid temporarily stops payments for new residents until issues are fixed. 1
340% more payment denials than State average

State average: 0.2

Fines amount comparison
This facility $90K
State average $39K
Penalty History

Penalties are imposed by CMS for violations of federal nursing home regulations.

2 penalties in the past 3 years

Multiple penalties were reported in the last 3 years.

Civil Money Penalty Info Fines imposed for noncompliance, which can be assessed per day or per instance of violation. Jan 31, 2025
$90K
Payment Denial Info Serious action where Medicare and/or Medicaid temporarily stops payments for new residents until issues are fixed. Jan 31, 2025
37 days

Last updated: Jan 2026

Quality of care over time

These measures show how residents usually do over time at this home, based on health outcomes and preventive care.

High-risk clinical events score Info A composite score based on pressure ulcers, falls with injury, weight loss, walking ability decline, and activities of daily living decline. 10.9
12% better than State average

State average: 12.4

Functional decline score Info A composite score based on activities of daily living decline, walking ability decline, and incontinence. 16.3
27% better than State average

State average: 22.3

Long-stay resident measures
Below average Info CMS star rating based on long-stay quality measure performance. 5 stars = significantly above average, 1 star = significantly below average.
Need for Help with Daily Activities Increased Info Percent of long-stay residents whose need for help with daily activities has increased 14.7%
30% better than State average

State average: 21.2%

Walking Ability Worsened Info Percent of long-stay residents whose ability to move independently worsened 17.2%
30% better than State average

State average: 24.5%

Low Risk Residents with Bowel/Bladder Incontinence Info Percent of low risk long-stay residents who lose control of their bowels or bladder 16.8%
21% better than State average

State average: 21.4%

Falls with Major Injury Info Percent of long-stay residents experiencing one or more falls with major injury 1.7%
46% better than State average

State average: 3.2%

High Risk Residents with Pressure Ulcers Info Percent of long-stay high risk residents with pressure ulcers 6.4%
11% better than State average

State average: 7.1%

Urinary Tract Infection Info Percent of long-stay residents with a urinary tract infection 2.5%
In line with State average

State average: 2.6%

Lost Too Much Weight Info Percent of long-stay residents who lose too much weight 14.2%
128% worse than State average

State average: 6.2%

Depressive Symptoms Info Percent of long-stay residents who have depressive symptoms 0.6%
64% better than State average

State average: 1.5%

Antipsychotic Use Info Percent of long-stay residents who received an antipsychotic medication 28.8%
36% worse than State average

State average: 21.2%

Pneumococcal Vaccine Info Percent of long-stay residents assessed and appropriately given the pneumococcal vaccine 74.2%
23% worse than State average

State average: 95.9%

Influenza Vaccine Info Percent of long-stay residents assessed and appropriately given the seasonal influenza vaccine 50.5%
48% worse than State average

State average: 97.0%

Hospitalizations per 1,000 days Info Number of hospitalizations per 1,000 long-stay resident days. 2.92
20% worse than State average

State average: 2.44

ED visits per 1,000 days Info Number of outpatient emergency department visits per 1,000 long-stay resident days. 2.76
In line with State average

State average: 2.88

Short-stay resident measures
Significantly below average Info CMS star rating based on short-stay quality measure performance. 5 stars = much above average, 1 star = much below average.
Pneumococcal Vaccine Info Percent of short-stay residents assessed and appropriately given the pneumococcal vaccine 69.6%
21% worse than State average

State average: 87.9%

Antipsychotic medication increase Info Percent of short-stay residents who newly received an antipsychotic medication 3.1%
22% worse than State average

State average: 2.5%

Influenza Vaccine Info Percent of short-stay residents assessed and appropriately given the seasonal influenza vaccine 50.4%
40% worse than State average

State average: 84.6%

Re-hospitalized after SNF stay Info Percentage of short-stay residents who were re-hospitalized after their nursing home admission. 35.6%
28% worse than State average

State average: 27.9%

Emergency department visits Info Percentage of short-stay residents who had an outpatient emergency department visit. 12.9%
16% better than State average

State average: 15.3%

Falls with major injury Info Percentage of SNF residents who experience falls with major injury during their stay. 0.7%
14% better than State average

State average: 0.8%

Ability to care for self at discharge Info Percentage of residents at or above expected ability to care for themselves at discharge. 49.4%
8% worse than State average

State average: 53.7%

Successful return to home or community Info Rate of successful return to home or community from a skilled nursing facility. 37.1%
27% worse than State average

State average: 50.6%

Breakdown by payment type

Medicare

46% of new residents, usually for short-term rehab.

Typical stay 2 - 3 months

Private pay

37% of new residents, often for short stays.

Typical stay 3 - 4 months

Medicaid

16% of new residents, often for long-term daily care.

Typical stay 3 - 4 years

Facility Characteristics

Source: CMS Long-Term Care Facility Characteristics (Data as of Jan 2026)

Total residents 205
Medicare
20
9.8% of residents
Medicaid
150
73.2% of residents
Private pay or other
35
17.1% of residents
Programs & Services
Residents Group

Residents meet regularly to discuss policies, care quality, and activities

Nurse Aide Training

State-approved Nurse Aide Training and Competency Evaluation Program on-site

CCRC

Part of a Continuing Care Retirement Community offering multiple care levels

Active Resident Council

Organized group of residents that meets regularly to discuss facility policies, quality of life, and activities.

Finances and operations

Based on CMS SNF Cost Report for fiscal year ending in 12/2023.

For-profit
Operated by a single business entity.
Net patient revenue Info Net patient revenue — what the home actually collects for resident care, after contractual allowances, bad debt and discounts are subtracted from its gross charges (CMS cost report, Worksheet G-3). It covers resident care only; money the home earns from other sources is shown separately as "Other income."
$21.3M
Net patient income Info Net patient income: net patient revenue minus the home's total operating expenses. A positive figure means it earns more from resident care than it spends to deliver it; a negative figure means the opposite. It excludes non-operating "other income."
$559.3K
For-profit Operated by a single business entity.
Net patient revenue Info Net patient revenue — what the home actually collects for resident care, after contractual allowances, bad debt and discounts are subtracted from its gross charges (CMS cost report, Worksheet G-3). It covers resident care only; money the home earns from other sources is shown separately as "Other income."
$21.3M Rank #3 / 113Revenue — State benchmarkedThis home is ranked 3rd out of 113 homes in Mississippi. Shows this facility's annual revenue compared to the Mississippi average. Higher revenue generally means more resources for staffing and capital — read alongside Payroll %.Rankings are based only on facilities in Mississippi that report data for that category. Facilities without available data are excluded from the ranking.Click the rank badge to see the full State ranking.Click here to see the full State ranking.
Net patient income Info Net patient income: net patient revenue minus the home's total operating expenses. A positive figure means it earns more from resident care than it spends to deliver it; a negative figure means the opposite. It excludes non-operating "other income."
$559.3K
Other income Info Money the home earns outside of resident care — such as investments, grants, rentals and other non-operating sources (CMS cost report, Worksheet G-3). It is tracked separately from net patient revenue: it is not part of that figure, and it is not included in net patient income.
$119.1K
Payroll costs Info Staff salaries plus wage-related costs — benefits such as payroll taxes, health insurance and retirement — from the home's own accounting records (CMS cost report, Worksheet A). Contract or agency labor is counted separately, under other operating costs. Rank #1 / 113Payroll — State benchmarkedThis home is ranked 1st out of 113 homes in Mississippi. Shows total annual staff payroll benchmarked to the Mississippi average. Higher payroll investment relative to peers often signals better staffing and less reliance on cheaper contract labor.Rankings are based only on facilities in Mississippi that report data for that category. Facilities without available data are excluded from the ranking.Click the rank badge to see the full State ranking.Click here to see the full State ranking.
$9.7M 45.4% of net patient revenue Info Payroll as a share of revenue: staff salaries and wage-related benefits divided by net patient revenue. A higher figure means more of each revenue dollar goes to staff pay. Rank #27 / 113Payroll % — State benchmarkedThis home is ranked 27th out of 113 homes in Mississippi. Shows payroll as a percentage of revenue versus the Mississippi average. Well-run Mississippi facilities typically land around 51–70% — the top third Statewide. Below 25% may signal understaffing or heavy agency use — read with Staffing ratings.Rankings are based only on facilities in Mississippi that report data for that category. Facilities without available data are excluded from the ranking.Click the rank badge to see the full State ranking.Click here to see the full State ranking.
Other operating costs Info Everything it costs to run the home apart from payroll — food, utilities, supplies, maintenance, contract labor and administration. Calculated as total operating expense minus payroll (staff salaries and wage-related benefits).
$11.1M
Total costs Info The home's total operating expense for the year — all the costs of running it, salaries included (CMS cost report, Worksheet G-3).
$20.7M

Who this home usually serves

TYPE OF STAY

Mostly short-term rehab stays

Most residents typically stay for a few weeks or months before returning home or moving on.

New residents most often arrive under Medicare (46% of admissions), and a typical Medicare stay runs around 2 - 3 months.

Admissions
267 total

Coverage residents most often arrive under.

Medicare 46%
Private pay 37%
Medicaid 16%
Discharges
263 total

Coverage residents most often leave under.

Medicare 58%
Private pay 16%
Medicaid 26%

Places of interest near Brandon Community Carew Center

Address 0.0 miles from city center Info Estimated distance in miles from Brandon's city center to Brandon Community Carew Center's address, calculated via Google Maps.

Calculate Travel Distance to Brandon Community Carew Center

Add your location

Address

Compare Nursing Homes around the area

The information below is reported by the Mississippi State Department of Health, Bureau of Health Facilities Licensure.

Brandon Community Carew Center
NH
AL
Brandon - 230 - 28 -
Traceway Retirement Community
NH
AL
IL
MC
Tupelo (West Main Street) - 140 - 43 Private Rooms / Semi-Private Rooms
Forrest General Hospital Skilled Nursing Unit
NH
AL
MC
Hattiesburg (Parkhaven) - 29 - 67 Private Rooms
Bedford Care Center of Petal
NH
AL
Petal - 60 - 27 -
Bedford Care Center of Hattiesburg
NH
AL
Hattiesburg (Medical Boulevard) - 100 - 54 -

Frequently Asked Questions about Brandon Community Carew Center

Is Brandon Community Carew Center in a walkable area?

Brandon Community Carew Center has a walk score of 28. Somewhat walkable. A few nearby services may be reachable on foot, but most trips require transportation.

What is the occupancy rate at Brandon Community Carew Center?

Brandon Community Carew Center's occupancy is 90.4%.

Does Brandon Community Carew Center operate as a for-profit or non-profit?

Brandon Community Carew Center is registered as a for-profit in MS.

Who is the administrator of Brandon Community Carew Center?

Felicia Scott is the administrator of Brandon Community Carew Center.

How many beds does Brandon Community Carew Center have?

Brandon Community Carew Center has 230 beds.

Are there photos of Brandon Community Carew Center?

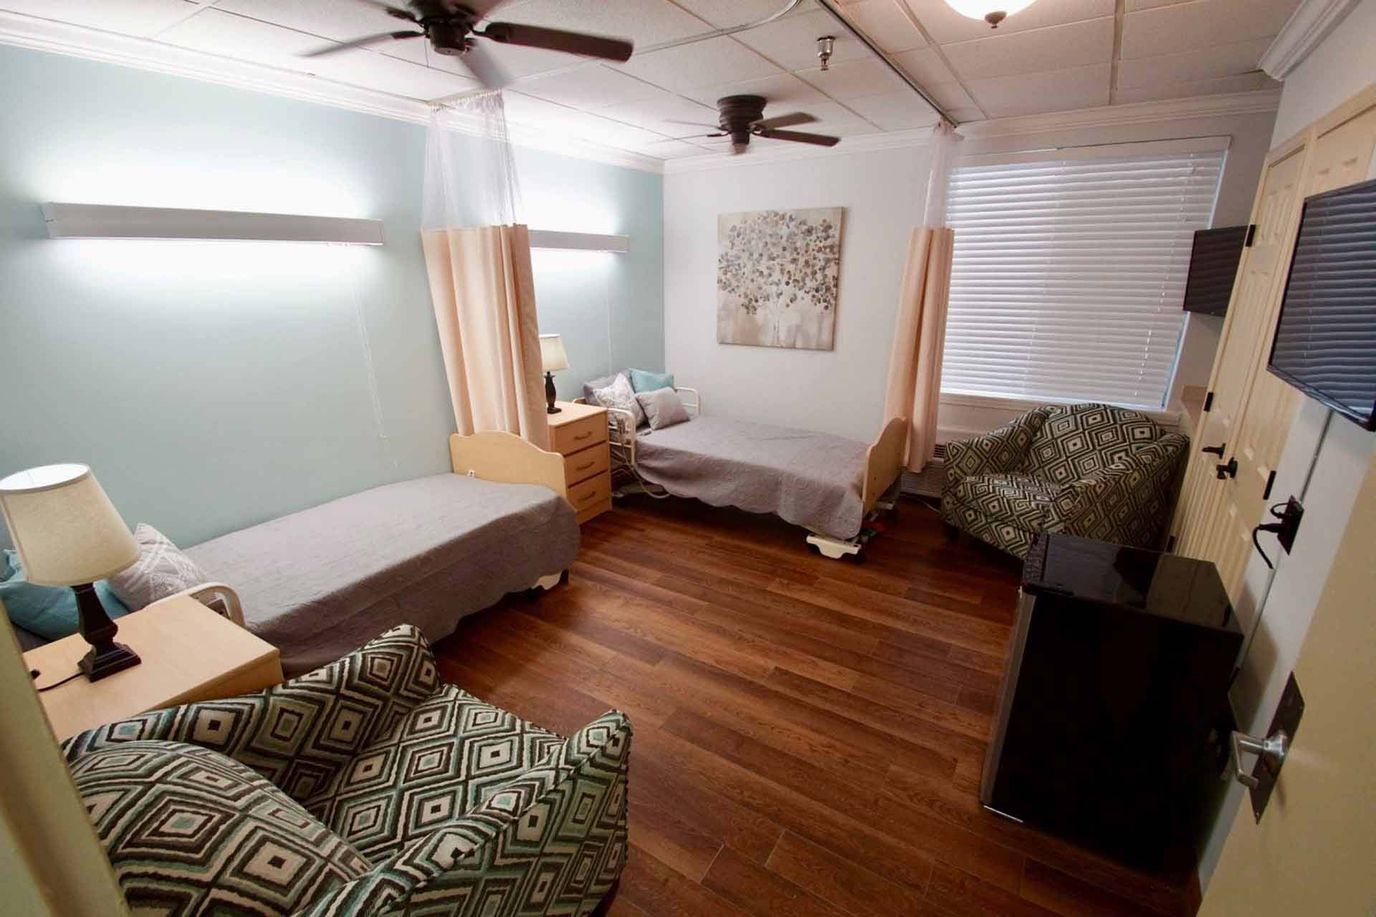
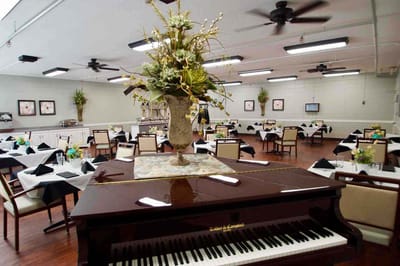
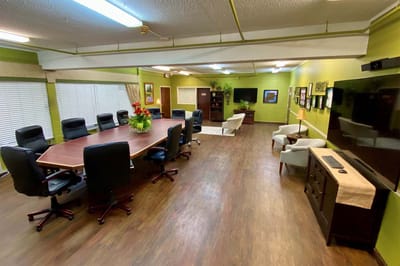
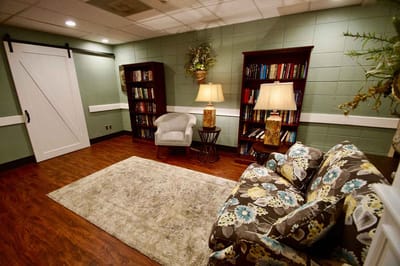
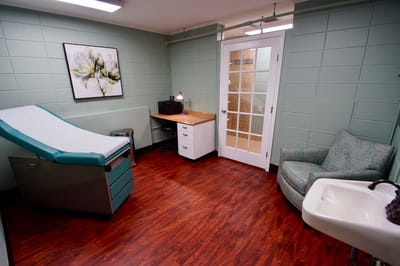
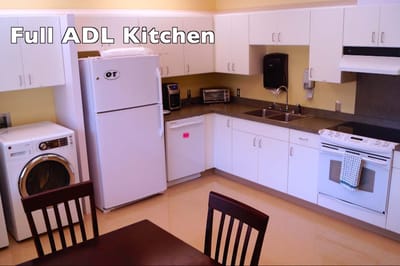
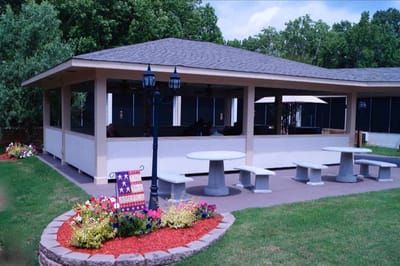
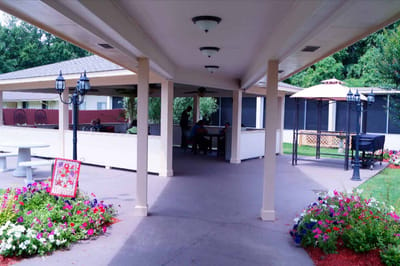
Yes — there are 9 photos of Brandon Community Carew Center in the photo gallery on this page.

What is the address of Brandon Community Carew Center?

Brandon Community Carew Center is located at 355 Crossgate Boulevard, Brandon, MS 39042.

Guides for Better Senior Living

Care Cost Calculator: See Prices in Your Area

Nursing Home Data Explorer

Don’t Wait Too Long: 7 Red Flag Signs Your Parent Needs Assisted Living Now

The True Cost of Assisted Living in 2025 – And How Families Are Paying For It

Understanding Senior Living Costs: Pricing Models, Discounts & Financial Assistance