


Total staff
223
Employees
218
Contractors
5
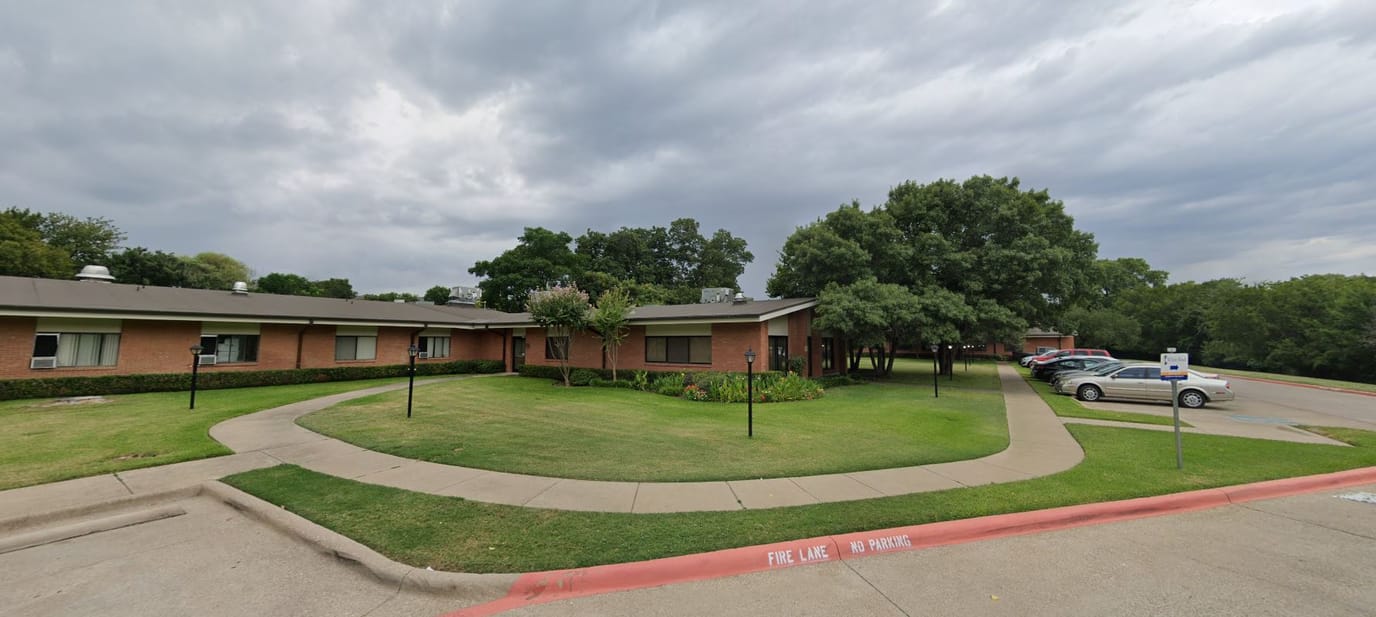
Diversicare of Lake Highlands occupies 9009 White Rock Trail in Dallas’s Lake Highlands neighborhood, operating 280 beds across nursing home, assisted living, and memory care units. The facility, operated by Dallas I Enterprises, accepts Medicare, Medicaid, and private-pay residents and sits 11.9 miles from downtown Dallas and 1.99 miles from Texas Health Presbyterian Hospital. Walk score is 16, requiring car transportation for most errands. Occupancy runs at 57.2%, below the Texas state average.
The resident population is overwhelmingly Medicaid (85.9%), with minimal Medicare (4.3%) or private-pay (9.8%) presence. Financial performance improved, generating a $614,500 surplus in 2024 (4.1% margin). Average stay is 175 days.
The facility holds a 1-star overall CMS rating. Health inspection performance is rated 1 star, 63.8% below the Texas average, reflecting significant deficiency findings.
Staffing also earns a 1-star rating, 52.9% below state average. Adjusted nursing hours total 3 hours 1 minute per resident daily across all roles, placing the facility 248th of 289 in Texas. Registered nurses provide 20 minutes daily (23% below state average); licensed practical nurses 52 minutes (9% below); and certified nursing assistants 1 hour 54 minutes (6% below).
Four federal civil money penalties issued over three years, totaling $55,000, indicate repeated compliance violations at roughly double the typical frequency for Texas facilities.
Long-stay residents show strength in functional stability, pressure ulcer prevention, and infection control. Vaccination rates reach 100%. However, 5.4% of long-stay residents suffer depressive symptoms, 88% worse than state benchmarks. Short-stay rehabilitation outcomes are weak: 2.7% experienced major falls; nearly triple the state average, and only 25.4% achieved successful return to home or community, 50% below the state norm.
Diversicare serves primarily long-term Medicaid residents, with below-average staffing levels, repeated regulatory violations, and rehabilitation outcomes that underperform state standards significantly.
| Staff type | Hours / Day / Resident | vs state avg |
|---|---|---|
|
Registered Nurse (RN)
| 23m per day | ▼ 13% State avg: 26m per day · National avg: 41m per day |
|
LPN / LVN
| 53m per day | ▼ 7% State avg: 57m per day · National avg: 52m per day |
|
Nurse Aide
| 2h 8m per day | ▲ 5% State avg: 2h 1m per day · National avg: 2h 21m per day |
|
Weekend Total Nursing
| 2h 48m per day | ▼ 6% State avg: 2h 59m per day · National avg: 3h 26m per day |
|
Physical Therapist
| 4m per day | ▼ 3% State avg: 4m per day · National avg: 4m per day |
|
Weekend RN
| 17m per day | ▼ 21% State avg: 21m per day · National avg: 29m per day |
Reporting period: October 1 – December 31, 2025 (Q4 2025). Source: CMS Payroll-Based Journal report.
Manages medical care and health needs.
Assists with medical care and medications.
Helps with daily care and mobility.
Total hours from contractors
331 contractor hours this quarter
| Certified Nursing Assistant | 87 | 0 | 87 | 25,499 | 92 | 100% | 9.1 |
| Licensed Practical Nurse | 43 | 0 | 43 | 10,615 | 92 | 100% | 9.3 |
| Medication Aide/Technician | 21 | 0 | 21 | 8,410 | 92 | 100% | 10.9 |
| Registered Nurse | 14 | 3 | 17 | 4,818 | 92 | 100% | 9.3 |
| RN Director of Nursing | 13 | 0 | 13 | 3,487 | 81 | 88% | 10 |
| Physical Therapy Aide | 5 | 0 | 5 | 1,407 | 79 | 86% | 8 |
| Clinical Nurse Specialist | 3 | 0 | 3 | 1,151 | 78 | 85% | 9.8 |
| Respiratory Therapy Technician | 4 | 0 | 4 | 1,030 | 66 | 72% | 8.8 |
| Speech Language Pathologist | 4 | 0 | 4 | 972 | 77 | 84% | 8.3 |
| Qualified Social Worker | 8 | 0 | 8 | 846 | 66 | 72% | 6 |
| Dietitian | 2 | 0 | 2 | 605 | 79 | 86% | 7.7 |
| Physical Therapy Assistant | 4 | 0 | 4 | 534 | 57 | 62% | 7.3 |
| Therapeutic Recreation Specialist | 2 | 0 | 2 | 513 | 62 | 67% | 8.3 |
| Administrator | 1 | 0 | 1 | 496 | 62 | 67% | 8 |
| Mental Health Service Worker | 3 | 0 | 3 | 462 | 52 | 57% | 8.5 |
| Other Dietary Services Staff | 2 | 0 | 2 | 356 | 50 | 54% | 7.1 |
| Dental Services Staff | 1 | 0 | 1 | 325 | 36 | 39% | 9 |
| Occupational Therapy Aide | 0 | 1 | 1 | 72 | 15 | 16% | 4.8 |
| Nurse Practitioner | 1 | 0 | 1 | 32 | 4 | 4% | 8 |
| Medical Director | 0 | 1 | 1 | 6 | 3 | 3% | 2 |
Includes penalties issued in 2023-2025
Federal penalties imposed by CMS for regulatory violations, including civil money penalties (fines) and denials of payment for new Medicare/Medicaid admissions.
Source: CMS Penalties Database (Data as of Jan 2026)
Texas average: $80K
Texas average: 2.5
Texas average: 0.2
Penalties are imposed by CMS for violations of federal nursing home regulations.
4 penalties in the past 3 years
Multiple penalties were reported in the last 3 years.
Last updated: Jan 2026
These measures show how residents usually do over time at this home, based on health outcomes and preventive care.
Texas average: 8.6
Texas average: 16.0
Texas average: 16.2%
Texas average: 16.2%
Texas average: 15.7%
Texas average: 3.2%
Texas average: 4.4%
Texas average: 0.8%
Texas average: 3.5%
Texas average: 2.9%
Texas average: 7.9%
Texas average: 97.3%
Texas average: 97.9%
Texas average: 2.13
Texas average: 2.07
Texas average: 90.4%
Texas average: 1.4%
Texas average: 88.0%
Texas average: 25.9%
Texas average: 12.0%
Texas average: 0.8%
Texas average: 53.7%
Texas average: 50.6%
Quality measures are calculated from Minimum Data Set (MDS) assessments. For most measures, lower percentages indicate better care quality.
23% of new residents, usually for short-term rehab.
22% of new residents, often for short stays.
55% of new residents, often for long-term daily care.
Source: CMS Long-Term Care Facility Characteristics (Data as of Jan 2026)
Residents meet regularly to discuss policies, care quality, and activities
Family members meet regularly to discuss policies, care quality, and activities
Organized group of family members that meets regularly to discuss facility policies, resident care, and activities.
Organized group of residents that meets regularly to discuss facility policies, quality of life, and activities.
Data sourced from CMS Long-Term Care Facility Characteristics quarterly report. Payer mix reflects the current resident census by primary payment source.
Historical financial and operational data for Diversicare of Lake Highlands from 2012–2024, based on CMS SNF Cost Reports.
Key figures below are for fiscal year ending in 03/2024.
Based on CMS SNF Cost Report for fiscal year ending in 03/2024.
Housing Options: Private Rooms
Building Type: Single-story
Transportation Services
Fitness and Recreation
Most residents stay for extended periods and receive ongoing daily care.
Most new residents arrive under Medicaid (55% of admissions), and a typical Medicaid stay runs around 9 - 10 months.
Coverage residents most often arrive under.
Coverage residents most often leave under.
![]() 7.6 miles from city center
7.6 miles from city center
![]() Estimated distance in miles from Dallas's city center to Diversicare of Lake Highlands's address, calculated via Google Maps.
— 1.99 miles to nearest hospital (Texas Health Presbyterian Hospital Dallas)
Estimated distance in miles from Dallas's city center to Diversicare of Lake Highlands's address, calculated via Google Maps.
— 1.99 miles to nearest hospital (Texas Health Presbyterian Hospital Dallas)
Add your location
The information below is reported by the Texas Health and Human Services Commission.
| The Legacy Midtown Park | NH AL HOS IL MC SNF | Dallas (Vickery Meadow) | 98
Facility
98
TX AVG
80
Rank
#376 / 988 |
87.5%
Facility
87.5%
TX AVG
63.5%
Rank
#31 / 304 | +38% | 5.42
Facility
5.42
TX AVG
3.63
Rank
#14 / 296 | +1% | +49% | $27.5k
Facility
$27.5k
TX AVG
$81.8k
Rank
#168 / 301 | 4
Facility
4
TX AVG
25.9
Rank
#2 / 299 | 1.3
Facility
1.3
TX AVG
3.7
Rank
#2 / 299 | - | 48 | - |
45
Facility
45
TX AVG
41
Rank
#628 / 1391 | The Legacy Midtown Park Inc | $16.1MFiscal year ending 09/2023
Facility
$16.1MFiscal year ending 09/2023
TX AVG
$8.4M
Rank
#9 / 304 | $15.0MFiscal year ending 09/2023
Facility
$15.0MFiscal year ending 09/2023
TX AVG
$3.5M
Rank
#9 / 304 | 93%Fiscal year ending 09/2023
Facility
93%Fiscal year ending 09/2023
TX AVG
47%
Rank
#214 / 304 | 676489 | ||||
| Presbyterian Village North | NH AL IL MC RC SNF | Dallas (Lake Highlands) | 88
Facility
88
TX AVG
80
Rank
#441 / 988 |
31.1%
Facility
31.1%
TX AVG
63.5%
Rank
#282 / 304 | -51% | 4.80
Facility
4.80
TX AVG
3.63
Rank
#26 / 296 | +20% | +32% | $36.5k
Facility
$36.5k
TX AVG
$81.8k
Rank
#189 / 301 | 18
Facility
18
TX AVG
25.9
Rank
#103 / 299 | 2.3
Facility
2.3
TX AVG
3.7
Rank
#48 / 299 | 2 | 69 | - |
61
Facility
61
TX AVG
41
Rank
#269 / 1391 | Dustin Allen | $11.4MFiscal year ending 12/2023
Facility
$11.4MFiscal year ending 12/2023
TX AVG
$8.4M
Rank
#5 / 304 | $20.1MFiscal year ending 12/2023
Facility
$20.1MFiscal year ending 12/2023
TX AVG
$3.5M
Rank
#4 / 304 | 176.3%Fiscal year ending 12/2023
Facility
176.3%Fiscal year ending 12/2023
TX AVG
47%
Rank
#229 / 304 | 676135 | ||||
| C C Young Memorial Home | NH AL HC HOS IL MC PC SNF | Dallas | 129
Facility
129
TX AVG
80
Rank
#143 / 988 |
76.5%
Facility
76.5%
TX AVG
63.5%
Rank
#100 / 304 | +21% | 4.91
Facility
4.91
TX AVG
3.63
Rank
#22 / 296 | +8% | +35% | $0
Facility
$0
TX AVG
$81.8k
Rank
#1 / 301 | 6
Facility
6
TX AVG
25.9
Rank
#8 / 299 | 1.5
Facility
1.5
TX AVG
3.7
Rank
#6 / 299 | - | 117 | - |
20
Facility
20
TX AVG
41
Rank
#1094 / 1391 | C. C. Young Memorial Home | $30.1MFiscal year ending 03/2024
Facility
$30.1MFiscal year ending 03/2024
TX AVG
$8.4M
Rank
#4 / 304 | $28.1MFiscal year ending 03/2024
Facility
$28.1MFiscal year ending 03/2024
TX AVG
$3.5M
Rank
#1 / 304 | 93.2%Fiscal year ending 03/2024
Facility
93.2%Fiscal year ending 03/2024
TX AVG
47%
Rank
#76 / 304 | 675592 | ||||
| Christian Care Communities and Services – Mesquite | NH AL IL MC RC SNF | Mesquite | 180
Facility
180
TX AVG
80
Rank
#26 / 988 |
40.3%
Facility
40.3%
TX AVG
63.5%
Rank
#273 / 304 | -36% | 3.66
Facility
3.66
TX AVG
3.63
Rank
#111 / 296 | +32% | +1% | $28.9k
Facility
$28.9k
TX AVG
$81.8k
Rank
#170 / 301 | 16
Facility
16
TX AVG
25.9
Rank
#76 / 299 | 1.6
Facility
1.6
TX AVG
3.7
Rank
#7 / 299 | 4 | 100 | - |
31
Facility
31
TX AVG
41
Rank
#914 / 1391 | Ccc Mesquite Management LLC | $8.4MFiscal year ending 12/2023
Facility
$8.4MFiscal year ending 12/2023
TX AVG
$8.4M
Rank
#24 / 304 | $11.6MFiscal year ending 12/2023
Facility
$11.6MFiscal year ending 12/2023
TX AVG
$3.5M
Rank
#13 / 304 | 137.7%Fiscal year ending 12/2023
Facility
137.7%Fiscal year ending 12/2023
TX AVG
47%
Rank
#61 / 304 | 455617 | ||||
| Diversicare of Lake Highlands | NH MC SNF | Dallas (Lake Highlands) | 280
Facility
280
TX AVG
80
Rank
#2 / 988 |
57.2%
Facility
57.2%
TX AVG
63.5%
Rank
#215 / 304 | -10% | 3.02
Facility
3.02
TX AVG
3.63
Rank
#255 / 296 | -1% | -17% | $72.4k
Facility
$72.4k
TX AVG
$81.8k
Rank
#233 / 301 | 45
Facility
45
TX AVG
25.9
Rank
#264 / 299 | 2.7
Facility
2.7
TX AVG
3.7
Rank
#83 / 299 | 4 | 173 | - |
16
Facility
16
TX AVG
41
Rank
#1153 / 1391 | Dallas I Enterprises | $13.2MFiscal year ending 03/2024
Facility
$13.2MFiscal year ending 03/2024
TX AVG
$8.4M
Rank
#45 / 304 | $9.6MFiscal year ending 03/2024
Facility
$9.6MFiscal year ending 03/2024
TX AVG
$3.5M
Rank
#33 / 304 | 72.5%Fiscal year ending 03/2024
Facility
72.5%Fiscal year ending 03/2024
TX AVG
47%
Rank
#75 / 304 | 455895 |
Diversicare of Lake Highlands is located in Dallas, Texas.
Here are the financial assistance programs available to residents in Texas.
Diversicare of Lake Highlands is in the Lake Highlands neighborhood.
Diversicare of Lake Highlands has a walk score of 16. Car-dependent. Most errands require a car, with limited nearby walkable options.
Diversicare of Lake Highlands's occupancy is 57.2%.
Diversicare of Lake Highlands is registered as a for-profit.
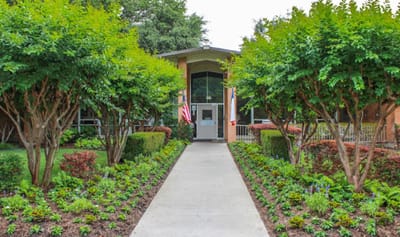
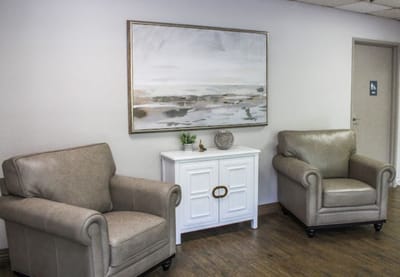
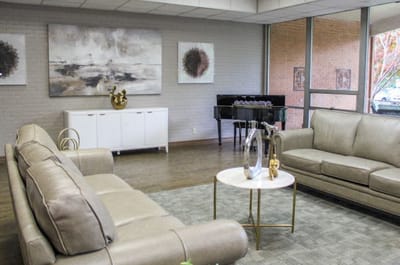
Yes — there are 4 photos of Diversicare of Lake Highlands in the photo gallery on this page.
Diversicare of Lake Highlands is located at 9009 White Rock Trail, Dallas, TX 75238.
(214) 348-8100 will put you in contact with the team at Diversicare of Lake Highlands.
Care Cost Calculator: See Prices in Your Area
Nursing Home Data Explorer
Don’t Wait Too Long: 7 Red Flag Signs Your Parent Needs Assisted Living Now
The True Cost of Assisted Living in 2025 – And How Families Are Paying For It
Understanding Senior Living Costs: Pricing Models, Discounts & Financial Assistance


