Evergreen Post Acute
Nursing Home · Portland, OR
CMS overall rating Info The Overall CMS Rating is scored from 1 to 5 stars and combines results from health inspections, staffing levels, and quality measures. Health inspections carry the most weight. Staffing and quality scores can increase or decrease the final rating based on performance compared to state and national standards.

Evergreen Post Acute

Nursing Home · Portland, OR
CMS overall rating Info The Overall CMS Rating is scored from 1 to 5 stars and combines results from health inspections, staffing levels, and quality measures. Health inspections carry the most weight. Staffing and quality scores can increase or decrease the final rating based on performance compared to state and national standards.
Calculator: See prices in your area
Evergreen Post Acute accepts Medicare, Medicaid, and private pay.

Overview of Evergreen Post Acute

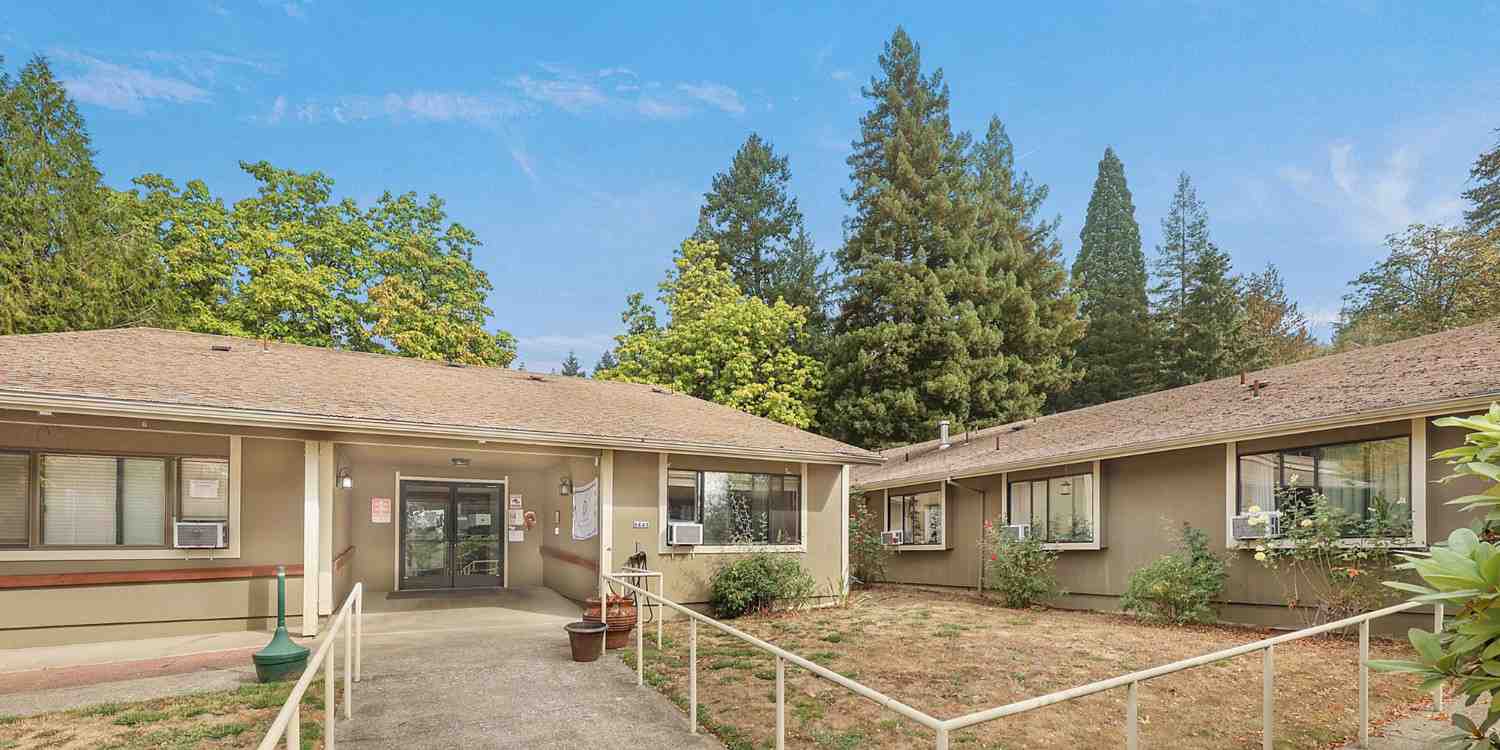
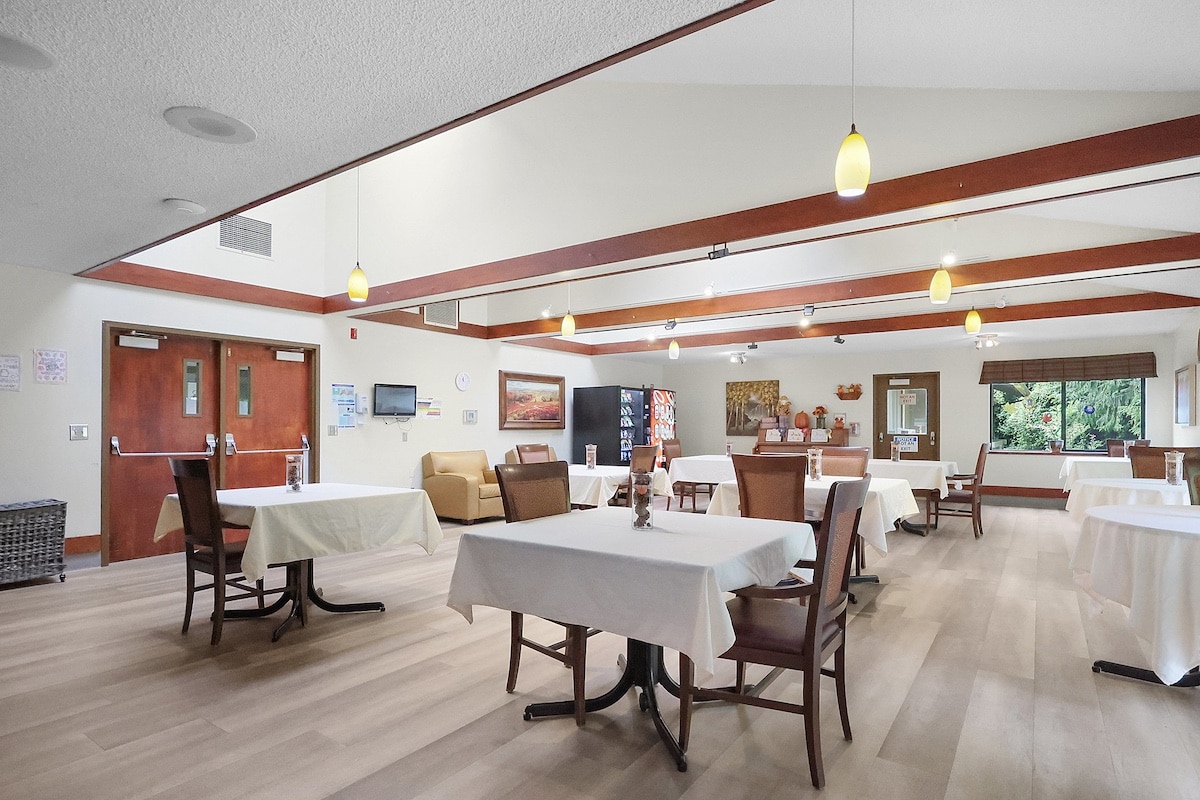
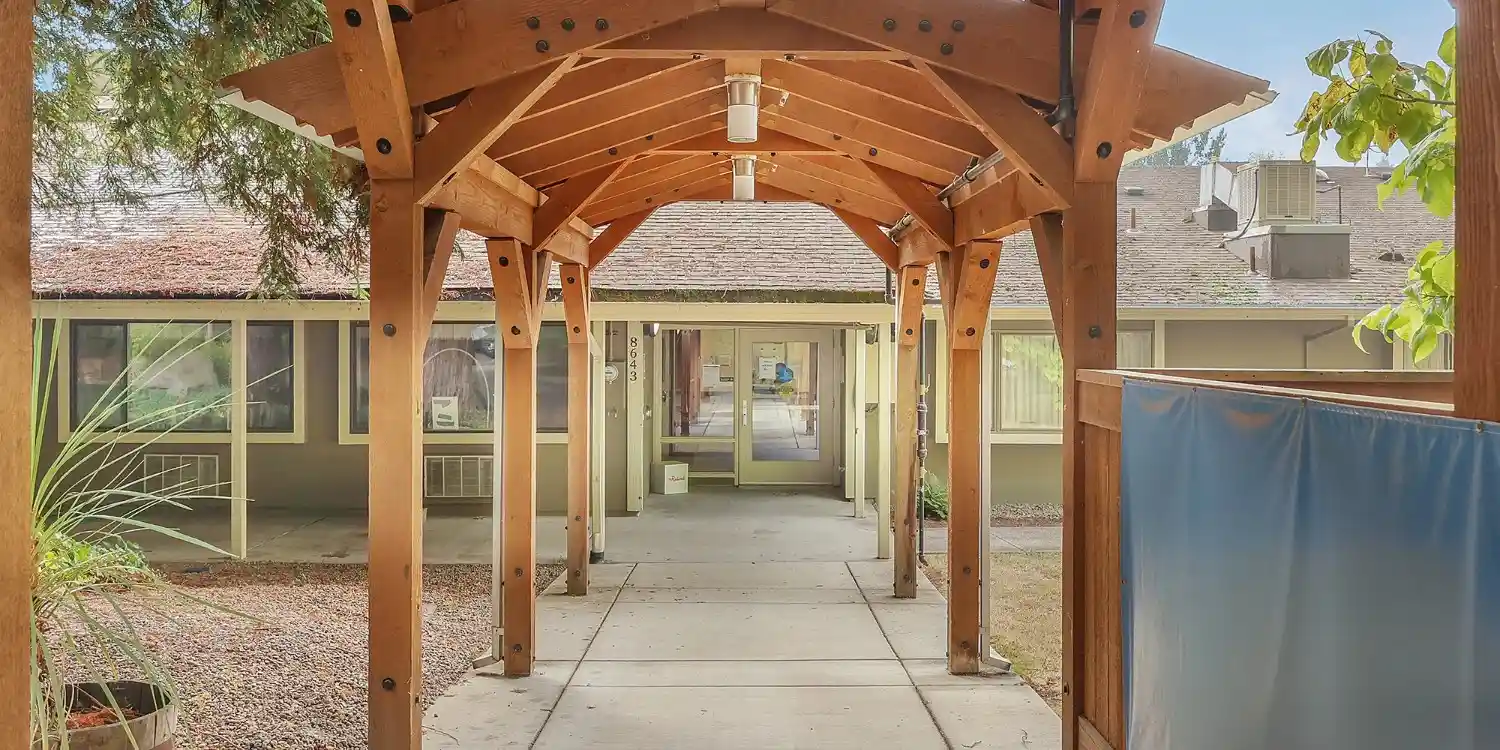
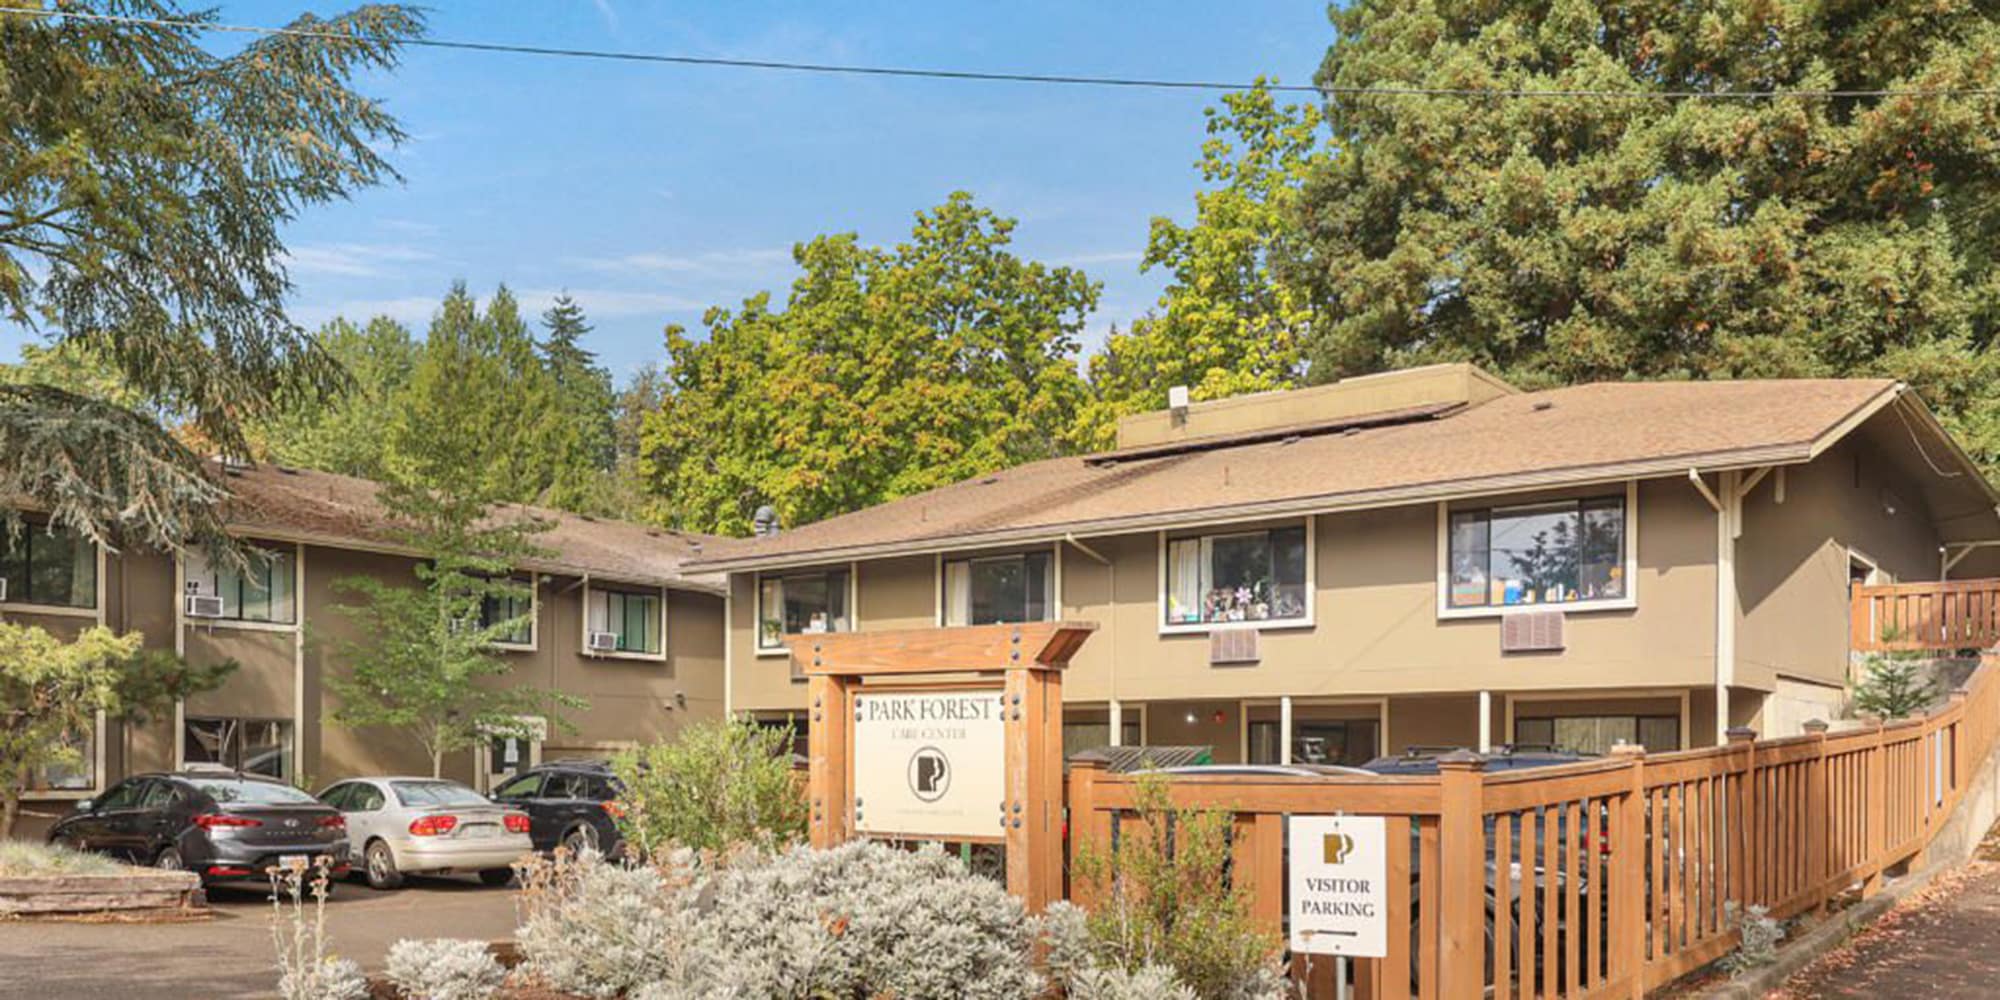
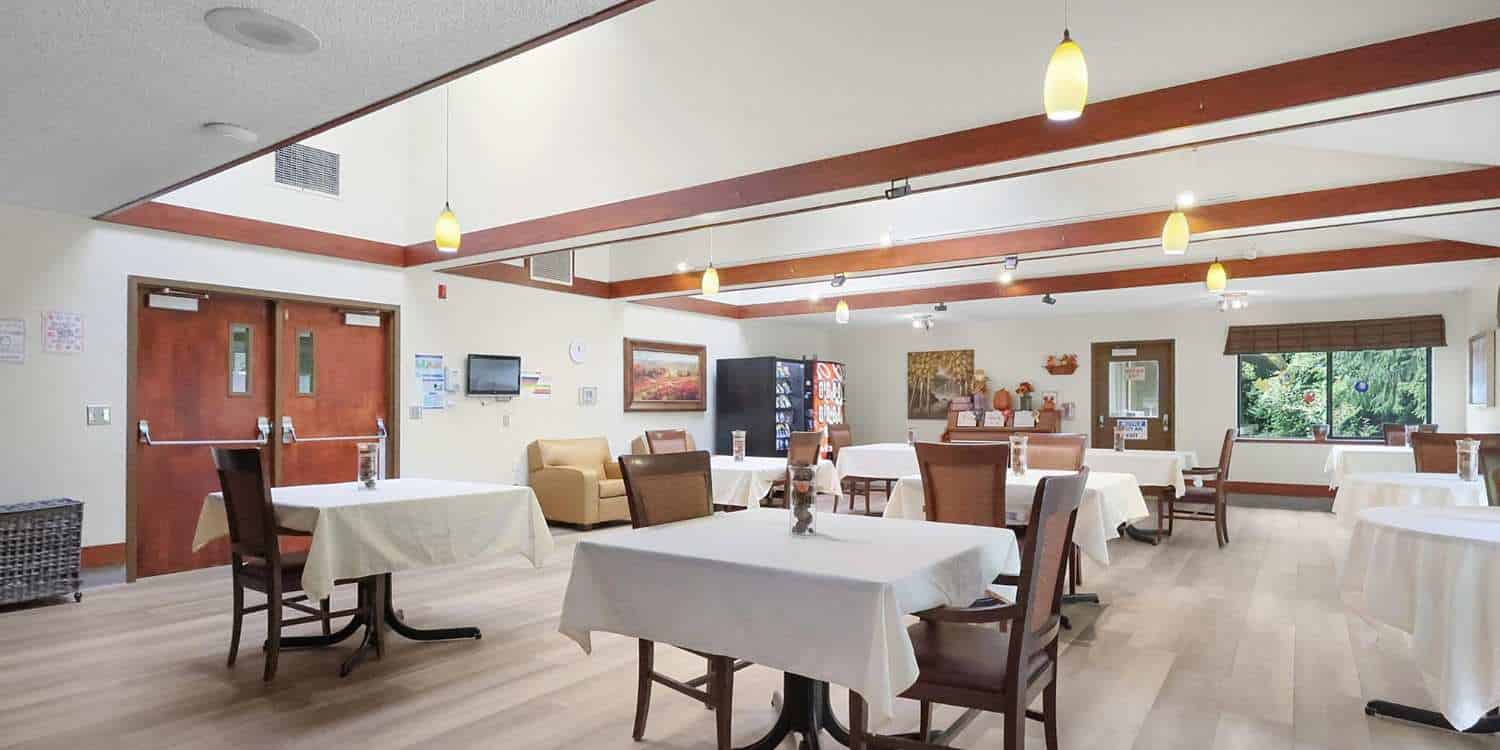
Evergreen Post Acute is a 55-bed post-acute skilled nursing, rehabilitation, and memory care facility at 8643 NE Beech Street, Portland, Multnomah County, Oregon. Operated by Evergreen Snf Healthcare, LLC, the community provides 24-hour skilled nursing care with therapy and assessment services six to seven days weekly, rehabilitation, memory care, case management, and discharge planning. Specialized programs include joint replacement and orthopedic rehabilitation, stroke rehabilitation, cardiac rehabilitation with CHF protocol, fall prevention, pulmonary care, post-operative care, pain management, infusion therapy, vascular wound management, renal disease services, cancer recovery, bariatric care, and palliative and hospice care.

The regulatory record documents systemic and recurring care quality and compliance gaps. Over three years, Evergreen Post Acute logged 41 deficiencies; 13.7 annually, 104 percent above Oregon’s 6.7-deficiency benchmark.

The November 17, 2025, complaint investigation revealed five deficiencies in accident prevention and unnecessary medications; none were corrected at visit. Complaint investigations on October 30, 2025, and July 11, 2025, issued initial comment citations uncorrected at visit. A critical February 18, 2025, complaint investigation documented twenty-one deficiencies covering resident rights, abuse prevention, care planning, ADL assistance, quality of care, rehabilitation services, infection control, staffing information, behavioral health services, nutrition, and food sanitation; some were corrected at follow-up while many persisted uncorrected. Complaint investigations on December 6, 2024, and March 15, 2024, issued initial comment citations both uncorrected.

A September 19, 2024, complaint investigation cited four deficiencies in resident dignity and respect with mixed correction. Multiple focused infection control surveys in December 2023 repeatedly identified failure to report complete COVID-19 information to the CDC’s National Health Safety Network, with citations uncorrected. The February 2025 twenty-one deficiency cluster, particularly spanning care planning accuracy, quality of care provision, and abuse and neglect prevention, reveals systemic operational vulnerability.

Some facility responsiveness to follow-up audits was noted in February 2025; however, the persistence of uncorrected deficiencies across complaint investigations from September 2024 through November 2025 indicates incompleteness in corrective implementation. No fines or license actions are recorded; complaint investigations were unsubstantiated.

The facility provides post-acute skilled nursing, rehabilitation, memory care, specialty care, and palliative services with 24-hour staffing and therapy services. Private pay is required; Medicaid and Medicare are not accepted.

(503) 256-2151

Quality ratings

Measured by Centers for Medicare & Medicaid Services (CMS)

Overall rating Info The Overall CMS Rating combines results from health inspections, staffing levels and quality measures. Health inspections carry the most weight. Staffing and quality scores can increase or decrease the final rating based on performance compared to state and national standards.
▼ 34.4% Below OR avg. ▼ 34.4% Below OR avg.Click the badge to see the full State ranking.Click here to see the full State ranking.
Health Inspection Info Based on the results of the facility's three most recent standard inspections and any complaint investigations. CMS reviews the number, scope, and severity of deficiencies, with more recent findings weighted more heavily.
▼ 29.8% Below OR avg. ▼ 29.8% Below OR avg.Click the badge to see the full State ranking.Click here to see the full State ranking.
Staffing Info Measures average nursing staff hours per resident per day, including Registered Nurses (RNs) and total nursing staff. Ratings are adjusted based on the level of care residents require and are compared to state and national benchmarks.
▼ 18.7% Below OR avg. ▼ 18.7% Below OR avg.Click the badge to see the full State ranking.Click here to see the full State ranking.
Quality Measures Info Based on clinical and physical health indicators reported to CMS, such as hospital readmissions, falls, pressure ulcers, and improvements in mobility. These measures reflect how well residents' health needs are being managed.
▼ 42.0% Below OR avg. ▼ 42.0% Below OR avg.Click the badge to see the full State ranking.Click here to see the full State ranking.

Staffing hours breakdown

Info Daily nursing hours per resident by staff type, reported to CMS. Higher is generally better — compare this facility to state and national averages to see where staffing stands.

Hours per resident per day — compared to Oregon state averages

Total nursing care / resident Info This home is ranked 19th out of 92 homes in Oregon. Total adjusted nursing hours per resident per day, combining RN, LPN, and aide time. CMS adjusts this for case-mix so facilities can be fairly compared.
5h 35m per day
Rank #19 / 92Nurse hours — State benchmarkedThis home is ranked 19th out of 92 homes in Oregon. Shows adjusted nurse hours per resident per day benchmarked to the Oregon average, with a ranking across 92 Oregon SNFs. More hours mean more direct care. The national average is about 3.5 hrs; below 3.0 is a red flag.Click the rank badge to see the full State ranking.Click here to see the full State ranking.
This facility Oregon avg (5h 12m per day)
vs Oregon avg
+7%

4 of 6 metrics below state avg

Standout metric Weekend Total Nursing is +6% above state avg
Staff typeHours / Day / Residentvs state avg
Registered Nurse (RN) Info RNs hold the highest nursing license and can assess residents, interpret test results, and direct care plans. More RN hours per day often signals stronger clinical oversight and faster response to health changes. 30m per day ▼ 52% State avg: 1h 2m per day · National avg: 41m per day
LPN / LVN Info Licensed Practical Nurses (LPNs) or Licensed Vocational Nurses (LVNs) deliver routine hands-on care — medication administration, wound dressing, and monitoring vital signs. They work under RN supervision and make up a large share of daily bedside care. 57m per day ▼ 7% State avg: 1h 1m per day · National avg: 52m per day
Nurse Aide Info Certified Nurse Aides (CNAs) provide the most direct day-to-day assistance: bathing, dressing, feeding, and mobility. Nurse aide hours are typically the largest staffing category and directly affect residents' quality of life. 2h 27m per day ■ Avg State avg: 2h 28m per day · National avg: 2h 20m per day
Weekend Total Nursing Info Combined nursing hours (RN + LPN + Nurse Aide) per resident per day on weekends. Staffing often drops on weekends — this figure reveals whether the facility maintains adequate coverage outside of weekday hours. 4h 17m per day ▲ 6% State avg: 4h 2m per day · National avg: 3h 26m per day
Physical Therapist Info Hours per resident per day provided by licensed Physical Therapists (PTs) or PT Assistants. PT services help residents recover mobility after injury or illness and are especially important for post-acute (short-stay) rehabilitation. 5m per day ▼ 44% State avg: 9m per day · National avg: 4m per day
Weekend RN Info Registered nurse hours specifically on weekends. Facilities sometimes reduce RN presence on Saturdays and Sundays — a low weekend RN figure compared to weekday hours can indicate reduced clinical oversight when most administrative staff are absent. 20m per day ▼ 53% State avg: 43m per day · National avg: 28m per day

Capacity and availability

This home usually has availability

Occupancy lower than 85% suggests more openings may be available.

Higher occupancy than the Oregon average: 65.7%
Occupancy rate 70% Rank #36 / 90Occupancy rate — State benchmarkedThis home is ranked 36th out of 90 homes in Oregon. Shows this facility's occupancy rate versus the Oregon average, with its Statewide rank out of 90. Higher occupancy signals strong local demand and financial stability.Click the rank badge to see the full State ranking.Click here to see the full State ranking.
Avg. Length of Stay 80 days
Occupancy rate
70% Rank #36 / 90Occupancy rate — State benchmarkedThis home is ranked 36th out of 90 homes in Oregon. Shows this facility's occupancy rate versus the Oregon average, with its Statewide rank out of 90. Higher occupancy signals strong local demand and financial stability.Click the rank badge to see the full State ranking.Click here to see the full State ranking.
Avg. Length of Stay
80 days
Bed community size
55-bed community Rank #211 / 354Bed count — State benchmarkedThis home is ranked 211th out of 354 homes in Oregon. Shows this facility's certified or reported bed count compared to other Oregon SNFs. Larger communities may offer more amenities, programs, and on-site services for residents and families.Click the rank badge to see the full State ranking.Click here to see the full State ranking.
A moderately sized community that may balance personal attention with shared amenities and social activities.
Years in operation
1 year in operation Rank #358 / 374Years in operation — State benchmarkedThis home is ranked 358th out of 374 homes in Oregon. Shows how long this facility has been in operation compared to other Oregon SNFs. Longer operating histories may benefit residents, families, and staff.Click the rank badge to see the full State ranking.Click here to see the full State ranking.
A newer community that may feature more recent facilities and programs.
Walk Score
Walk Score: 58 / 100 Rank #233 / 476Walk Score — State benchmarkedThis home is ranked 233rd out of 476 homes in Oregon. Shows how walkable this facility's neighborhood is compared to the average Walk Score across Oregon SNFs. Higher scores benefit residents, families, and staff.Click the rank badge to see the full State ranking.Click here to see the full State ranking.
Moderately walkable. Some errands can be accomplished on foot, with a mix of nearby amenities.

About this community

License Details

Facility TypeSnf/nf Dual Cert
StatusActive
IssuanceSeptember 1, 2024
CountyMultnomah
License Number385258

Ownership & Operating Entity

Evergreen Post Acute is administrated by Russell Carnagie.

Owner NameEvergreen Snf Healthcare, LLC

Therapy & Rehabilitation

1 service
Rehabilitation Services

Staffing & Medical

1 service
24-Hour Staffing

Contact Information

Fax(360) 314-1202

Amenities & Lifestyle

24-Hour Post-Acute/Skilled Nursing Care
Transportation Assistance
Monthly Activities Calendar
Private Rooms And Semi-Private Rooms
Therapy And Assessment Services Provided 6-7 Days A Week
Specific ProgramsJoint Replacement & Orthopedic Rehabilitation, Stroke Rehabilitation, Cardiac Rehabilitation (CHF Protocol), Fall Prevention and Balance Programs, Pulmonary Care, Post-Operative Care, Pain Management, Intravenous/Infusion Therapy, Vascular Wound Management, Renal Disease Services, Digestive Disease Services, Physical, Occupational, and Speech Therapy Services, Cancer Recovery, Bariatric Care and Services, Nutrition/Dietary Services, Pharmacy, Laboratory, and X-ray Services, Coordinated Palliative and Hospice Care
Operating HoursMonday – Friday: 8 am – 7 pm, Weekends: 9 am – 6:30 pm

Contact Evergreen Post Acute

Inspection History

In Oregon, the Department of Human Services, Aging and People with Disabilities performs unannounced surveys and regular inspections to ensure resident safety in all care settings.

Since 2023 · 3 years of data 24 deficiencies 10 inspections

Inspection Scorecard Info This scorecard compares key inspection, citation, and complaint metrics at this facility against the Oregon state average. Metrics rated ≥15% worse than average are highlighted in red; those ≥15% better are highlighted in green.

Since 2023 vs. Oregon state average
Overall vs. OR average 1 Worse Metrics worse than Oregon average:
• Total inspections (43% above)
3 Better Metrics better than Oregon average:
• Total deficiencies (23% below)
• Deficiencies per year (22% below)
• Deficiencies per inspection (45% below)
Latest Inspection November 17, 2025

Deficiencies Info Deficiencies are formal regulatory issues recorded during state inspections.

This FacilityOR Averagevs. OR Avg
Total deficiencies Info Formal regulatory issues recorded by inspectors across all inspection types. 2431 This facility has 23% fewer total deficiencies than a typical Oregon nursing home (24 vs. OR avg 31).↓ 23% better
Deficiencies per year Info Average deficiencies per year since 2023. 810.3 This facility has 22% fewer deficiencies per year than a typical Oregon nursing home (8 vs. OR avg 10.3).↓ 22% better
Deficiencies per inspection Info Average deficiencies per inspection. 2.44.4 This facility has 45% fewer deficiencies per inspection than a typical Oregon nursing home (2.4 vs. OR avg 4.4).↓ 45% better

Inspections Info State inspections evaluate whether the facility meets health and safety standards.

This FacilityOR Averagevs. OR Avg
Total inspections Info Combined count of all routine and focused inspections. Excludes complaint investigations. 107 This facility has 43% more total inspections than a typical Oregon nursing home (10 vs. OR avg 7).↑ 43% worse

Inspection Reports Summary Info An editor-reviewed summary of the themes and findings across this facility's recent inspection reports.

The most recent inspection on November 17, 2025, found deficiencies related to accident prevention and ensuring the drug regimen was free from unnecessary medications. Earlier inspections showed a pattern of issues including care planning, medication management, resident rights, and infection control, with some deficiencies corrected over time but others remaining unaddressed. Inspectors cited recurring problems with updated care plans, medication errors, and supervision to prevent accidents. Complaint investigations were unsubstantiated, and no fines or enforcement actions were listed in the available reports. The overall trend suggests ongoing challenges with certain care and medication practices despite some improvements in other areas.

Read the full inspection reports for this facility, including detailed findings and corrective actions.

Show Inspection Reports

Health Inspection History

Inspections since 2022
Total health inspections 6

Oregon average 5.1


Last Health inspection on Nov 2025

Total health citations
41 Rank #59 / 90Health citations — State benchmarkedThis home is ranked 59th out of 90 homes in Oregon. Shows this facility's total health deficiency citations benchmarked to the Oregon State average, with a ranking across all 90 OR SNFs. Lower citation counts earn a better rank.Click the rank badge to see the full State ranking.Click here to see the full State ranking.

Oregon average 34

Citations per inspection
6.83 Rank #52 / 90Citations per inspection — State benchmarkedThis home is ranked 52nd out of 90 homes in Oregon. Shows average deficiency citations per CMS inspection for this facility versus the Oregon mean across 90 SNFs with citation data. Lower is better.Click the rank badge to see the full State ranking.Click here to see the full State ranking.

Oregon average 6.86


Health citations are formal notices following inspections when they fail to comply with safety and care standards.

35 of 41 citations resulted from standard inspections; 5 of 41 resulted from complaint investigations; and 1 of 41 came from combined inspections (standard and complaint).

Breakdown of citation severity (last 4 years)
Critical health citations
0
100% better than Oregon average

Oregon average: 0.5


Serious health citations
1
17% better than Oregon average

Oregon average: 1.2

0 critical citations Oregon average: 0.5

1 serious citation Oregon average: 1.2

39 moderate citations Oregon average: 32.1

1 minor citation Oregon average: 0.2
Citations history (last 4 years)
Pharmacy moderate citation Nov 17, 2025

Quality of Care moderate citation Nov 17, 2025

Abuse/Neglect moderate citation Feb 18, 2025
Corrected

Infection Control moderate citation Feb 18, 2025
Corrected

Staffing Data

Reporting period: October 1 – December 31, 2025 (Q4 2025). Source: CMS Payroll-Based Journal report.

Total staff 256
Employees 94
Contractors 162
Staff to resident ratio 4.83:1
65% better than Oregon average
Oregon average ratio: 2.93:1 Oregon average ratio: 2.93:1See full Oregon ranking
Avg staff/day 39
Average shift 8.1 hours
0% compared with Oregon average
Oregon average: 7.8 hours Oregon average shift: 7.8 hoursSee full Oregon ranking
Total staff hours (quarter) 28,940

Nursing staff breakdown

Q4 2025 · Oct 1 – Dec 31 More info This data comes from the CMS Payroll-Based Journal report covering October 1 – December 31, 2025.
Registered Nurse

Manages medical care and health needs.

RN Staff 13
Average shift length Info Average shift length. Calculated as total hours divided by days worked and average staff per day. 12.2 hours

This role is partially covered by contractors.

Licensed Practical Nurse

Assists with medical care and medications.

LPN Staff 83
Average shift length Info Average shift length. Calculated as total hours divided by days worked and average staff per day. 8.7 hours

This role is partially covered by contractors.

Certified Nursing Assistant

Helps with daily care and mobility.

CNA Staff 127
Average shift length Info Average shift length. Calculated as total hours divided by days worked and average staff per day. 7.7 hours

This role is partially covered by contractors.

Contractor staffing

Q4 2025 · Oct 1 – Dec 31 More info This data comes from the CMS Payroll-Based Journal report covering October 1 – December 31, 2025.

Total hours from contractors

21%

6,084 contractor hours this quarter

Certified Nursing Assistant: 76 Licensed Practical Nurse: 64 Registered Nurse: 12 Medication Aide/Technician: 10

Staff by category

Q4 2025 · Oct 1 – Dec 31 More info This data comes from the CMS Payroll-Based Journal report covering October 1 – December 31, 2025.
Certified Nursing Assistant517612715,34092100%7.7
Licensed Practical Nurse1964835,22492100%8.7
Medication Aide/Technician510152,08292100%8.8
RN Director of Nursing4041,0646470%8
Dietitian1015196470%8.1
Registered Nurse112135134043%12.2
Administrator1015126470%8
Nurse Practitioner1015126470%8
Clinical Nurse Specialist1015126470%8
Qualified Activities Professional1015126470%8
Qualified Social Worker1015126470%8
Dental Services Staff2025126470%8
Physical Therapy Assistant2024796368%7.5
Speech Language Pathologist1013013942%7.7
Therapeutic Recreation Specialist1011902527%7.6
Other Dietary Services Staff1011412224%6.4
Respiratory Therapy Technician1011544%3.7
127 Certified Nursing Assistant
% of Days 100%
83 Licensed Practical Nurse
% of Days 100%
15 Medication Aide/Technician
% of Days 100%
4 RN Director of Nursing
% of Days 70%
1 Dietitian
% of Days 70%
13 Registered Nurse
% of Days 43%
1 Administrator
% of Days 70%
1 Nurse Practitioner
% of Days 70%
1 Clinical Nurse Specialist
% of Days 70%
1 Qualified Activities Professional
% of Days 70%
1 Qualified Social Worker
% of Days 70%
2 Dental Services Staff
% of Days 70%
2 Physical Therapy Assistant
% of Days 68%
1 Speech Language Pathologist
% of Days 42%
1 Therapeutic Recreation Specialist
% of Days 27%
1 Other Dietary Services Staff
% of Days 24%
1 Respiratory Therapy Technician
% of Days 4%

Penalties and fines

Includes penalties issued in 2023

Federal penalties imposed by CMS for regulatory violations, including civil money penalties (fines) and denials of payment for new Medicare/Medicaid admissions.

Source: CMS Penalties Database (Data as of Jan 2026)

Total fines amount $4K Rank #44 / 93Federal fines — State benchmarkedThis home is ranked 44th out of 93 homes in Oregon. Shows this facility's cumulative CMS federal fine dollars versus the Oregon average among facilities with fines, and where it ranks among 93 skilled nursing facilities in the pool. Lower total dollars mean a better rank.Click the rank badge to see the full State ranking.Click here to see the full State ranking.
93% lower than Oregon average

Oregon average: $60K

Number of fines 1
41% fewer fines than Oregon average

Oregon average: 1.7

Payment Denials Info Serious action where Medicare and/or Medicaid temporarily stops payments for new residents until issues are fixed. 0
100% fewer payment denials than Oregon average

Oregon average: 0.1

Fines amount comparison
This facility $4K
Oregon average $60K
Penalty History

Penalties are imposed by CMS for violations of federal nursing home regulations.

1 penalty in the past 3 years

Dec 11, 2023 · $4K

Civil Money Penalty Info Fines imposed for noncompliance, which can be assessed per day or per instance of violation. Dec 11, 2023
$4K

Last updated: Jan 2026

Quality of care over time

These measures show how residents usually do over time at this home, based on health outcomes and preventive care.

High-risk clinical events score Info A composite score based on pressure ulcers, falls with injury, weight loss, walking ability decline, and activities of daily living decline. 13.9
32% worse than Oregon average

Oregon average: 10.5

Functional decline score Info A composite score based on activities of daily living decline, walking ability decline, and incontinence. 24.2
15% worse than Oregon average

Oregon average: 21.1

Long-stay resident measures
Above average Info CMS star rating based on long-stay quality measure performance. 5 stars = significantly above average, 1 star = significantly below average.
Need for Help with Daily Activities Increased Info Percent of long-stay residents whose need for help with daily activities has increased 20.2%
24% worse than Oregon average

Oregon average: 16.3%

Walking Ability Worsened Info Percent of long-stay residents whose ability to move independently worsened 34.7%
39% worse than Oregon average

Oregon average: 24.9%

Low Risk Residents with Bowel/Bladder Incontinence Info Percent of low risk long-stay residents who lose control of their bowels or bladder 17.6%
22% better than Oregon average

Oregon average: 22.6%

Falls with Major Injury Info Percent of long-stay residents experiencing one or more falls with major injury 3.4%
44% worse than Oregon average

Oregon average: 2.4%

High Risk Residents with Pressure Ulcers Info Percent of long-stay high risk residents with pressure ulcers 9.0%
30% worse than Oregon average

Oregon average: 6.9%

Urinary Tract Infection Info Percent of long-stay residents with a urinary tract infection 0.0%
100% better than Oregon average

Oregon average: 2.1%

Lost Too Much Weight Info Percent of long-stay residents who lose too much weight 2.2%
58% better than Oregon average

Oregon average: 5.3%

Depressive Symptoms Info Percent of long-stay residents who have depressive symptoms 7.1%
53% worse than Oregon average

Oregon average: 4.6%

Antipsychotic Use Info Percent of long-stay residents who received an antipsychotic medication 13.0%
In line with Oregon average

Oregon average: 13.2%

Pneumococcal Vaccine Info Percent of long-stay residents assessed and appropriately given the pneumococcal vaccine 98.6%
In line with Oregon average

Oregon average: 95.7%

Influenza Vaccine Info Percent of long-stay residents assessed and appropriately given the seasonal influenza vaccine 100.0%
5% better than Oregon average

Oregon average: 95.2%

Hospitalizations per 1,000 days Info Number of hospitalizations per 1,000 long-stay resident days. 1.59
13% better than Oregon average

Oregon average: 1.83

ED visits per 1,000 days Info Number of outpatient emergency department visits per 1,000 long-stay resident days. 1.19
13% better than Oregon average

Oregon average: 1.37

Short-stay resident measures
Significantly above average Info CMS star rating based on short-stay quality measure performance. 5 stars = much above average, 1 star = much below average.
Pneumococcal Vaccine Info Percent of short-stay residents assessed and appropriately given the pneumococcal vaccine 72.0%
17% worse than Oregon average

Oregon average: 86.2%

Antipsychotic medication increase Info Percent of short-stay residents who newly received an antipsychotic medication 0.0%
100% better than Oregon average

Oregon average: 1.8%

Influenza Vaccine Info Percent of short-stay residents assessed and appropriately given the seasonal influenza vaccine 60.9%
25% worse than Oregon average

Oregon average: 81.2%

Re-hospitalized after SNF stay Info Percentage of short-stay residents who were re-hospitalized after their nursing home admission. 17.6%
18% better than Oregon average

Oregon average: 21.5%

Emergency department visits Info Percentage of short-stay residents who had an outpatient emergency department visit. 5.2%
54% better than Oregon average

Oregon average: 11.2%

Falls with major injury Info Percentage of SNF residents who experience falls with major injury during their stay. 0.8%
In line with Oregon average

Oregon average: 0.8%

Ability to care for self at discharge Info Percentage of residents at or above expected ability to care for themselves at discharge. 55.6%
In line with Oregon average

Oregon average: 53.7%

Successful return to home or community Info Rate of successful return to home or community from a skilled nursing facility. 54.2%
7% better than Oregon average

Oregon average: 50.6%

Breakdown by payment type

Medicare

7% of new residents, usually for short-term rehab.

Typical stay 22 days

Private pay

63% of new residents, often for short stays.

Typical stay 26 days

Medicaid

30% of new residents, often for long-term daily care.

Typical stay 6 - 7 months

Facility Characteristics

Source: CMS Long-Term Care Facility Characteristics (Data as of Jan 2026)

Total residents 53
Medicare
2
3.8% of residents
Medicaid
41
77.4% of residents
Private pay or other
10
18.9% of residents
Programs & Services
Residents Group

Residents meet regularly to discuss policies, care quality, and activities

Active Resident Council

Organized group of residents that meets regularly to discuss facility policies, quality of life, and activities.

Finances and operations

Privately-owned community
Operated by a business corporation.
Home revenue
$9.7M
Profit
$465.2K
Privately-owned community Operated by a business corporation.
Home revenue
$9.7M Rank #60 / 88Revenue — State benchmarkedThis home is ranked 60th out of 88 homes in Oregon. Shows this facility's annual revenue compared to the Oregon SNF average. Higher revenue generally means more resources for staffing and capital — read alongside Payroll %.Click the rank badge to see the full State ranking.Click here to see the full State ranking.
Profit
$465.2K
Payroll costs Info The portion of the home's budget spent on staff, including nurses, caregivers, and other employees who support care and operations. Rank #65 / 88Payroll — State benchmarkedThis home is ranked 65th out of 88 homes in Oregon. Shows total annual staff payroll benchmarked to the Oregon average. Higher payroll investment relative to peers often signals better staffing and less reliance on cheaper contract labor.Click the rank badge to see the full State ranking.Click here to see the full State ranking.
$4.1M
42.8% of revenue Rank #51 / 88Payroll % — State benchmarkedThis home is ranked 51st out of 88 homes in Oregon. Shows payroll as a percentage of revenue versus the Oregon average. Well-run Oregon SNFs typically land around 51–62% — the top third Statewide. Below 25% may signal understaffing or heavy agency use — read with Staffing ratings.Click the rank badge to see the full State ranking.Click here to see the full State ranking.
Other operating costs Info All remaining costs needed to run the home, such as food, utilities, building maintenance, supplies and administrative expenses.
$4.2M
Total costs $8.3M

Who this home usually serves

TYPE OF STAY

Primarily long-term care, limited rehab

Most residents stay long-term, while a smaller portion are admitted for short-term rehab.

Places of interest near Evergreen Post Acute

Address 6.6 miles from city center Info Estimated distance in miles from Portland's city center to Evergreen Post Acute's address, calculated via Google Maps.

Calculate Travel Distance to Evergreen Post Acute

Add your location

Address

Financial Assistance for
Nursing Home in Oregon

Evergreen Post Acute is located in Portland, Oregon.
Here are the financial assistance programs available to residents in Oregon.

Get Financial aid guidance

Oregon Project Independence (OPI)

OPI

Age 60+
General Oregon resident, at risk of nursing home but not Medicaid-eligible.
Income Limits ~$2,000/month individual, varies
Asset Limits $5,000 individual
OR

Cost-sharing required; rural/urban balance.

Benefits
In-home care (3-5 hours/week) Respite (up to 10 days/year) Adult day care (~$70/day) Transportation (~5 trips/month)

Oregon Medicaid Community-Based Care

OR Medicaid CBC

Age 65+ or disabled
General Oregon resident, Medicaid-eligible, nursing home-level care need.
Income Limits (2025) ~$2,829/month 300% FBR, individual
Asset Limits $2,000 (individual), $3,000 (couple).
OR

High demand in urban areas (e.g., Portland).

Benefits
Personal care (5-7 hours/day) Respite (240 hours/year) Adult day care ($70/day) Home modifications ($1,500 avg.)

Program of All-Inclusive Care for the Elderly (PACE)

Oregon PACE (e.g., Providence ElderPlace)

Age 55+
General OR resident (specific counties), NFLOC, safe with PACE support.
Income Limits (2025) ~$2,829/month (Medicaid-eligible); private pay option available.
Asset Limits $2,000 (individual), $3,000 (couple) for Medicaid enrollees.
OR

Available in 11 counties (e.g., Multnomah, Washington); Providence ElderPlace dominant provider.

Benefits
Personal care (5-7 hours/day) Medical care Meals Transportation Respite Therapies

Medicare Savings Program (MSP)

Oregon Medicare Savings Program

Age 65+ or disabled
General OR resident, Medicare Part A/B.
Income Limits (2025) ~$2,510/month (QMB), ~$3,380/month (SLMB), ~$3,598/month (QI)—individual.
Asset Limits $9,430 (individual), $14,130 (couple).
OR

Three tiers; includes Extra Help for Part D; no waitlist.

Benefits
Covers Part B premiums ($174.70/month) Deductibles ($240/year) Copays (~20%)

Family Caregiver Support Program (FCSP)

Oregon Family Caregiver Support Program

Age
General Caregivers of 60+ needing care or 55+ caregivers of others; OR resident; functional needs (2+ ADLs).
Income Limits (2025) No strict cap; prioritizes low-income ~$24,980/year
Asset Limits Not assessed; need-based.
OR

15 regions; rural priority; includes grandparent caregivers.

Benefits
Respite (4-6 hours/week or 5 days/year) Adult day care ($60/day) Training Supplies (~$500/year)

VA Aid and Attendance (A&A) and Housebound Benefits

Oregon VA Aid and Attendance/Housebound

Age 65+ or disabled veteran/spouse
General OR resident, wartime service, need for ADL help (A&A) or homebound.
Income Limits (2025) Net income < ~$1,984/month (veteran with dependent, A&A); pension offsets income.
Asset Limits ~$155,356 net worth limit
OR

High veteran demand; Oregon Veterans’ Homes option.

Benefits
Cash (~$1,433-$2,642/month veteran, ~$951-$1,318 spouse) for care costs (e.g., in-home, assisted living)

Senior Property Tax Deferral Program

Oregon Property Tax Deferral for Disabled and Senior Citizens

Age 62+
General OR resident, homeowner 5+ years, low-income.
Income Limits (2025) ~$58,000/year household, adjusted annually
Asset Limits Home value < county median; equity > 15%.
OR

Deferred taxes accrue 6% interest; repaid upon sale/death.

Benefits
Tax deferral (~$1,000-$3,000/year avg., varies by county)

Elderly Nutrition Program (ENP)

Oregon Elderly Nutrition Program

Age 60+
General OR resident (or spouse of any age); no income limit.
Income Limits (2025) None; donations encouraged.
Asset Limits Not assessed.
OR

Includes Meals on Wheels; prioritizes homebound/low-income.

Benefits
Home-delivered or congregate meals (~$5-$7/meal value, 5 meals/week avg.)

Compare Nursing Home around Portland

The information below is reported by the Oregon Department of Human Services, Aging and People with Disabilities.

5 facilities compared · CMS & OR Dept. of Health data

Filter by care type
Mirabella Portland
NH

Nursing Home Licensed facility providing 24/7 skilled nursing care for residents with complex, ongoing medical needs. Staffed by RNs, LPNs, and CNAs. Inspected and star-rated annually by CMS. Accepts Medicare (short-term rehab) and Medicaid (long-term care).

AL

Assisted Living A licensed, long-term care setting for seniors or individuals with disabilities who need help with daily activities — like bathing, dressing, and medication management — but not 24-hour skilled nursing. Offers housing, meals, and around-the-clock support while aiming to maximize resident independence.

Portland (Southwest Portland)27 93.2% +42%5.83 +70%+11%$0144.7-24A+ 81 Linda Dinan$24.8M$13.0M52.3%385274
Marquis Vermont Hills
NH

Nursing Home Licensed facility providing 24/7 skilled nursing care for residents with complex, ongoing medical needs. Staffed by RNs, LPNs, and CNAs. Inspected and star-rated annually by CMS. Accepts Medicare (short-term rehab) and Medicaid (long-term care).

AL

Assisted Living A licensed, long-term care setting for seniors or individuals with disabilities who need help with daily activities — like bathing, dressing, and medication management — but not 24-hour skilled nursing. Offers housing, meals, and around-the-clock support while aiming to maximize resident independence.

Portland (Southwest Portland)73 47.1% -28%5.30 -65%+1%$0165.3-47- 37 -$12.4M$4.2M33.5%385218
Gateway Care & Retirement Center
NH

Nursing Home Licensed facility providing 24/7 skilled nursing care for residents with complex, ongoing medical needs. Staffed by RNs, LPNs, and CNAs. Inspected and star-rated annually by CMS. Accepts Medicare (short-term rehab) and Medicaid (long-term care).

AL

Assisted Living A licensed, long-term care setting for seniors or individuals with disabilities who need help with daily activities — like bathing, dressing, and medication management — but not 24-hour skilled nursing. Offers housing, meals, and around-the-clock support while aiming to maximize resident independence.

Portland (Hazelwood)59 87.8% +34%5.98 -67%+14%$0343.8-55- 82 Sapphire At Gateway LLC$14.4M$6.0M41.9%385268
Evergreen Post Acute
NH

Nursing Home Licensed facility providing 24/7 skilled nursing care for residents with complex, ongoing medical needs. Staffed by RNs, LPNs, and CNAs. Inspected and star-rated annually by CMS. Accepts Medicare (short-term rehab) and Medicaid (long-term care).

AL

Assisted Living A licensed, long-term care setting for seniors or individuals with disabilities who need help with daily activities — like bathing, dressing, and medication management — but not 24-hour skilled nursing. Offers housing, meals, and around-the-clock support while aiming to maximize resident independence.

Portland55 70.0% +6%5.58 -45%+6%$4.2k416.8152- 58 -$9.7M$4.1M42.8%385258
Cascade Terrace Post Acute
NH

Nursing Home Licensed facility providing 24/7 skilled nursing care for residents with complex, ongoing medical needs. Staffed by RNs, LPNs, and CNAs. Inspected and star-rated annually by CMS. Accepts Medicare (short-term rehab) and Medicaid (long-term care).

AL

Assisted Living A licensed, long-term care setting for seniors or individuals with disabilities who need help with daily activities — like bathing, dressing, and medication management — but not 24-hour skilled nursing. Offers housing, meals, and around-the-clock support while aiming to maximize resident independence.

Portland105 55.8% -15%4.97 -21%-5%$185.9k428.4481- 10 -$15.4M$6.6M42.7%385187

Frequently Asked Questions about Evergreen Post Acute

Who is the owner of Evergreen Post Acute?

The legal owner and operator of Evergreen Post Acute is Evergreen Snf Healthcare, LLC.

Is Evergreen Post Acute in a walkable area?

Evergreen Post Acute has a walk score of 58. Moderately walkable. Some errands can be accomplished on foot, with a mix of nearby amenities.

What is the license number of Evergreen Post Acute?

According to OR state health department records, Evergreen Post Acute's license number is 385258.

What is the best email address for Evergreen Post Acute?

The team at Evergreen Post Acute can be reached at [email protected].

Who is the administrator of Evergreen Post Acute?

Russell Carnagie is the administrator of Evergreen Post Acute.

How many beds does Evergreen Post Acute have?

Evergreen Post Acute has 55 beds.

Has Evergreen Post Acute had any recent deficiencies or citations?

Evergreen Post Acute has had 24 recently reported deficiencies.

Guides for Better Senior Living

Care Cost Calculator: See Prices in Your Area

Nursing Home Data Explorer

Don’t Wait Too Long: 7 Red Flag Signs Your Parent Needs Assisted Living Now

The True Cost of Assisted Living in 2025 – And How Families Are Paying For It

Understanding Senior Living Costs: Pricing Models, Discounts & Financial Assistance

Explore Open Rooms
1 Contact details
2 What type of senior care service are you looking for?
3 What budget do you have in mind for senior care?
4 How soon do you need to find care?
5 Additional details

Thank you for your interest!

Our team will be in touch shortly to help with next steps.