Monument Healthcare Murray Creek
CMS overall rating Info CMS (the Centers for Medicare & Medicaid Services) is the federal agency that rates nursing home quality. Its Overall Rating runs from 1 to 5 stars, combining health inspections, staffing, and quality measures, with inspections weighted most heavily.

Monument Healthcare Murray Creek

CMS overall rating Info CMS (the Centers for Medicare & Medicaid Services) is the federal agency that rates nursing home quality. Its Overall Rating runs from 1 to 5 stars, combining health inspections, staffing, and quality measures, with inspections weighted most heavily.
Calculator: See prices in your area
Monument Healthcare Murray Creek accepts Medicare, Medicaid, and private pay.

Overview of Monument Healthcare Murray Creek

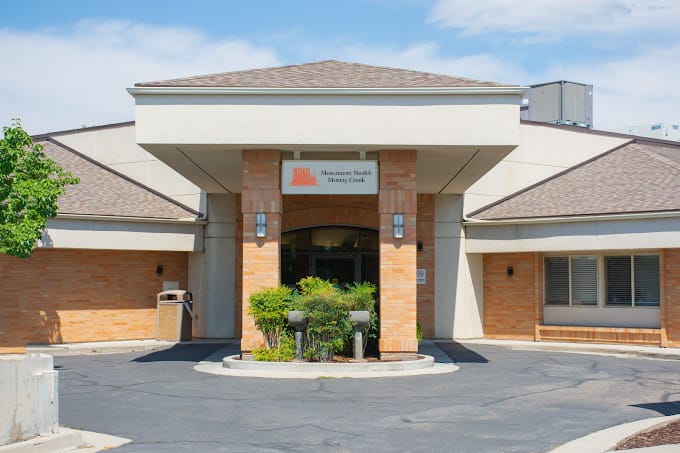
Located in Salt Lake City, Utah, Monument Healthcare Murray Creek is a skilled nursing community that offers comprehensive clinical care alongside structured residential support for older adults who require ongoing medical attention and rehabilitation services. This 184-bed community serves older adults across the greater metropolitan area. Currently operating at an approximately 11% occupancy rate, the community has 20 of 184 beds occupied.

The community has undergone a total of 7 inspections, 3 of which are complaint-initiated. The most recent inspection in June 2025, a routine survey and a complaint investigation, identified 15 deficiencies, including failure to protect residents from abuse by both a resident and a staff member, with substantiated abuse by a registered nurse who was terminated. Over the years, the community has also accumulated a total of 51 deficiencies, which is significantly higher than the state average of 14. Earlier inspections also showed multiple recurring concerns, including incomplete care plans, inadequate medication management, insufficient abuse investigations, and problems with resident supervision and hygiene. However, no license suspensions or fines were reported

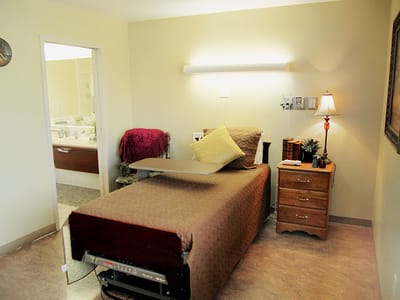
Designed to support older adults with significant medical needs who require consistent clinical oversight and therapeutic care, the community offers skilled nursing services paired with structured daily routines that promote recovery, stability, and engagement. Facilities of this size in Salt Lake City often work closely with hospitals, specialists, and rehabilitation providers to ensure continuity of care as residents’ health needs change over time.

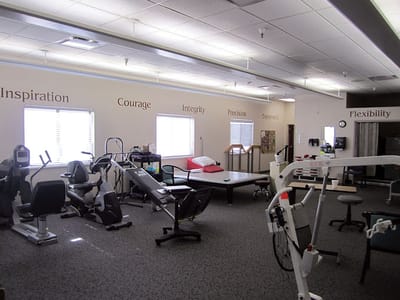
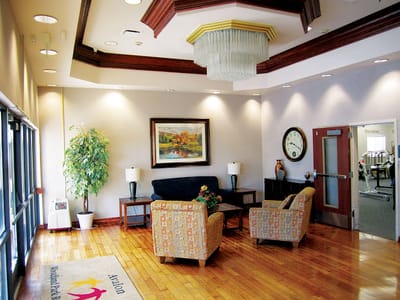
Services include 24-hour nursing supervision, medication management, wound care, and coordinated rehabilitation therapies. The size of the community allows for more specialized care areas and focused support for different resident needs, including older adults recovering from surgery, managing complex health conditions, or participating in extended rehabilitation programs. This scale also supports a broader range of staffing roles and clinical resources than smaller settings. Multiple care units, shared dining areas, communal spaces, and activity rooms that support both medical care and quality of life are also available. This infrastructure also allows organized programming, nutritional support, social activities, and therapeutic services delivered within a coordinated care setting. The goal is to balance clinical treatment with opportunities for interaction and daily engagement.

For older adults and families exploring skilled nursing options in Salt Lake City, Monument Healthcare Murray Creek offers a large-scale, resource-intensive care environment.

(801) 268-4766

Quality ratings

Measured by Centers for Medicare & Medicaid Services (CMS)

Overall rating Info The Overall CMS Rating combines results from health inspections, staffing levels and quality measures. Health inspections carry the most weight. Staffing and quality scores can increase or decrease the final rating based on performance compared to state and national standards.
▼ 40.3% Below UT avg. ▼ 40.3% Below UT avg.UT average: 3.4Click the badge to see the full State ranking.Click here to see the full State ranking.
Health Inspection Info Based on the results of the facility's three most recent standard inspections and any complaint investigations. CMS reviews the number, scope, and severity of deficiencies, with more recent findings weighted more heavily.
▼ 64.1% Below UT avg. ▼ 64.1% Below UT avg.UT average: 2.8Click the badge to see the full State ranking.Click here to see the full State ranking.
Staffing Info Measures average nursing staff hours per resident per day, including Registered Nurses (RNs) and total nursing staff. Ratings are adjusted based on the level of care residents require and are compared to state and national benchmarks.
▼ 2.7% Below UT avg. ▼ 2.7% Below UT avg.UT average: 3.1Click the badge to see the full State ranking.Click here to see the full State ranking.
Quality Measures Info Based on clinical and physical health indicators reported to CMS, such as hospital readmissions, falls, pressure ulcers, and improvements in mobility. These measures reflect how well residents' health needs are being managed.
▲ 14.9% Above UT avg. ▲ 14.9% Above UT avg.UT average: 4.4Click the badge to see the full State ranking.Click here to see the full State ranking.

Staffing hours breakdown

Info Daily nursing hours per resident by staff type, reported to CMS. Higher is generally better — compare this facility to state and national averages to see where staffing stands.

Hours per resident per day — compared to Utah state averages

Total nursing care / resident Info This home is ranked 37th out of 80 homes in Utah for nurse hours. Total adjusted nursing hours per resident per day, combining RN, LPN, and aide time. CMS adjusts this for case-mix so facilities can be fairly compared.
3h 28m per day
Rank #37 / 80Nurse hours — State benchmarkedThis home is ranked 37th out of 80 homes in Utah. Shows adjusted nurse hours per resident per day benchmarked to the Utah average, with a ranking across 80 Utah facilities. More hours mean more direct care. The national average is about 3.5 hrs; below 3.0 is a red flag.Rankings are based only on facilities in Utah that report data for that category. Facilities without available data are excluded from the ranking.Click the rank badge to see the full State ranking.Click here to see the full State ranking.
This facility Utah avg (3h 43m per day)
vs Utah avg
-7%

4 of 6 metrics below state avg

Standout metric LPN / LVN is +5% above state avg
Staff typeHours / Day / Residentvs state avg
Registered Nurse (RN) Info RNs hold the highest nursing license and can assess residents, interpret test results, and direct care plans. More RN hours per day often signals stronger clinical oversight and faster response to health changes. 1h 8m per day ▼ 4% State avg: 1h 11m per day · National avg: 41m per day
LPN / LVN Info Licensed Practical Nurses (LPNs) or Licensed Vocational Nurses (LVNs) deliver routine hands-on care — medication administration, wound dressing, and monitoring vital signs. They work under RN supervision and make up a large share of daily bedside care. 33m per day ▲ 5% State avg: 31m per day · National avg: 52m per day
Nurse Aide Info Certified Nurse Aides (CNAs) provide the most direct day-to-day assistance: bathing, dressing, feeding, and mobility. Nurse aide hours are typically the largest staffing category and directly affect residents' quality of life. 2h 16m per day ▼ 4% State avg: 2h 22m per day · National avg: 2h 20m per day
Weekend Total Nursing Info Combined nursing hours (RN + LPN + Nurse Aide) per resident per day on weekends. Staffing often drops on weekends — this figure reveals whether the facility maintains adequate coverage outside of weekday hours. 3h 28m per day ■ Avg State avg: 3h 31m per day · National avg: 3h 26m per day
Physical Therapist Info Hours per resident per day provided by licensed Physical Therapists (PTs) or PT Assistants. PT services help residents recover mobility after injury or illness and are especially important for post-acute (short-stay) rehabilitation. 1m per day ▼ 81% State avg: 7m per day · National avg: 4m per day
Weekend RN Info Registered nurse hours specifically on weekends. Facilities sometimes reduce RN presence on Saturdays and Sundays — a low weekend RN figure compared to weekday hours can indicate reduced clinical oversight when most administrative staff are absent. 46m per day ▼ 8% State avg: 50m per day · National avg: 28m per day

Capacity and availability

Avg. Length of Stay
98 days
Bed community size
184-bed community Rank #6 / 196Bed count — State benchmarkedThis home is ranked 6th out of 196 homes in Utah. Shows this facility's certified or reported bed count compared to other Utah facilities. Larger communities may offer more amenities, programs, and on-site services for residents and families.Rankings are based only on facilities in Utah that report data for that category. Facilities without available data are excluded from the ranking.Click the rank badge to see the full State ranking.Click here to see the full State ranking.
A large-scale community that may provide a wide range of amenities, services, and structured programs.
Years in operation
37 years in operation Rank #24 / 196Years in operation — State benchmarkedThis home is ranked 24th out of 196 homes in Utah. Shows how long this facility has been in operation compared to other Utah facilities. Longer operating histories may benefit residents, families, and staff.Rankings are based only on facilities in Utah that report data for that category. Facilities without available data are excluded from the ranking.Click the rank badge to see the full State ranking.Click here to see the full State ranking.
A longer operating history, which may indicate experience navigating regulations and delivering ongoing care.
Walk Score
Walk Score: 60 / 100 Rank #101 / 280Walk Score — State benchmarkedThis home is ranked 101st out of 280 homes in Utah. Shows how walkable this facility's neighborhood is compared to the average Walk Score across Utah facilities. Higher scores benefit residents, families, and staff.Rankings are based only on facilities in Utah that report data for that category. Facilities without available data are excluded from the ranking.Click the rank badge to see the full State ranking.Click here to see the full State ranking.
Moderately walkable. Some errands can be accomplished on foot, with a mix of nearby amenities.

About this community

License Details

Facility TypeNursing Care Facility
StatusRegulated
IssuanceJanuary 1, 1989
ExpirationJuly 31, 2027
CountySalt Lake
CMS Certification Number465094

Therapy & Rehabilitation

1 service
Rehabilitation Services

Staffing & Medical

1 service
24-Hour Staffing

Amenities & Lifestyle

Specific ProgramsPost-Hospital Care, Short-Term Rehabilitation, Post-Traumatic Injury Care
Operating HoursMon - Sun: Open 24 Hours

Contact Monument Healthcare Murray Creek

Inspection History

In Utah, the Department of Health and Human Services, Health Facility Licensing conducts regular onsite inspections to ensure compliance with state and federal healthcare standards.

Since 2021 · 5 years of data 51 deficiencies 2 inspections

Inspection Scorecard Info This scorecard compares key inspection, citation, and complaint metrics at this facility against the Utah state average. Metrics rated ≥15% worse than average are highlighted in red; those ≥15% better are highlighted in green.

Since 2021 vs. Utah state average
Overall vs. UT average 3 Worse Metrics worse than Utah average:
• Total deficiencies (264% above)
• Deficiencies per year (264% above)
• Deficiencies per inspection (443% above)
1 Better Metrics better than Utah average:
• Total inspections (33% below)
Latest Inspection June 28, 2025 Complaint Investigation

Deficiencies Info Deficiencies are formal regulatory issues recorded during state inspections.

This FacilityUT Averagevs. UT Avg
Total deficiencies Info Formal regulatory issues recorded by inspectors across all inspection types. 5114 This facility has 264% more total deficiencies than a typical Utah nursing home (51 vs. UT avg 14).↑ 264% worse
Deficiencies per year Info Average deficiencies per year since 2021. 10.22.8 This facility has 264% more deficiencies per year than a typical Utah nursing home (10.2 vs. UT avg 2.8).↑ 264% worse
Deficiencies per inspection Info Average deficiencies per inspection. 25.54.7 This facility has 443% more deficiencies per inspection than a typical Utah nursing home (25.5 vs. UT avg 4.7).↑ 443% worse

Inspections Info State inspections evaluate whether the facility meets health and safety standards.

This FacilityUT Averagevs. UT Avg
Total inspections Info Combined count of all routine and focused inspections. Excludes complaint investigations. 23 This facility has 33% fewer total inspections than a typical Utah nursing home (2 vs. UT avg 3).↓ 33% better

Inspection Reports Summary Info An editor-reviewed summary of the themes and findings across this facility's recent inspection reports.

  • June 28, 2025 routine inspection found 14 deficiencies including failure to protect residents from verbal, sexual, and physical abuse by resident and staff, and multiple care planning and infection control failures.
  • June 28, 2025 complaint investigation substantiated abuse by a registered nurse causing resident injury and found failure to timely report and investigate abuse allegations.
  • June 23, 2025 annual inspection found five deficiencies related to care planning, resident rights, and administrative policies, indicating ongoing compliance issues.

Penalties and fines

Federal penalties imposed by CMS for regulatory violations, including civil money penalties (fines) and denials of payment for new Medicare/Medicaid admissions.

Source: CMS Penalties Database

No penalties in the past 3 years

No civil money penalties or payment denials were reported in the last 3 years.

Quality of care over time

These measures show how residents usually do over time at this home, based on health outcomes and preventive care.

Long-stay resident measures
Significantly above average Utah avg: 4.0 Info CMS star rating based on long-stay quality measure performance. 5 stars = significantly above average, 1 star = significantly below average.
Hospitalizations per 1,000 days Info Number of hospitalizations per 1,000 long-stay resident days. 1.25
5% worse than Utah average

Utah average: 1.19

ED visits per 1,000 days Info Number of outpatient emergency department visits per 1,000 long-stay resident days. 0.83
45% better than Utah average

Utah average: 1.50

Short-stay resident measures
Significantly above average Utah avg: 3.3 Info CMS star rating based on short-stay quality measure performance. 5 stars = much above average, 1 star = much below average.
Re-hospitalized after SNF stay Info Percentage of short-stay residents who were re-hospitalized after their nursing home admission. 13.7%
21% better than Utah average

Utah average: 17.4%

Emergency department visits Info Percentage of short-stay residents who had an outpatient emergency department visit. 12.2%
In line with Utah average

Utah average: 11.8%

Falls with major injury Info Percentage of SNF residents who experience falls with major injury during their stay. 0.0%
100% better than Utah average

Utah average: 0.8%

Ability to care for self at discharge Info Percentage of residents at or above expected ability to care for themselves at discharge. 41.4%
23% worse than Utah average

Utah average: 53.7%

Successful return to home or community Info Rate of successful return to home or community from a skilled nursing facility. 60.4%
19% better than Utah average

Utah average: 50.6%

Breakdown by payment type

Medicare

12% of new residents, usually for short-term rehab.

Typical stay 21 days

Private pay

65% of new residents, often for short stays.

Typical stay 1 - 2 months

Medicaid

23% of new residents, often for long-term daily care.

Typical stay 9 - 10 months

Finances and operations

Based on CMS SNF Cost Report for fiscal year ending in 06/2024.

Privately-owned community
Operated by a single business entity.
Net patient revenue Info Net patient revenue — what the home actually collects for resident care, after contractual allowances, bad debt and discounts are subtracted from its gross charges (CMS cost report, Worksheet G-3). It covers resident care only; money the home earns from other sources is shown separately as "Other income."
$15.5M
Net patient income Info Net patient income: net patient revenue minus the home's total operating expenses. A positive figure means it earns more from resident care than it spends to deliver it; a negative figure means the opposite. It excludes non-operating "other income."
$508.8K
Privately-owned community Operated by a single business entity.
Net patient revenue Info Net patient revenue — what the home actually collects for resident care, after contractual allowances, bad debt and discounts are subtracted from its gross charges (CMS cost report, Worksheet G-3). It covers resident care only; money the home earns from other sources is shown separately as "Other income."
$15.5M Rank #6 / 77Revenue — State benchmarkedThis home is ranked 6th out of 77 homes in Utah. Shows this facility's annual revenue compared to the Utah average. Higher revenue generally means more resources for staffing and capital — read alongside Payroll %.Rankings are based only on facilities in Utah that report data for that category. Facilities without available data are excluded from the ranking.Click the rank badge to see the full State ranking.Click here to see the full State ranking.
Net patient income Info Net patient income: net patient revenue minus the home's total operating expenses. A positive figure means it earns more from resident care than it spends to deliver it; a negative figure means the opposite. It excludes non-operating "other income."
$508.8K
Other income Info Money the home earns outside of resident care — such as investments, grants, rentals and other non-operating sources (CMS cost report, Worksheet G-3). It is tracked separately from net patient revenue: it is not part of that figure, and it is not included in net patient income.
$206.6K
Payroll costs Info Staff salaries plus wage-related costs — benefits such as payroll taxes, health insurance and retirement — from the home's own accounting records (CMS cost report, Worksheet A). Contract or agency labor is counted separately, under other operating costs. Rank #7 / 77Payroll — State benchmarkedThis home is ranked 7th out of 77 homes in Utah. Shows total annual staff payroll benchmarked to the Utah average. Higher payroll investment relative to peers often signals better staffing and less reliance on cheaper contract labor.Rankings are based only on facilities in Utah that report data for that category. Facilities without available data are excluded from the ranking.Click the rank badge to see the full State ranking.Click here to see the full State ranking.
$6.7M 43.1% of net patient revenue Info Payroll as a share of revenue: staff salaries and wage-related benefits divided by net patient revenue. A higher figure means more of each revenue dollar goes to staff pay. Rank #62 / 77Payroll % — State benchmarkedThis home is ranked 62nd out of 77 homes in Utah. Shows payroll as a percentage of revenue versus the Utah average. Well-run Utah facilities typically land around 52–58% — the top third Statewide. Below 25% may signal understaffing or heavy agency use — read with Staffing ratings.Rankings are based only on facilities in Utah that report data for that category. Facilities without available data are excluded from the ranking.Click the rank badge to see the full State ranking.Click here to see the full State ranking.
Other operating costs Info Everything it costs to run the home apart from payroll — food, utilities, supplies, maintenance, contract labor and administration. Calculated as total operating expense minus payroll (staff salaries and wage-related benefits).
$8.3M
Total costs Info The home's total operating expense for the year — all the costs of running it, salaries included (CMS cost report, Worksheet G-3).
$14.9M

Who this home usually serves

TYPE OF STAY

Primarily long-term care, limited rehab

Most residents stay long-term, while a smaller portion are admitted for short-term rehab.

Most new residents arrive under private pay (65% of admissions), and a typical private pay stay runs around 1 - 2 months.

Admissions
413 total

Coverage residents most often arrive under.

Medicare 12%
Private pay 65%
Medicaid 23%
Discharges
399 total

Coverage residents most often leave under.

Medicare 9%
Private pay 63%
Medicaid 28%

Places of interest near Monument Healthcare Murray Creek

Address 4.1 miles from city center Info Estimated distance in miles from Salt Lake City's city center to Monument Healthcare Murray Creek's address, calculated via Google Maps.

Calculate Travel Distance to Monument Healthcare Murray Creek

Add your location

Address

Compare Nursing Homes around Salt Lake City

The information below is reported by the Utah Department of Health and Human Services, Health Facility Licensing.

4 facilities compared · CMS & UT Dept. of Health data

William E. Christoffersen Salt Lake Veterans Home
NH
MC
NC
RC
Salt Lake City (University)
81
Facility 81
UT AVG 84
Rank #89 / 196
92.1%
Facility 92.1%
UT AVG 70.1%
Rank #9 / 86
+31%
4.86
Facility 4.86
UT AVG 3.72
Rank #9 / 80
+32%+31%
$12.7k
Facility $12.7k
UT AVG $52.4k
Rank #44 / 80
22
Facility 22
UT AVG 27.7
Rank #38 / 79
5.5
Facility 5.5
UT AVG 7.6
Rank #28 / 79
175-
39
Facility 39
UT AVG 47
Rank #177 / 280
Avalon Va Management LLC
$12.8M
Facility $12.8M
UT AVG $10.3M
Rank #13 / 77
$6.9M
Facility $6.9M
UT AVG $3.8M
Rank #9 / 77
53.9%
Facility 53.9%
UT AVG 38%
Rank #28 / 77
465150
Sandstone Taylorsville
NH
NC
Salt Lake City
120
Facility 120
UT AVG 84
Rank #33 / 196
33.3%
Facility 33.3%
UT AVG 70.1%
Rank #82 / 86
-53%
3.47
Facility 3.47
UT AVG 3.72
Rank #37 / 80
-3%-7%
$7.5k
Facility $7.5k
UT AVG $52.4k
Rank #38 / 80
23
Facility 23
UT AVG 27.7
Rank #41 / 79
7.7
Facility 7.7
UT AVG 7.6
Rank #51 / 79
240-
38
Facility 38
UT AVG 47
Rank #183 / 280
Redwood Nursing & Rehab LLC
$15.1M
Facility $15.1M
UT AVG $10.3M
Rank #10 / 77
$5.1M
Facility $5.1M
UT AVG $3.8M
Rank #16 / 77
33.9%
Facility 33.9%
UT AVG 38%
Rank #68 / 77
465066
City Creek Post Acute
NH
Salt Lake City (East Central)
108
Facility 108
UT AVG 84
Rank #55 / 196
70.8%
Facility 70.8%
UT AVG 70.1%
Rank #35 / 86
+1%
3.79
Facility 3.79
UT AVG 3.72
Rank #24 / 80
-54%+2%
$0
Facility $0
UT AVG $52.4k
Rank #1 / 80
18
Facility 18
UT AVG 27.7
Rank #29 / 79
6.0
Facility 6.0
UT AVG 7.6
Rank #33 / 79
268-
75
Facility 75
UT AVG 47
Rank #36 / 280
Avenues Healthcare, Inc
$7.9M
Facility $7.9M
UT AVG $10.3M
Rank #50 / 77
$4.5M
Facility $4.5M
UT AVG $3.8M
Rank #32 / 77
57.4%
Facility 57.4%
UT AVG 38%
Rank #3 / 77
465072
Pine Creek Rehab and Nursing -
NH
HC
RC
Salt Lake City (Poplar Grove)
34
Facility 34
UT AVG 84
Rank #168 / 196
--
-
Facility -
UT AVG 3.72
Rank #62 / 80
----56%-
-
Facility -
UT AVG $52.4k
Rank #66 / 80
42
Facility 42
UT AVG 27.7
Rank #64 / 79
10.5
Facility 10.5
UT AVG 7.6
Rank #66 / 79
3--
70
Facility 70
UT AVG 47
Rank #60 / 280
----46A064

Financial Assistance for
Nursing Home in Utah

Monument Healthcare Murray Creek is located in Salt Lake City, Utah.
Here are the financial assistance programs available to residents in Utah.

Get Financial aid guidance

Aging Waiver

UT Medicaid Aging Waiver

Age 65+
General Utah resident, Medicaid-eligible, nursing home-level care need.
Income Limits (2025) ~$2,829/month 300% FBR, individual
Asset Limits $2,000 (individual), $3,000 (couple).
UT

Rural challenges; waitlists possible.

Benefits
Personal care (5-7 hours/day) Respite (240 hours/year) Adult day care ($65/day) Home modifications ($1,500 avg.)

Utah Alternatives Program

UT Alternatives

Age 60+
General Utah resident, at risk of nursing home.
Income Limits ~$2,000/month individual, varies
Asset Limits $5,000 individual
UT

Limited funding; rural focus.

Benefits
In-home care (3-5 hours/week) Respite (up to 10 days/year) Transportation (~5 trips/month)

Older Americans Act (OAA) Services

Utah OAA Services

Age 60+
General UT resident; no income/asset limits.
Income Limits (2025) None; donations encouraged.
Asset Limits Not assessed.
UT

12 AAAs; includes Meals on Wheels; rural emphasis.

Benefits
Meals (~$5-$7/meal) Transportation Homemaker services (~4 hours/week) Respite (5 days/year) Legal aid

Medicare Savings Program (MSP)

Utah Medicare Savings Program

Age 65+ or disabled
General UT resident, Medicare Part A/B.
Income Limits (2025) ~$2,510/month (QMB), ~$3,380/month (SLMB), ~$3,598/month (QI)—individual.
Asset Limits $9,430 (individual), $14,130 (couple).
UT

Includes Extra Help for Part D; no waitlist.

Benefits
Covers Part B premiums ($174.70/month) Deductibles ($240/year) Copays (~20%)

Home Energy Assistance Target (HEAT) Program

Utah HEAT Program

Age 60+ prioritized
General UT resident, low-income household.
Income Limits (2025) ~$3,970/month 185% FPL
Asset Limits Not assessed.
UT

Covers gas, electric, propane; emergency aid available.

Benefits
Heating/cooling aid ($300-$1,000/season) Crisis aid ($500 max)

Utah Caregiver Support Program

Utah Family Caregiver Support Program (FCSP)

Age
General Caregivers of 60+ needing care or 55+ caregivers of others; UT resident; 2+ ADLs.
Income Limits (2025) No strict cap; prioritizes low-income ~$24,980/year
Asset Limits Not assessed.
UT

Includes grandparent caregivers; serves ~1,500 annually.

Benefits
Respite (4-6 hours/week or 5 days/year) Adult day care ($60/day) Training Supplies (~$500/year)

VA Aid and Attendance (A&A) and Housebound Benefits

Utah VA Aid and Attendance/Housebound

Age 65+ or disabled veteran/spouse
General UT resident, wartime service, ADL help (A&A) or homebound.
Income Limits (2025) Net income < ~$1,984/month (veteran with dependent, A&A); pension offsets income.
Asset Limits ~$155,356 net worth
UT

Supports rural veterans; high demand near VA centers.

Benefits
Cash (~$1,433-$2,642/month veteran, ~$951-$1,318 spouse) for care costs

Property Tax Abatement and Deferral Programs

Utah Circuit Breaker and Deferral Programs

Age 66+ (abatement) or 75+ (deferral)
General UT resident 10+ months/year, homeowner.
Income Limits (2025) ~$40,000/year (household, abatement); no limit for deferral.
Asset Limits Not assessed; home value < ~$500,000 typical.
UT

Abatement up to $1,200; deferral accrues interest (2.5%-5%).

Benefits
Tax relief (~$500-$1,200/year) or deferral (postpones payment)

Senior Farmers’ Market Nutrition Program (SFMNP)

Utah SFMNP

Age 60+
General UT resident, low-income.
Income Limits (2025) ~$2,322/month 185% FPL
Asset Limits Not assessed.
UT

Vouchers (~$50/season); serves ~5,000 via 12 AAAs.

Benefits
Vouchers (~$50/season) for produce at farmers’ markets

Frequently Asked Questions about Monument Healthcare Murray Creek

Is Monument Healthcare Murray Creek in a walkable area?

Monument Healthcare Murray Creek has a walk score of 60. Moderately walkable. Some errands can be accomplished on foot, with a mix of nearby amenities.

When does Monument Healthcare Murray Creek's license expire?

According to UT state health department records, Monument Healthcare Murray Creek's license expires on July 31, 2027.

What is the occupancy rate at Monument Healthcare Murray Creek?

Monument Healthcare Murray Creek's occupancy is 58.1%.

How many beds does Monument Healthcare Murray Creek have?

Monument Healthcare Murray Creek has 184 beds.

Are there photos of Monument Healthcare Murray Creek?

Yes — there are 4 photos of Monument Healthcare Murray Creek in the photo gallery on this page.

What is the address of Monument Healthcare Murray Creek?

Monument Healthcare Murray Creek is located at 3855 South 700 East, Salt Lake City, UT 84106.

What is the phone number of Monument Healthcare Murray Creek?

(801) 268-4766 will put you in contact with the team at Monument Healthcare Murray Creek.

Guides for Better Senior Living

Care Cost Calculator: See Prices in Your Area

Nursing Home Data Explorer

Don’t Wait Too Long: 7 Red Flag Signs Your Parent Needs Assisted Living Now

The True Cost of Assisted Living in 2025 – And How Families Are Paying For It

Understanding Senior Living Costs: Pricing Models, Discounts & Financial Assistance