Morningside of Concord
Nursing Home, Assisted Living, Memory Care & Respite Care · North Carolina, NC
CMS overall rating Info CMS (the Centers for Medicare & Medicaid Services) is the federal agency that rates nursing home quality. Its Overall Rating runs from 1 to 5 stars, combining health inspections, staffing, and quality measures, with inspections weighted most heavily.

Morningside of Concord

Nursing Home, Assisted Living, Memory Care & Respite Care · North Carolina, NC
CMS overall rating Info CMS (the Centers for Medicare & Medicaid Services) is the federal agency that rates nursing home quality. Its Overall Rating runs from 1 to 5 stars, combining health inspections, staffing, and quality measures, with inspections weighted most heavily.
Calculator: See prices in your area
Morningside of Concord accepts Medicare, Medicaid, and private pay.

Overview of Morningside of Concord

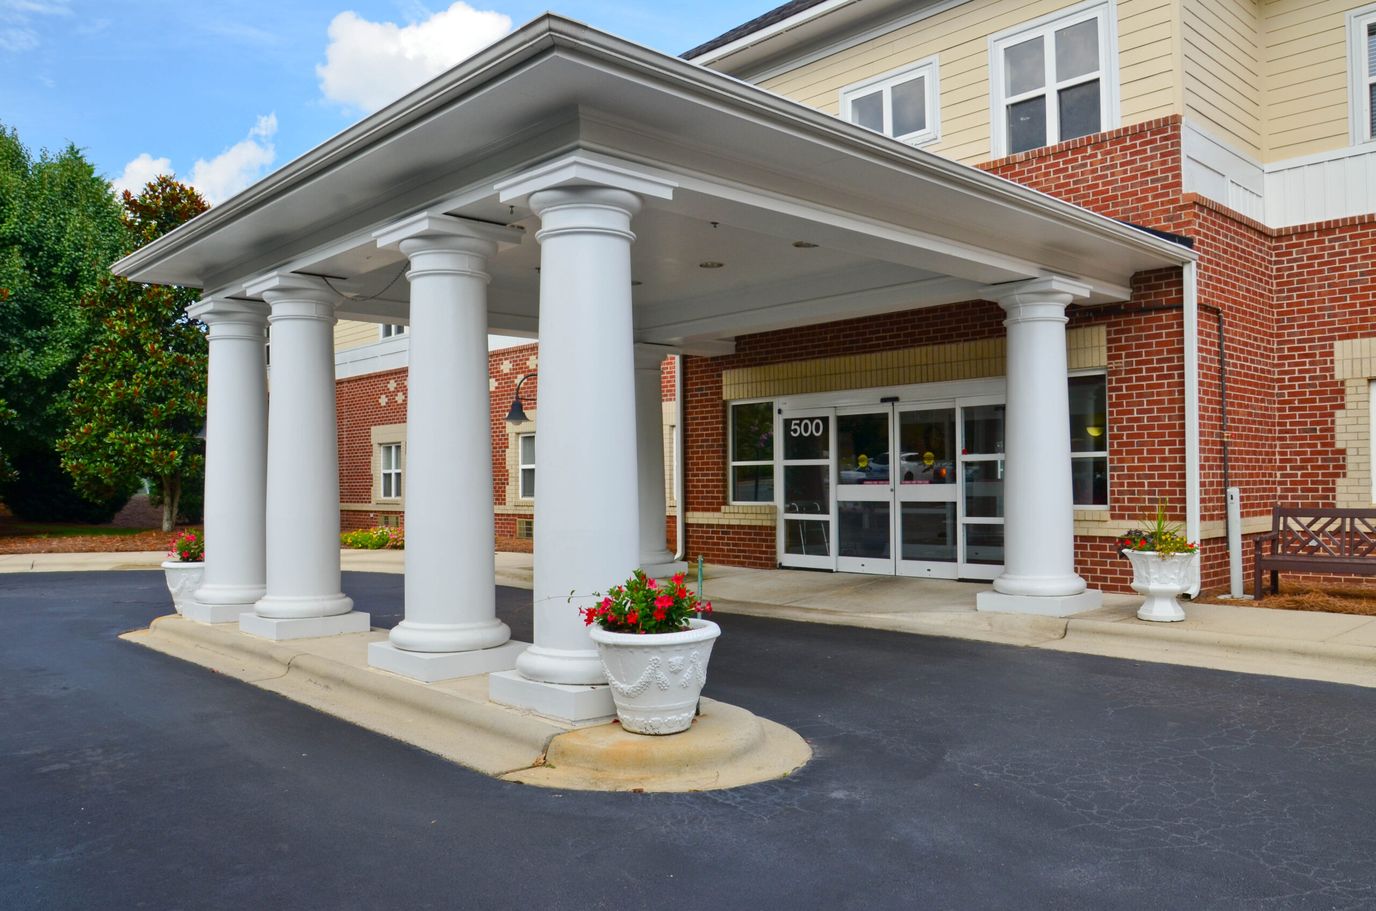
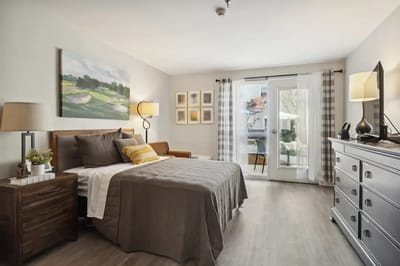
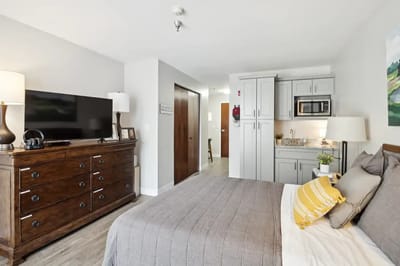
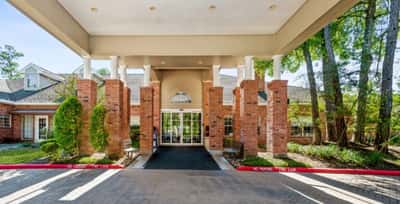
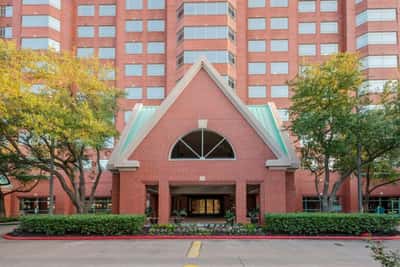
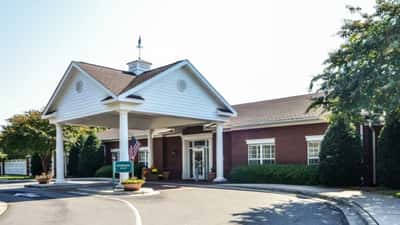
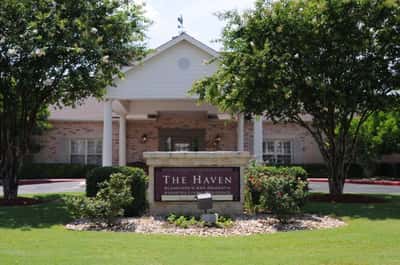
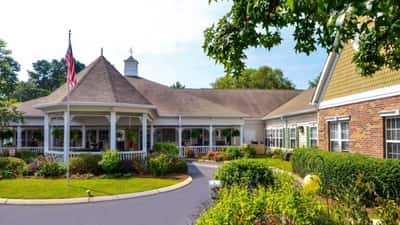
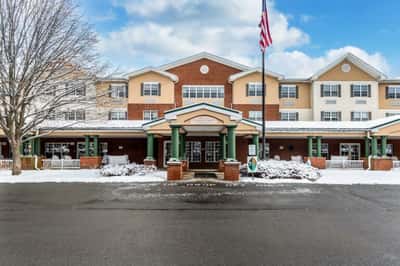
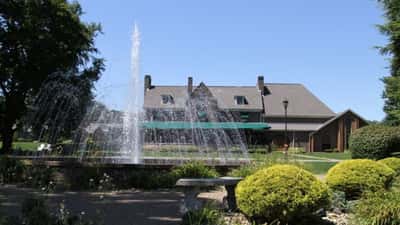
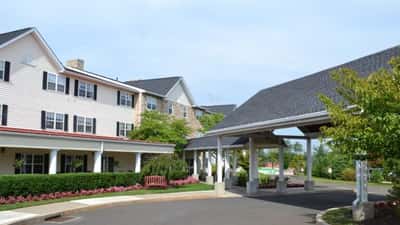
Enjoy comfort and convenience at Morningside of Concord, a secured senior living community located in the charming town of Concord, North Carolina. Offering a range of senior living options, including assisted living, memory care, and respite care, residents enjoy comfortable studio and one-bedroom apartments equipped with spacious private bathrooms and large closets. With convenient access to activities like a salon visit or relaxing by the fireplace, seniors can easily engage in their daily routines while feeling right at home.

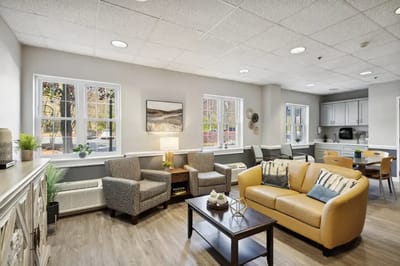
The community is dedicated to providing a stress-free environment where residents can focus on enjoying life. With a dedicated team that has years of experience, they offer a variety of amenities and programs, including Lifestyle360 activities, group trips, and restaurant-style dining. From creating arts and crafts to exploring the local area, residents have countless

(704) 795-1200

Quality ratings

Measured by Centers for Medicare & Medicaid Services (CMS)

Overall rating Info The Overall CMS Rating combines results from health inspections, staffing levels and quality measures. Health inspections carry the most weight. Staffing and quality scores can increase or decrease the final rating based on performance compared to state and national standards.
▼ 64.2% Below NC avg. ▼ 64.2% Below NC avg.NC average: 2.8Click the badge to see the full State ranking.Click here to see the full State ranking.
Health Inspection Info Based on the results of the facility's three most recent standard inspections and any complaint investigations. CMS reviews the number, scope, and severity of deficiencies, with more recent findings weighted more heavily.
▼ 29.2% Below NC avg. ▼ 29.2% Below NC avg.NC average: 2.8Click the badge to see the full State ranking.Click here to see the full State ranking.
Staffing Info Measures average nursing staff hours per resident per day, including Registered Nurses (RNs) and total nursing staff. Ratings are adjusted based on the level of care residents require and are compared to state and national benchmarks.
▼ 62.4% Below NC avg. ▼ 62.4% Below NC avg.NC average: 2.7Click the badge to see the full State ranking.Click here to see the full State ranking.
Quality Measures Info Based on clinical and physical health indicators reported to CMS, such as hospital readmissions, falls, pressure ulcers, and improvements in mobility. These measures reflect how well residents' health needs are being managed.
▼ 37.0% Below NC avg. ▼ 37.0% Below NC avg.NC average: 3.2Click the badge to see the full State ranking.Click here to see the full State ranking.

Staffing hours breakdown

Info Daily nursing hours per resident by staff type, reported to CMS. Higher is generally better — compare this facility to state and national averages to see where staffing stands.

Hours per resident per day — compared to North Carolina state averages

Total nursing care / resident Info This home is ranked 94th out of 130 homes in North Carolina for nurse hours. Total adjusted nursing hours per resident per day, combining RN, LPN, and aide time. CMS adjusts this for case-mix so facilities can be fairly compared.
3h 43m per day
Rank #94 / 130Nurse hours — State benchmarkedThis home is ranked 94th out of 130 homes in Nebraska. Shows adjusted nurse hours per resident per day benchmarked to the Nebraska average, with a ranking across 130 Nebraska facilities. More hours mean more direct care. The national average is about 3.5 hrs; below 3.0 is a red flag.Rankings are based only on facilities in Nebraska that report data for that category. Facilities without available data are excluded from the ranking.Click the rank badge to see the full State ranking.Click here to see the full State ranking.
This facility North Carolina avg (3h 59m per day)
vs North Carolina avg
-7%

6 of 6 metrics below state avg

Staff typeHours / Day / Residentvs state avg
Registered Nurse (RN) Info RNs hold the highest nursing license and can assess residents, interpret test results, and direct care plans. More RN hours per day often signals stronger clinical oversight and faster response to health changes. 32m per day ▼ 12% State avg: 37m per day · National avg: 41m per day
LPN / LVN Info Licensed Practical Nurses (LPNs) or Licensed Vocational Nurses (LVNs) deliver routine hands-on care — medication administration, wound dressing, and monitoring vital signs. They work under RN supervision and make up a large share of daily bedside care. 52m per day ▼ 3% State avg: 53m per day · National avg: 52m per day
Nurse Aide Info Certified Nurse Aides (CNAs) provide the most direct day-to-day assistance: bathing, dressing, feeding, and mobility. Nurse aide hours are typically the largest staffing category and directly affect residents' quality of life. 1h 54m per day ▼ 18% State avg: 2h 19m per day · National avg: 2h 20m per day
Weekend Total Nursing Info Combined nursing hours (RN + LPN + Nurse Aide) per resident per day on weekends. Staffing often drops on weekends — this figure reveals whether the facility maintains adequate coverage outside of weekday hours. 3h 2m per day ▼ 12% State avg: 3h 26m per day · National avg: 3h 27m per day
Physical Therapist Info Hours per resident per day provided by licensed Physical Therapists (PTs) or PT Assistants. PT services help residents recover mobility after injury or illness and are especially important for post-acute (short-stay) rehabilitation. 1m per day ▼ 78% State avg: 5m per day · National avg: 4m per day
Weekend RN Info Registered nurse hours specifically on weekends. Facilities sometimes reduce RN presence on Saturdays and Sundays — a low weekend RN figure compared to weekday hours can indicate reduced clinical oversight when most administrative staff are absent. 13m per day ▼ 48% State avg: 24m per day · National avg: 29m per day

Capacity and availability

Avg. Length of Stay
162 days
Bed community size
105-bed community Rank #59 / 228Bed count — State benchmarkedThis home is ranked 59th out of 228 homes in Nebraska. Shows this facility's certified or reported bed count compared to other Nebraska facilities. Larger communities may offer more amenities, programs, and on-site services for residents and families.Rankings are based only on facilities in Nebraska that report data for that category. Facilities without available data are excluded from the ranking.Click the rank badge to see the full State ranking.Click here to see the full State ranking.
A larger shared setting that may offer more common spaces and organized community services.
Walk Score
Walk Score: 29 / 100 Rank #224 / 298Walk Score — State benchmarkedThis home is ranked 224th out of 298 homes in Nebraska. Shows how walkable this facility's neighborhood is compared to the average Walk Score across Nebraska facilities. Higher scores benefit residents, families, and staff.Rankings are based only on facilities in Nebraska that report data for that category. Facilities without available data are excluded from the ranking.Click the rank badge to see the full State ranking.Click here to see the full State ranking.
Somewhat walkable. A few nearby services may be reachable on foot, but most trips require transportation.

About this community

Occupancy

Occupancy rate
60%
Rank #152 / 196Occupancy rate — State benchmarkedThis home is ranked 152nd out of 196 homes in Nebraska. Shows this facility's occupancy rate versus the Nebraska average, with its Statewide rank out of 196. Higher occupancy signals strong local demand and financial stability.Rankings are based only on facilities in Nebraska that report data for that category. Facilities without available data are excluded from the ranking.Click the rank badge to see the full State ranking.Click here to see the full State ranking.
Lower than the North Carolina average: 76.4%
Occupied beds
63 / 105
Average occupied beds in North Carolina homes 85 beds

License Details

StatusActive
CountyCabarrus
License NumberHAL-013-053

Performance summary

Key indicators of commitment to quality care and safety.

Ratings

Division Of Health Service Rating
4/4

North Carolina average: 4 stars See full North Carolina ranking

Scores

DHSR Score
103.50 / 200

Quality score (0-200). Higher scores indicate better performance in inspections and compliance.

North Carolina average: 104 See full North Carolina ranking

Contact Morningside of Concord

Inspection History

In North Carolina, the Department of Health and Human Services, Division of Health Service Regulation conducts unannounced surveys to ensure nursing and adult care homes meet safety standards.

Since 2015 · 11 years of data 49 deficiencies 20 inspections 0 penalties 15 inspections with deficiencies

Inspection Scorecard Info This scorecard compares key inspection, citation, and complaint metrics at this facility against the North Carolina state average. Metrics rated ≥15% worse than average are highlighted in red; those ≥15% better are highlighted in green.

Since 2015 vs. North Carolina state average
Overall vs. NC average 3 Worse Metrics worse than North Carolina average:
• Total inspections (54% above)
• Inspections with deficiencies (275% above)
• Inspection deficiency rate (142% above)
3 Better Metrics better than North Carolina average:
• Total deficiencies (6% below)
• Deficiencies per year (4% below)
• Deficiencies per inspection (38% below)
Latest Inspection June 19, 2024 Follow Up

Deficiencies Info Deficiencies are formal regulatory issues recorded during state inspections.

This FacilityNC Averagevs. NC Avg
Total deficiencies Info Formal regulatory issues recorded by inspectors across all inspection types. 4952 This facility has 6% fewer total deficiencies than a typical North Carolina nursing home (49 vs. NC avg 52).↓ 6% better
Deficiencies per year Info Average deficiencies per year since 2015. 4.54.7 This facility has 4% fewer deficiencies per year than a typical North Carolina nursing home (4.5 vs. NC avg 4.7).↓ 4% better
Deficiencies per inspection Info Average deficiencies per inspection. 2.54 This facility has 38% fewer deficiencies per inspection than a typical North Carolina nursing home (2.5 vs. NC avg 4).↓ 38% better

Inspections Info State inspections evaluate whether the facility meets health and safety standards.

This FacilityNC Averagevs. NC Avg
Total inspections Info Combined count of all routine and focused inspections. Excludes complaint investigations. 2013 This facility has 54% more total inspections than a typical North Carolina nursing home (20 vs. NC avg 13).↑ 54% worse
Inspections with deficiencies Info Inspections that resulted in at least one regulatory deficiency. 154 This facility has 275% more inspections with deficiencies than a typical North Carolina nursing home (15 vs. NC avg 4).↑ 275% worse
Inspection deficiency rate Info Percentage of inspections that resulted in at least one deficiency. 75%31% This facility has 44 percentage points higher inspection deficiency rate than a typical North Carolina nursing home (75% vs. NC avg 31%).↑ 44% worse

Inspection Reports Summary Info An editor-reviewed summary of the themes and findings across this facility's recent inspection reports.

  • The June 19, 2024 follow-up survey confirmed all prior deficiencies were corrected with no further action needed.
  • The March 19, 2024 inspection found three deficiencies for missing sprinkler heads in the Boiler Room, SCU Med Room closet, and Elevator Equipment Room.
  • The July 27, 2023 survey cited 11 deficiencies including fire safety issues with sprinkler protection, electromagnetic locks, unsecured oxygen bottles, and emergency lighting failures.

Health Inspection History

Inspections since 2022
Total health inspections 3

North Carolina average 4


Last Health inspection on Apr 2025

Total health citations
31 Rank #115 / 135Health citations — State benchmarkedThis home is ranked 115th out of 135 homes in Nebraska. Shows this facility's total health deficiency citations benchmarked to the Nebraska State average, with a ranking across all 135 NE facilities. Lower citation counts earn a better rank.Rankings are based only on facilities in Nebraska that report data for that category. Facilities without available data are excluded from the ranking.Click the rank badge to see the full State ranking.Click here to see the full State ranking.

North Carolina average 20.9

Citations per inspection
10.33 Rank #135 / 135Citations per inspection — State benchmarkedThis home is ranked 135th out of 135 homes in Nebraska. Shows average deficiency citations per CMS inspection for this facility versus the Nebraska mean across 135 facilities with citation data. Lower is better.Rankings are based only on facilities in Nebraska that report data for that category. Facilities without available data are excluded from the ranking.Click the rank badge to see the full State ranking.Click here to see the full State ranking.

North Carolina average 4.99


Health citations are formal notices following inspections when they fail to comply with safety and care standards.

11 of 31 citations resulted from standard inspections; and 20 of 31 came from combined inspections (standard and complaint).

Breakdown of citation severity (last 4 years)
Critical health citations
0
100% better than North Carolina average

North Carolina average: 1.3


Serious health citations
2
122% worse than North Carolina average

North Carolina average: 0.9

0 critical citations North Carolina average: 1.3

2 serious citations North Carolina average: 0.9

27 moderate citations North Carolina average: 17.1

2 minor citations North Carolina average: 1.6
Citations history (last 4 years)
Abuse/Neglect moderate citation Apr 17, 2025
Corrected

Abuse/Neglect moderate citation Apr 17, 2025
Corrected

Infection Control moderate citation Apr 17, 2025
Corrected

Nutrition moderate citation Apr 17, 2025
Corrected

Staffing Data

Reporting period: October 1 – December 31, 2025 (Q4 2025). Source: CMS Payroll-Based Journal report.

Total staff 91
Employees 58
Contractors 33
Staff to resident ratio 1.14 : 1
37% fewer staff per resident than North Carolina average
North Carolina average ratio: 1.80 : 1 North Carolina average ratio: 1.80 : 1See full North Carolina ranking
Avg staff/day 31
Average shift 9 hours
13% better than North Carolina average
North Carolina average: 8 hours North Carolina average shift: 8 hoursSee full North Carolina ranking
Total staff hours (quarter) 25,602

Nursing staff breakdown

Q4 2025 · Oct 1 – Dec 31 More info This data comes from the CMS Payroll-Based Journal report covering October 1 – December 31, 2025.
Registered Nurse

Manages medical care and health needs.

RN Staff Info All 8 RN Staff are full-time employees. No contractors work on this role. 8
Average shift length Info Average shift length. Calculated as total hours divided by days worked and average staff per day. 9.4 hours
Licensed Practical Nurse

Assists with medical care and medications.

LPN Staff Info 13 total: 9 full-time employees and 4 contractors. 13
Average shift length Info Average shift length. Calculated as total hours divided by days worked and average staff per day. 10.7 hours
Certified Nursing Assistant

Helps with daily care and mobility.

CNA Staff Info 43 total: 30 full-time employees and 13 contractors. 43
Average shift length Info Average shift length. Calculated as total hours divided by days worked and average staff per day. 9.7 hours

Contractor staffing

Q4 2025 · Oct 1 – Dec 31 More info This data comes from the CMS Payroll-Based Journal report covering October 1 – December 31, 2025.

Total hours from contractors

31.3%

8,024 contractor hours this quarter

Certified Nursing Assistant: 13 Licensed Practical Nurse: 4 Respiratory Therapy Technician: 3 Speech Language Pathologist: 2 Physical Therapy Assistant: 2 Occupational Therapy Aide: 2 Qualified Social Worker: 2 Occupational Therapy Assistant: 2 Physical Therapy Aide: 1 Medical Director: 1 Administrator: 1

Staff by category

Q4 2025 · Oct 1 – Dec 31 More info This data comes from the CMS Payroll-Based Journal report covering October 1 – December 31, 2025.
Certified Nursing Assistant30134312,26292100%9.7
Licensed Practical Nurse94135,85692100%10.7
Registered Nurse8081,9499199%9.4
Clinical Nurse Specialist3031,1946975%8.1
Administrator1128086773%8.3
Speech Language Pathologist0225106672%7.7
Nurse Practitioner1015046368%8
Dietitian1014756773%7.1
Medication Aide/Technician2024173841%11
Other Dietary Services Staff1013364347%7.8
Physical Therapy Aide0112725358%5.1
Qualified Social Worker0222715358%5
Nurse Aide in Training2022035155%4
Physical Therapy Assistant0221954043%4.9
Respiratory Therapy Technician0331313235%4
Occupational Therapy Aide0221302932%4.2
Occupational Therapy Assistant0225489%6.8
Medical Director0113667%6
43 Certified Nursing Assistant
% of Days 100%
13 Licensed Practical Nurse
% of Days 100%
8 Registered Nurse
% of Days 99%
3 Clinical Nurse Specialist
% of Days 75%
2 Administrator
% of Days 73%
2 Speech Language Pathologist
% of Days 72%
1 Nurse Practitioner
% of Days 68%
1 Dietitian
% of Days 73%
2 Medication Aide/Technician
% of Days 41%
1 Other Dietary Services Staff
% of Days 47%
1 Physical Therapy Aide
% of Days 58%
2 Qualified Social Worker
% of Days 58%
2 Nurse Aide in Training
% of Days 55%
2 Physical Therapy Assistant
% of Days 43%
3 Respiratory Therapy Technician
% of Days 35%
2 Occupational Therapy Aide
% of Days 32%
2 Occupational Therapy Assistant
% of Days 9%
1 Medical Director
% of Days 7%

Penalties and fines

Includes penalties issued in 2024

Federal penalties imposed by CMS for regulatory violations, including civil money penalties (fines) and denials of payment for new Medicare/Medicaid admissions.

Source: CMS Penalties Database (Data as of Jan 2026)

Total fines amount $14K Rank #107 / 135Federal fines — State benchmarkedThis home is ranked 107th out of 135 homes in Nebraska. Shows this facility's cumulative CMS federal fine dollars versus the Nebraska average among facilities with fines, and where it ranks among 135 facilities in the pool. Lower total dollars mean a better rank.Rankings are based only on facilities in Nebraska that report data for that category. Facilities without available data are excluded from the ranking.Click the rank badge to see the full State ranking.Click here to see the full State ranking.
81% lower than North Carolina average

North Carolina average: $76K

Number of fines 1
57% fewer fines than North Carolina average

North Carolina average: 2.3

Payment Denials Info Serious action where Medicare and/or Medicaid temporarily stops payments for new residents until issues are fixed. 1
159% more payment denials than North Carolina average

North Carolina average: 0.4

Fines amount comparison
This facility $14K
North Carolina average $76K
Penalty History

Penalties are imposed by CMS for violations of federal nursing home regulations.

2 penalties in the past 3 years

Multiple penalties were reported in the last 3 years.

Civil Money Penalty Info Fines imposed for noncompliance, which can be assessed per day or per instance of violation. Jan 26, 2024
$14K
Payment Denial Info Serious action where Medicare and/or Medicaid temporarily stops payments for new residents until issues are fixed. Jan 26, 2024
17 days

Last updated: Jan 2026

Quality of care over time

These measures show how residents usually do over time at this home, based on health outcomes and preventive care.

High-risk clinical events score Info A composite score based on pressure ulcers, falls with injury, weight loss, walking ability decline, and activities of daily living decline. 13.2
15% worse than North Carolina average

North Carolina average: 11.5

Functional decline score Info A composite score based on activities of daily living decline, walking ability decline, and incontinence. 23.9
16% worse than North Carolina average

North Carolina average: 20.6

Long-stay resident measures
Need for Help with Daily Activities Increased Info Percent of long-stay residents whose need for help with daily activities has increased 21.1%
20% worse than North Carolina average

North Carolina average: 17.5%

Walking Ability Worsened Info Percent of long-stay residents whose ability to move independently worsened 28.2%
21% worse than North Carolina average

North Carolina average: 23.3%

Low Risk Residents with Bowel/Bladder Incontinence Info Percent of low risk long-stay residents who lose control of their bowels or bladder 22.3%
In line with North Carolina average

North Carolina average: 21.4%

Falls with Major Injury Info Percent of long-stay residents experiencing one or more falls with major injury 3.7%
In line with North Carolina average

North Carolina average: 3.6%

High Risk Residents with Pressure Ulcers Info Percent of long-stay high risk residents with pressure ulcers 3.8%
39% better than North Carolina average

North Carolina average: 6.3%

Urinary Tract Infection Info Percent of long-stay residents with a urinary tract infection 3.3%
26% worse than North Carolina average

North Carolina average: 2.6%

Lost Too Much Weight Info Percent of long-stay residents who lose too much weight 9.0%
22% worse than North Carolina average

North Carolina average: 7.4%

Depressive Symptoms Info Percent of long-stay residents who have depressive symptoms 2.0%
56% better than North Carolina average

North Carolina average: 4.4%

Antipsychotic Use Info Percent of long-stay residents who received an antipsychotic medication 16.2%
20% worse than North Carolina average

North Carolina average: 13.4%

Pneumococcal Vaccine Info Percent of long-stay residents assessed and appropriately given the pneumococcal vaccine 100.0%
9% better than North Carolina average

North Carolina average: 91.6%

Influenza Vaccine Info Percent of long-stay residents assessed and appropriately given the seasonal influenza vaccine 98.6%
5% better than North Carolina average

North Carolina average: 94.1%

Short-stay resident measures
Pneumococcal Vaccine Info Percent of short-stay residents assessed and appropriately given the pneumococcal vaccine 79.5%
In line with North Carolina average

North Carolina average: 79.9%

Antipsychotic medication increase Info Percent of short-stay residents who newly received an antipsychotic medication 1.8%
22% worse than North Carolina average

North Carolina average: 1.5%

Influenza Vaccine Info Percent of short-stay residents assessed and appropriately given the seasonal influenza vaccine 77.8%
In line with North Carolina average

North Carolina average: 78.1%

Breakdown by payment type

Medicare

26% of new residents, usually for short-term rehab.

Typical stay 1 - 2 months

Private pay

55% of new residents, often for short stays.

Typical stay 2 months

Medicaid

18% of new residents, often for long-term daily care.

Typical stay 1 - 2 years

Facility Characteristics

Source: CMS Long-Term Care Facility Characteristics (Data as of Jan 2026)

Total residents 80
Medicare
8
10% of residents
Medicaid
34
42.5% of residents
Private pay or other
38
47.5% of residents
Programs & Services
Residents Group

Residents meet regularly to discuss policies, care quality, and activities

Active Resident Council

Organized group of residents that meets regularly to discuss facility policies, quality of life, and activities.

Finances and operations

Based on CMS SNF Cost Report for fiscal year ending in 12/2023.

Privately-owned community
Operated by a single business entity.
Net patient revenue Info Net patient revenue — what the home actually collects for resident care, after contractual allowances, bad debt and discounts are subtracted from its gross charges (CMS cost report, Worksheet G-3). It covers resident care only; money the home earns from other sources is shown separately as "Other income."
$8.8M
Net patient income Info Net patient income: net patient revenue minus the home's total operating expenses. A positive figure means it earns more from resident care than it spends to deliver it; a negative figure means the opposite. It excludes non-operating "other income."
-$990.6K
Privately-owned community Operated by a single business entity.
Net patient revenue Info Net patient revenue — what the home actually collects for resident care, after contractual allowances, bad debt and discounts are subtracted from its gross charges (CMS cost report, Worksheet G-3). It covers resident care only; money the home earns from other sources is shown separately as "Other income."
$8.8M Rank #63 / 133Revenue — State benchmarkedThis home is ranked 63rd out of 133 homes in Nebraska. Shows this facility's annual revenue compared to the Nebraska average. Higher revenue generally means more resources for staffing and capital — read alongside Payroll %.Rankings are based only on facilities in Nebraska that report data for that category. Facilities without available data are excluded from the ranking.Click the rank badge to see the full State ranking.Click here to see the full State ranking.
Net patient income Info Net patient income: net patient revenue minus the home's total operating expenses. A positive figure means it earns more from resident care than it spends to deliver it; a negative figure means the opposite. It excludes non-operating "other income."
-$990.6K
Other income Info Money the home earns outside of resident care — such as investments, grants, rentals and other non-operating sources (CMS cost report, Worksheet G-3). It is tracked separately from net patient revenue: it is not part of that figure, and it is not included in net patient income.
$13.2K
Payroll costs Info Staff salaries plus wage-related costs — benefits such as payroll taxes, health insurance and retirement — from the home's own accounting records (CMS cost report, Worksheet A). Contract or agency labor is counted separately, under other operating costs. Rank #31 / 133Payroll — State benchmarkedThis home is ranked 31st out of 133 homes in Nebraska. Shows total annual staff payroll benchmarked to the Nebraska average. Higher payroll investment relative to peers often signals better staffing and less reliance on cheaper contract labor.Rankings are based only on facilities in Nebraska that report data for that category. Facilities without available data are excluded from the ranking.Click the rank badge to see the full State ranking.Click here to see the full State ranking.
$5.7M 65.2% of net patient revenue Info Payroll as a share of revenue: staff salaries and wage-related benefits divided by net patient revenue. A higher figure means more of each revenue dollar goes to staff pay. Rank #4 / 133Payroll % — State benchmarkedThis home is ranked 4th out of 133 homes in Nebraska. Shows payroll as a percentage of revenue versus the Nebraska average. Well-run Nebraska facilities typically land around 66–74% — the top third Statewide. Below 25% may signal understaffing or heavy agency use — read with Staffing ratings.Rankings are based only on facilities in Nebraska that report data for that category. Facilities without available data are excluded from the ranking.Click the rank badge to see the full State ranking.Click here to see the full State ranking.
Other operating costs Info Everything it costs to run the home apart from payroll — food, utilities, supplies, maintenance, contract labor and administration. Calculated as total operating expense minus payroll (staff salaries and wage-related benefits).
$4.0M
Total costs Info The home's total operating expense for the year — all the costs of running it, salaries included (CMS cost report, Worksheet G-3).
$9.8M

What does this home offer?

Pets allowed icon
Pets allowed icon

Pets Allowed

Housing options icon

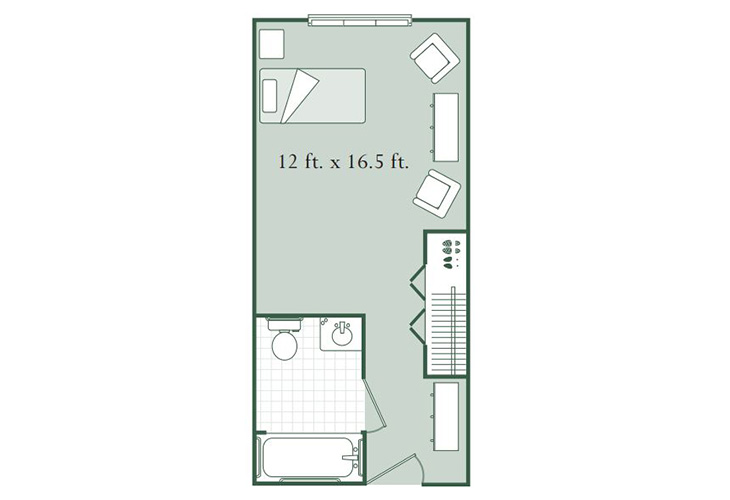
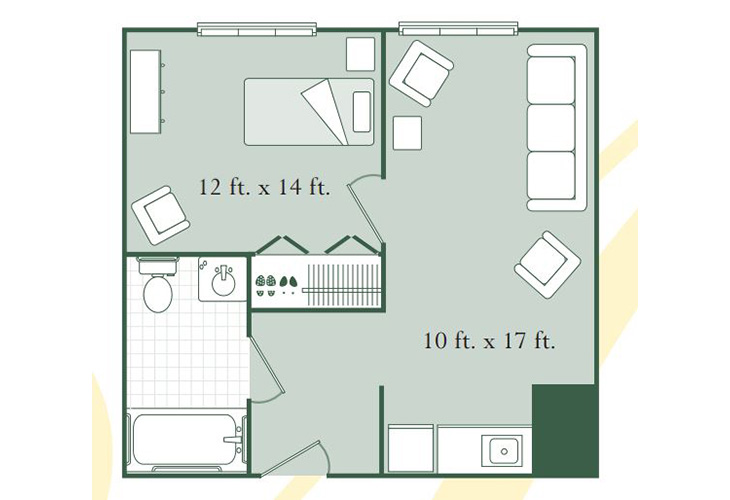
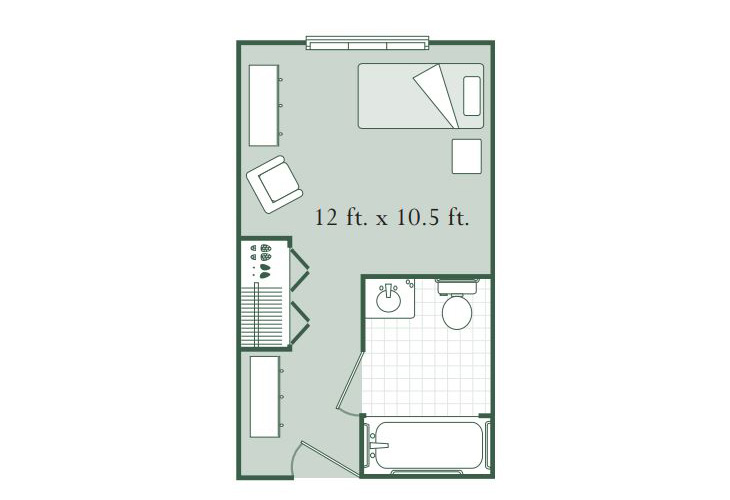
Housing Options: Studio / 1 Bed

Building type icon
Building type icon

Building Type: 2-story

Beauty services icon

Beauty Services

Transportation services icon

Transportation Services

Housekeeping icon
Housekeeping icon

Housekeeping Services

Recreational activities icon

Recreational Activities

Exercise program icon

Exercise Programs

Who this home usually serves

TYPE OF STAY

Mix of rehab and long-term care

This home supports both short-term rehab and long-term care, with residents staying for a wide range of durations.

Most new residents arrive under private pay (55% of admissions), and a typical private pay stay runs around 2 months.

Admissions
173 total

Coverage residents most often arrive under.

Medicare 26%
Private pay 55%
Medicaid 18%
Discharges
163 total

Coverage residents most often leave under.

Medicare 17%
Private pay 45%
Medicaid 39%

Living Spaces & Floor Plans for Morningside of Concord

Morningside Of Concord Al Mc Studio 1
Morningside Of Concord Al Mc Deluxe Studio
Morningside Of Concord Al Mc 1 Bedroom Suite
Morningside Of Concord Al Mc Studio

Places of interest near Morningside of Concord

Address 4.0 miles from city center Info Estimated distance in miles from Concord's city center to Morningside of Concord's address, calculated via Google Maps.

Calculate Travel Distance to Morningside of Concord

Add your location

Address

Compare Nursing Homes around North Carolina

The information below is reported by the North Carolina Department of Health and Human Services, Division of Health Service Regulation.

5 facilities compared · CMS & NC Dept. of Health data

Brookdale Carriage Club Providence
NH
AL
IL
MC
Charlotte (Olde Providence North)
77
Facility 77
NC AVG 72
Rank #168 / 390
71.5%
Facility 71.5%
NC AVG 76.4%
Rank #145 / 271
-6%
8.12
Facility 8.12
NC AVG 3.98
Rank #4 / 97
+78%+104%
$0
Facility $0
NC AVG $74.6k
Rank #1 / 105
11
Facility 11
NC AVG 20.9
Rank #39 / 101
3.7
Facility 3.7
NC AVG 5.0
Rank #43 / 101
-7A+
12
Facility 12
NC AVG 33
Rank #440 / 572
Bkd Fm Holding Company LLC
$19.6M
Facility $19.6M
NC AVG $13.2M
Rank #99 / 104
$8.1M
Facility $8.1M
NC AVG $4.9M
Rank #39 / 104
41.6%
Facility 41.6%
NC AVG 39.8%
Rank #1 / 104
345482
Wesley Pines
NH
AL
IL
MC
Lumberton
62
Facility 62
NC AVG 72
Rank #225 / 390
86.1%
Facility 86.1%
NC AVG 76.4%
Rank #74 / 271
+13%
4.60
Facility 4.60
NC AVG 3.98
Rank #28 / 97
-29%+16%
$0
Facility $0
NC AVG $74.6k
Rank #1 / 105
4
Facility 4
NC AVG 20.9
Rank #12 / 101
2.0
Facility 2.0
NC AVG 5.0
Rank #13 / 101
-58A+
9
Facility 9
NC AVG 33
Rank #462 / 572
The United Methodist Retirement Homes, Incorporated
$10.2M
Facility $10.2M
NC AVG $13.2M
Rank #79 / 104
$5.8M
Facility $5.8M
NC AVG $4.9M
Rank #64 / 104
56.7%
Facility 56.7%
NC AVG 39.8%
Rank #17 / 104
345180
Pineville Rehabilitation & Living Center
NH
AL
HC
RC
Pineville (Lakeview Drive)
106
Facility 106
NC AVG 72
Rank #68 / 390
68.3%
Facility 68.3%
NC AVG 76.4%
Rank #154 / 271
-11%
3.96
Facility 3.96
NC AVG 3.98
Rank #43 / 97
+39%0%
$15.5k
Facility $15.5k
NC AVG $74.6k
Rank #62 / 105
45
Facility 45
NC AVG 20.9
Rank #95 / 101
9.0
Facility 9.0
NC AVG 5.0
Rank #97 / 101
396A+
25
Facility 25
NC AVG 33
Rank #346 / 572
Ncnh Holdings LLC
$10.7M
Facility $10.7M
NC AVG $13.2M
Rank #73 / 104
$3.7M
Facility $3.7M
NC AVG $4.9M
Rank #75 / 104
34.5%
Facility 34.5%
NC AVG 39.8%
Rank #40 / 104
345415
Walnut Ridge
NH
AL
IL
MC
Walnut Cove (Windmill Street)
63
Facility 63
NC AVG 72
Rank #224 / 390
100.0%
Facility 100.0%
NC AVG 76.4%
Rank #1 / 271
+31%
3.12
Facility 3.12
NC AVG 3.98
Rank #94 / 97
-50%-22%
$40.1k
Facility $40.1k
NC AVG $74.6k
Rank #76 / 105
23
Facility 23
NC AVG 20.9
Rank #72 / 101
4.6
Facility 4.6
NC AVG 5.0
Rank #57 / 101
363A+
50
Facility 50
NC AVG 33
Rank #149 / 572
Nita Davis
$10.4M
Facility $10.4M
NC AVG $13.2M
Rank #68 / 104
$3.9M
Facility $3.9M
NC AVG $4.9M
Rank #97 / 104
37%
Facility 37%
NC AVG 39.8%
Rank #100 / 104
345089
Morningside of Concord
NH
AL
MC
RC
Concord105 60.3% -14%3.71 -9%-17%$14.1k3110.3274- 29 John M Faust Living Trust$8.8M$5.7M65.2%345193

Financial Assistance for
Nursing Home in North Carolina

Morningside of Concord is located in Concord, North Carolina.
Here are the financial assistance programs available to residents in North Carolina.

Get Financial aid guidance

Community Alternatives Program for Disabled Adults

NC Medicaid CAP/DA

Age 65+ or disabled
General North Carolina resident, Medicaid- eligible, nursing home-level care need.
Income Limits (2025) ~$2,829/month 300% FBR, individual
Asset Limits $2,000 (individual), $3,000 (couple).
NC

High demand; waitlists common in urban areas.

Benefits
Personal care (5-7 hours/day) Respite (240 hours/year) Adult day care ($60/day) Home modifications ($1,500 avg.)

North Carolina Senior Care Options

NC SCO (via NFCSP)

Age Caregiver of someone 60+ (or with dementia)
General North Carolina resident.
Income Limits No strict limit; prioritizes low-income.
Asset Limits Not applicable.
NC

Limited slots; rural/urban balance.

Benefits
In-home respite (4-6 hours/day) Adult day care (~$60/day) Short-term facility care (up to 5 days)

Program of All-Inclusive Care for the Elderly (PACE)

North Carolina PACE (e.g., PACE of the Triad)

Age 55+
General NC resident (specific counties), NFLOC, safe with PACE support.
Income Limits (2025) ~$2,829/month (Medicaid-eligible); private pay option available.
Asset Limits $2,000 (individual), $3,000 (couple) for Medicaid enrollees.
NC

Available in 10+ counties (e.g., Guilford, Wake); multiple providers (e.g., PACE of the Southern Piedmont).

Benefits
Personal care (5-7 hours/day) Medical care Meals Transportation Respite Therapies

In-Home Aide Services

North Carolina In-Home Aide Services

Age 60+
General NC resident, unable to perform 1+ ADL, at risk of nursing home placement.
Income Limits (2025) No strict cap; prioritizes low-income ~$24,980/year
Asset Limits Not assessed; need-based.
NC

Family can be aides; varies by county funding.

Benefits
Personal care (5-20 hours/week) Meal prep Respite (~5 days/year) Errands

Medicare Savings Program (MSP)

North Carolina Medicare Savings Program

Age 65+ or disabled
General NC resident, Medicare Part A/B.
Income Limits (2025) ~$2,510/month (QMB), ~$3,380/month (SLMB), ~$3,598/month (QI)—individual.
Asset Limits $9,430 (individual), $14,130 (couple).
NC

Three tiers; no waitlist; includes Extra Help for Part D.

Benefits
Covers Part B premiums ($174.70/month) Deductibles ($240/year) Copays (~20%)

VA Aid and Attendance (A&A) and Housebound Benefits

North Carolina VA Aid and Attendance/Housebound

Age 65+ or disabled veteran/spouse
General NC resident, wartime service, need for ADL help (A&A) or homebound.
Income Limits (2025) Net income < ~$1,984/month (veteran with dependent, A&A); pension offsets income.
Asset Limits ~$155,356 net worth limit
NC

High veteran demand in rural/urban areas.

Benefits
Cash (~$1,433-$2,642/month veteran, ~$951-$1,318 spouse) for care costs (e.g., in-home, assisted living)

Urgent Repair Program (URP)

North Carolina Urgent Repair Program

Age 60+ prioritized
General NC resident, homeowner, low-income.
Income Limits (2025) ~$30,258/year 50% AMI, varies by county
Asset Limits Not strictly assessed; home value considered.
NC

Forgivable at $2,000/year; statewide via local partners.

Benefits
Repairs (~$8,000-$12,000 avg.) for safety (e.g., roofs, heating, accessibility)

State/County Special Assistance (SA)

North Carolina Special Assistance

Age 65+ (or disabled)
General NC resident, in licensed adult care home, low-income.
Income Limits (2025) ~$1,255/month (individual, 100% FPL); varies by facility rate.
Asset Limits $2,000 individual
NC

Covers assisted living; counties supplement state funds.

Benefits
Cash (~$1,200-$1,500/month) for room/board; Medicaid covers care services

More homes from the same operator

Frequently Asked Questions about Morningside of Concord

Is Morningside of Concord in a walkable area?

Morningside of Concord has a walk score of 29. Somewhat walkable. A few nearby services may be reachable on foot, but most trips require transportation.

What is the license number of Morningside of Concord?

According to NC state health department records, Morningside of Concord's license number is HAL-013-053.

What is the occupancy rate at Morningside of Concord?

Morningside of Concord's occupancy is 60%.

How many beds does Morningside of Concord have?

Morningside of Concord has 105 beds.

Are there photos of Morningside of Concord?

Yes — there are 5 photos of Morningside of Concord in the photo gallery on this page.

What is the address of Morningside of Concord?

Morningside of Concord is located at 500 Penny Ln Ne, Concord, NC 28025.

What is the phone number of Morningside of Concord?

(704) 795-1200 will put you in contact with the team at Morningside of Concord.

Guides for Better Senior Living

Care Cost Calculator: See Prices in Your Area

Nursing Home Data Explorer

Don’t Wait Too Long: 7 Red Flag Signs Your Parent Needs Assisted Living Now

The True Cost of Assisted Living in 2025 – And How Families Are Paying For It

Understanding Senior Living Costs: Pricing Models, Discounts & Financial Assistance