


Mostly short-term rehab stays
Most residents typically stay for a few weeks or months before returning home or moving on.
Most new residents arrive under Medicare (51% of admissions), and a typical Medicare stay runs around 1 months.
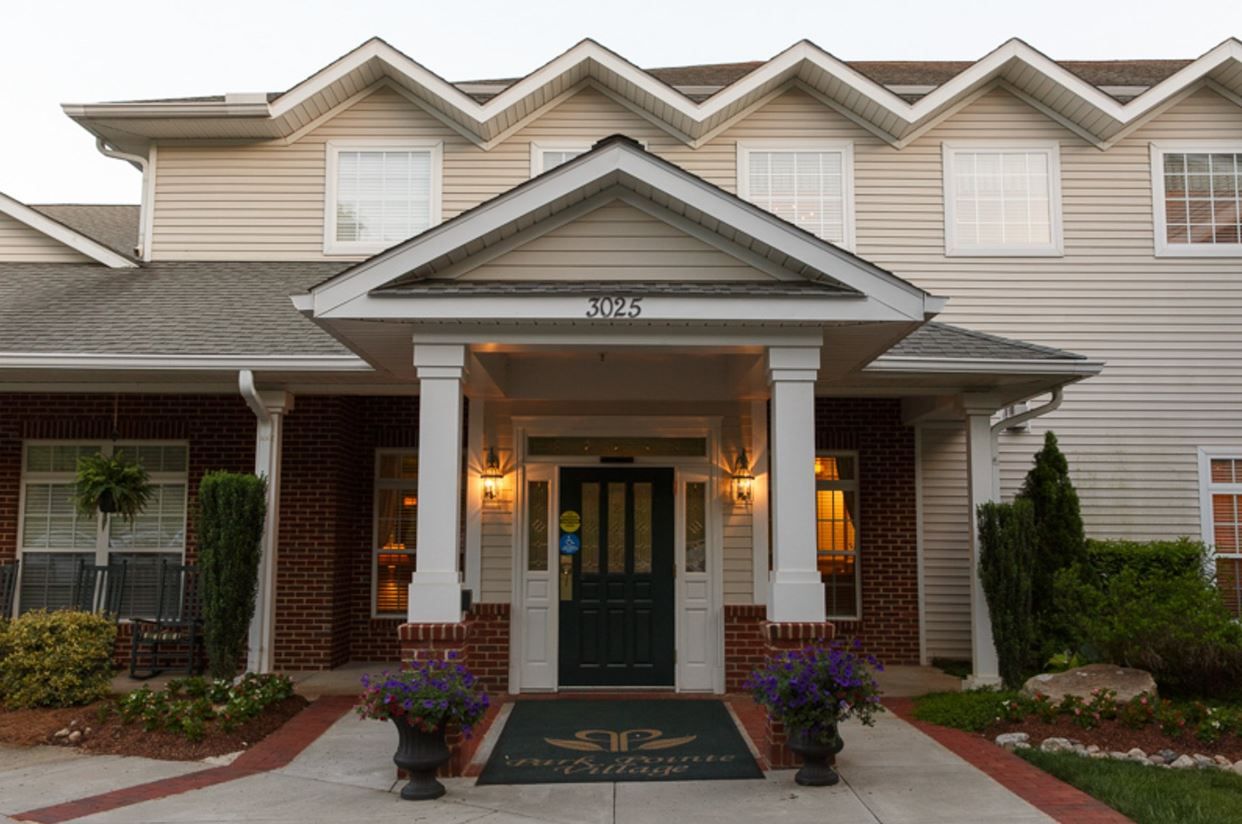
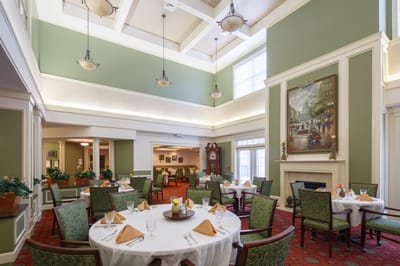
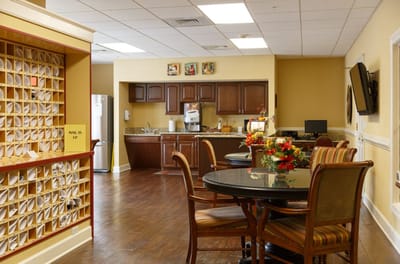
Operated by Acts Retirement-Life Communities Inc, Park Pointe Village is a nursing home in Rock Hill, South Carolina. It offers skilled nursing, assisted living, memory care, independent living, hospice, and palliative care. Marie Lunow serves as the administrator. Residents live in private suites and have cable TV and emergency call systems, with staff available around the clock.
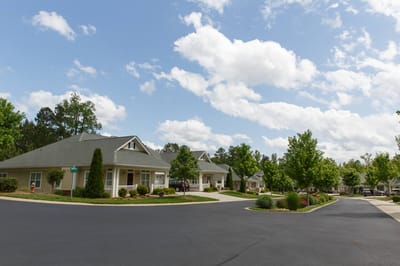
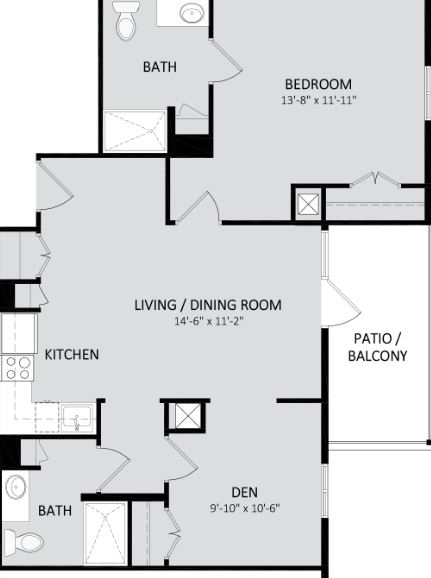
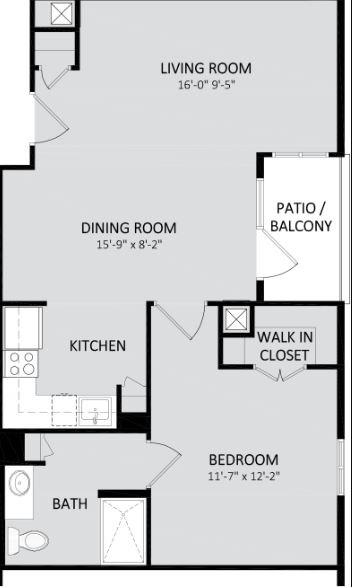
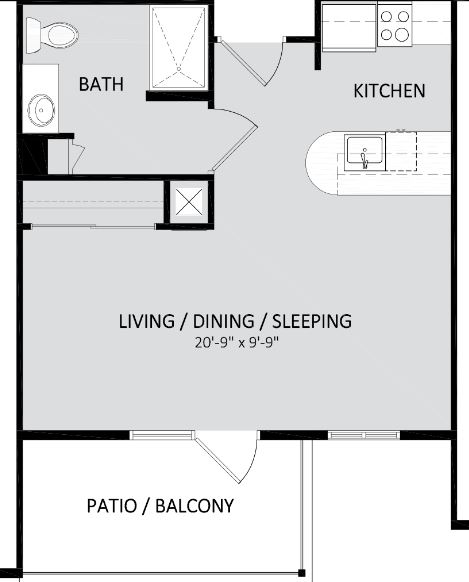
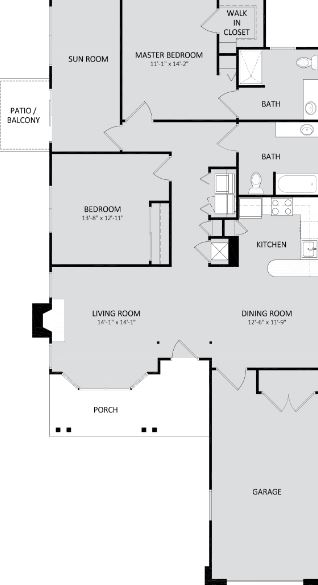
The two-story community has 20 beds and offers studio, one-bedroom, and two-bedroom floor plans. It currently has an occupancy rate of 82%. Residents stay an average of 99 days, reflecting a strong focus on short-term rehabilitation. The community accepts Medicare and private pay, giving families more than one way to cover the cost of care.
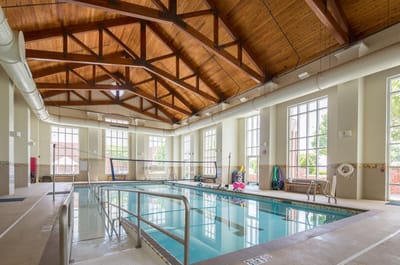
Rehabilitation services include physical, occupational, and speech therapy for residents recovering from neurological conditions, joint replacement, orthopaedic surgery, or arthritis-related mobility challenges. Residents receive an average of about 5 hours and 12 minutes of nursing care each day. This includes roughly 55 minutes provided by registered nurses.
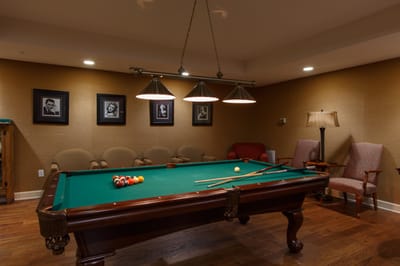
A dedicated memory care program is available for residents who need specialised support. Fitness and recreation programmes, transportation services, and a pet-friendly policy are also part of daily life. The neighbourhood has a Walk Score of 7. It’s a car-dependent area where most errands and outings require a vehicle.
| Staff type | Hours / Day / Resident | vs state avg |
|---|---|---|
|
Registered Nurse (RN)
| 55m per day | ▲ 46% State avg: 38m per day · National avg: 41m per day |
|
LPN / LVN
| 43m per day | ▼ 29% State avg: 1h 0m per day · National avg: 52m per day |
|
Nurse Aide
| 2h 18m per day | ▲ 3% State avg: 2h 13m per day · National avg: 2h 20m per day |
|
Weekend Total Nursing
| 3h 40m per day | ▲ 9% State avg: 3h 22m per day · National avg: 3h 27m per day |
|
Physical Therapist
| 24m per day | ▲ 382% State avg: 5m per day · National avg: 4m per day |
|
Weekend RN
| 36m per day | ▲ 41% State avg: 25m per day · National avg: 29m per day |
Park Pointe Village is legally operated by Acts Retirement-Life Communities Inc, and administered by Marie Lunow.
Key information about the people who lead and staff this community.
Federal penalties imposed by CMS for regulatory violations, including civil money penalties (fines) and denials of payment for new Medicare/Medicaid admissions.
Source: CMS Penalties Database
No penalties in the past 3 years
No civil money penalties or payment denials were reported in the last 3 years.
51% of new residents, usually for short-term rehab.
49% of new residents, often for short stays.
Based on CMS SNF Cost Report for fiscal year ending in 12/2023.
Pets Allowed
Housing Options: Studio / 1 Bed / 2 Bed
Building Type: Two-story
Transportation Services
Fitness and Recreation
Most residents typically stay for a few weeks or months before returning home or moving on.
Most new residents arrive under Medicare (51% of admissions), and a typical Medicare stay runs around 1 months.
Coverage residents most often arrive under.
Coverage residents most often leave under.
![]() 5.2 miles from city center
5.2 miles from city center
![]() Estimated distance in miles from Rock Hill's city center to Park Pointe Village's address, calculated via Google Maps.
Estimated distance in miles from Rock Hill's city center to Park Pointe Village's address, calculated via Google Maps.
Add your location
Info below is compiled from CMS reports & the SC Dept. of Public Health (DPH), senior community websites & trusted data sources such as Walk Score & BBB.
Communities are listed from highest to lowest based on our ranking methodology.
| Rock Hill Post Acute Care Center | NH SNF | Rock Hill | 99
Facility
99
SC AVG
90
Rank
#118 / 307 |
87.7%
Facility
87.7%
SC AVG
84.8
Rank
#63 / 94 | +3% | 3.83
Facility
3.83
SC AVG
4.00
Rank
#60 / 118 | -41% | -4% | $0
Facility
$0
SC AVG
$34.8k
Rank
#1 / 120 | 7
Facility
7
SC AVG
13.7
Rank
#29 / 119 | 2.3
Facility
2.3
SC AVG
3.4
Rank
#29 / 119 | - | 87 | - | - | Steven Powell | $10.4MFiscal year ending 12/2023
Facility
$10.4MFiscal year ending 12/2023
SC AVG
$13.0M
Rank
#78 / 121 | $6.0MFiscal year ending 12/2023
Facility
$6.0MFiscal year ending 12/2023
SC AVG
$5.4M
Rank
#73 / 121 | 58.1%Fiscal year ending 12/2023
Facility
58.1%Fiscal year ending 12/2023
SC AVG
44%
Rank
#40 / 121 | 425159 | ||||
| Westminster Towers Residential | NH AL IL SNF | Rock Hill | 57
Facility
57
SC AVG
90
Rank
#228 / 307 | - | - | 4.94
Facility
4.94
SC AVG
4.00
Rank
#18 / 118 | +50% | +24% | $17.0k
Facility
$17.0k
SC AVG
$34.8k
Rank
#94 / 120 | 8
Facility
8
SC AVG
13.7
Rank
#35 / 119 | 2.7
Facility
2.7
SC AVG
3.4
Rank
#39 / 119 | 2 | 6 | - | - | Kevin Johnson | $11.2MFiscal year ending 12/2023
Facility
$11.2MFiscal year ending 12/2023
SC AVG
$13.0M
Rank
#50 / 121 | $5.3MFiscal year ending 12/2023
Facility
$5.3MFiscal year ending 12/2023
SC AVG
$5.4M
Rank
#82 / 121 | 47.2%Fiscal year ending 12/2023
Facility
47.2%Fiscal year ending 12/2023
SC AVG
44%
Rank
#107 / 121 | 425291 | ||||
| White Oak Manor Rock Hill | NH SNF | Rock Hill | 141
Facility
141
SC AVG
90
Rank
#32 / 307 |
99.0%
Facility
99.0%
SC AVG
84.8
Rank
#3 / 94 | +17% | 4.38
Facility
4.38
SC AVG
4.00
Rank
#31 / 118 | -29% | +10% | $7.4k
Facility
$7.4k
SC AVG
$34.8k
Rank
#64 / 120 | 20
Facility
20
SC AVG
13.7
Rank
#100 / 119 | 4.0
Facility
4.0
SC AVG
3.4
Rank
#83 / 119 | 1 | 135 | A+ | - | Jerrolyn Montgomery-Smalls | $15.0MFiscal year ending 09/2023
Facility
$15.0MFiscal year ending 09/2023
SC AVG
$13.0M
Rank
#48 / 121 | $10.0MFiscal year ending 09/2023
Facility
$10.0MFiscal year ending 09/2023
SC AVG
$5.4M
Rank
#17 / 121 | 66.9%Fiscal year ending 09/2023
Facility
66.9%Fiscal year ending 09/2023
SC AVG
44%
Rank
#24 / 121 | 425088 | ||||
| Pruitthealth Rock Hill | NH SNF | Rock Hill | 132
Facility
132
SC AVG
90
Rank
#37 / 307 |
78.3%
Facility
78.3%
SC AVG
84.8
Rank
#77 / 94 | -8% | 3.74
Facility
3.74
SC AVG
4.00
Rank
#71 / 118 | +123% | -6% | $0
Facility
$0
SC AVG
$34.8k
Rank
#1 / 120 | 14
Facility
14
SC AVG
13.7
Rank
#73 / 119 | 3.5
Facility
3.5
SC AVG
3.4
Rank
#68 / 119 | 1 | 103 | - | - | Pruitthealth Rock Hill LLC | $8.1MFiscal year ending 06/2024
Facility
$8.1MFiscal year ending 06/2024
SC AVG
$13.0M
Rank
#86 / 121 | $5.4MFiscal year ending 06/2024
Facility
$5.4MFiscal year ending 06/2024
SC AVG
$5.4M
Rank
#86 / 121 | 67%Fiscal year ending 06/2024
Facility
67%Fiscal year ending 06/2024
SC AVG
44%
Rank
#57 / 121 | 425127 |
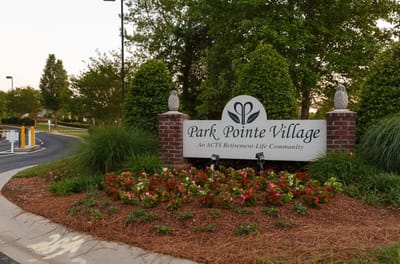
Park Pointe Village is located in Rock Hill, South Carolina.
Here are the financial assistance programs available to residents in South Carolina.
Park Pointe Village is legally operated by Acts Retirement-Life Communities Inc, and administered by Marie Lunow.
Park Pointe Village has a walk score of 7. Car-dependent. Most errands require a car, with limited nearby walkable options.
According to SC state health department records, Park Pointe Village's license number is CRC-2030.
According to SC state health department records, Park Pointe Village's license expires on September 30, 2026.
Park Pointe Village's occupancy is 82.1%.
Yes, Park Pointe Village allows residents to bring their pets.
The team at Park Pointe Village can be reached at M.LUNOW@ACTSLIFE.ORG.
Care Cost Calculator: See Prices in Your Area
Nursing Home Data Explorer
Don’t Wait Too Long: 7 Red Flag Signs Your Parent Needs Assisted Living Now
The True Cost of Assisted Living in 2025 – And How Families Are Paying For It
Understanding Senior Living Costs: Pricing Models, Discounts & Financial Assistance
