Riverdale Health Care Center
CMS overall rating Info CMS (the Centers for Medicare & Medicaid Services) is the federal agency that rates nursing home quality. Its Overall Rating runs from 1 to 5 stars, combining health inspections, staffing, and quality measures, with inspections weighted most heavily.

Riverdale Health Care Center

CMS overall rating Info CMS (the Centers for Medicare & Medicaid Services) is the federal agency that rates nursing home quality. Its Overall Rating runs from 1 to 5 stars, combining health inspections, staffing, and quality measures, with inspections weighted most heavily.
Calculator: See prices in your area
Riverdale Health Care Center accepts Medicare, Medicaid, and private pay.

Overview of Riverdale Health Care Center

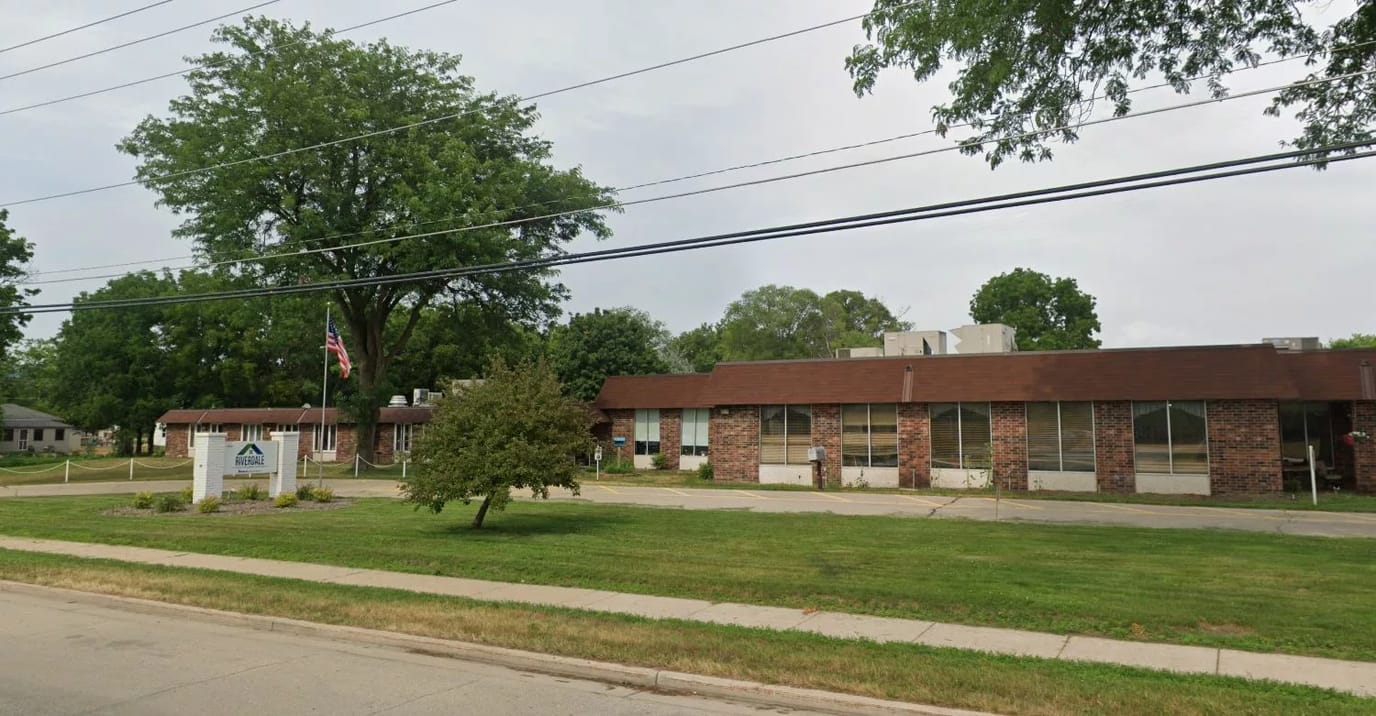
Riverdale Health Care Center operates 58 beds at 1000 N Wisconsin Ave in Muscoda, Grant County, Wisconsin, under the ownership of Bedrock Hcs At Riverdale LLC. Most residents stay extended periods in this long-term care-focused facility, which serves Medicare, Medicaid, and private-pay populations with an average census stay of 103 days.

The facility received a 1-star CMS overall rating, with health inspection, staffing, and quality measures each rated at 1 star. Health inspection findings place it 64.3% below Wisconsin benchmarks.

Between July 2024 and July 2025, regulators imposed four payment denials; serious federal enforcement action that suspended new Medicare and Medicaid admissions for cumulative periods totaling 73 days. Four additional civil money penalties totaling $179,000 accompany these denials, substantially exceeding the Wisconsin average of $95,000 in fines.

Nursing hours stand at 3 hours 8 minutes per resident per day, falling 27% short of Wisconsin’s 4 hours 17 minutes average and ranking the facility 153rd among 172 state nursing homes. The staff-to-resident ratio of 1.49:1 runs 40% below the state standard of 2.48:1. Weekend staffing drops further to 2 hours 37 minutes per day, 30% below the state’s already-limited weekend baseline.

Emergency department visits are an indicator of preventable or manageable conditions being sent out of the facility and they occur at 5.84 per 1,000 resident days, exceeding the Wisconsin average more than threefold. Unintended weight loss appears in 14.5% of long-stay residents, triple the state average. Pressure ulcers affect 9.7% of high-risk residents, double the benchmark. Hospitalization rates run 32% above state averages.

The facility lost $502,100 in 2023 on $5.6 million in revenue. Occupancy declined from 78.9% in 2022 to 67.3% in 2023. Despite substantial payroll investment at 65% of revenue, quality outcomes across multiple domains remain below state performance standards.

Riverdale’s regulatory history, staffing constraints, and clinical quality measures point to substantial risks for prospective residents and families, particularly those requiring long-term skilled care.

Quality ratings

Measured by Centers for Medicare & Medicaid Services (CMS)

Overall rating Info The Overall CMS Rating combines results from health inspections, staffing levels and quality measures. Health inspections carry the most weight. Staffing and quality scores can increase or decrease the final rating based on performance compared to state and national standards.
Health Inspection Info Based on the results of the facility's three most recent standard inspections and any complaint investigations. CMS reviews the number, scope, and severity of deficiencies, with more recent findings weighted more heavily.
Staffing Info Measures average nursing staff hours per resident per day, including Registered Nurses (RNs) and total nursing staff. Ratings are adjusted based on the level of care residents require and are compared to state and national benchmarks.
Quality Measures Info Based on clinical and physical health indicators reported to CMS, such as hospital readmissions, falls, pressure ulcers, and improvements in mobility. These measures reflect how well residents' health needs are being managed.

Staffing hours breakdown

Info Daily nursing hours per resident by staff type, reported to CMS. Higher is generally better — compare this facility to state and national averages to see where staffing stands.

Hours per resident per day — compared to state averages

Total nursing care / resident Info Total adjusted nursing hours per resident per day, combining RN, LPN, and aide time. CMS adjusts this for case-mix so facilities can be fairly compared.
3h 8m per day
Rank #159 / 178Nurse hours — State benchmarkedThis home is ranked 159th out of 178 homes in Wisconsin. Shows adjusted nurse hours per resident per day benchmarked to the Wisconsin average, with a ranking across 178 Wisconsin facilities. More hours mean more direct care. The national average is about 3.5 hrs; below 3.0 is a red flag.Rankings are based only on facilities in Wisconsin that report data for that category. Facilities without available data are excluded from the ranking.Click the rank badge to see the full State ranking.Click here to see the full State ranking.
vs avg

5 of 6 metrics below state avg

Standout metric Weekend RN is +30% above state avg
Staff typeHours / Day / Residentvs state avg
Registered Nurse (RN) Info RNs hold the highest nursing license and can assess residents, interpret test results, and direct care plans. More RN hours per day often signals stronger clinical oversight and faster response to health changes. 50m per day ▼ 13% State avg: 58m per day · National avg: 41m per day
LPN / LVN Info Licensed Practical Nurses (LPNs) or Licensed Vocational Nurses (LVNs) deliver routine hands-on care — medication administration, wound dressing, and monitoring vital signs. They work under RN supervision and make up a large share of daily bedside care. 30m per day ▼ 20% State avg: 38m per day · National avg: 52m per day
Nurse Aide Info Certified Nurse Aides (CNAs) provide the most direct day-to-day assistance: bathing, dressing, feeding, and mobility. Nurse aide hours are typically the largest staffing category and directly affect residents' quality of life. 2h 15m per day ▼ 13% State avg: 2h 35m per day · National avg: 2h 21m per day
Weekend Total Nursing Info Combined nursing hours (RN + LPN + Nurse Aide) per resident per day on weekends. Staffing often drops on weekends — this figure reveals whether the facility maintains adequate coverage outside of weekday hours. 3h 14m per day ▼ 13% State avg: 3h 43m per day · National avg: 3h 26m per day
Physical Therapist Info Hours per resident per day provided by licensed Physical Therapists (PTs) or PT Assistants. PT services help residents recover mobility after injury or illness and are especially important for post-acute (short-stay) rehabilitation. 0m per day ▼ 100% State avg: 4m per day · National avg: 4m per day
Weekend RN Info Registered nurse hours specifically on weekends. Facilities sometimes reduce RN presence on Saturdays and Sundays — a low weekend RN figure compared to weekday hours can indicate reduced clinical oversight when most administrative staff are absent. 51m per day ▲ 30% State avg: 39m per day · National avg: 29m per day

Capacity and availability

This home usually has availability

Lower occupancy than the state average
Occupancy rate
67.3% Rank #278 / 434Occupancy rate — State benchmarkedThis home is ranked 278th out of 434 homes in Wisconsin. Shows this facility's occupancy rate versus the Wisconsin average, with its Statewide rank out of 434. Higher occupancy signals strong local demand and financial stability.Rankings are based only on facilities in Wisconsin that report data for that category. Facilities without available data are excluded from the ranking.Click the rank badge to see the full State ranking.Click here to see the full State ranking.
Avg. Length of Stay
103 days
Bed community size
58-bed community Rank #204 / 496Bed count — State benchmarkedThis home is ranked 204th out of 496 homes in Wisconsin. Shows this facility's certified or reported bed count compared to other Wisconsin facilities. Larger communities may offer more amenities, programs, and on-site services for residents and families.Rankings are based only on facilities in Wisconsin that report data for that category. Facilities without available data are excluded from the ranking.Click the rank badge to see the full State ranking.Click here to see the full State ranking.
A moderately sized community that may balance personal attention with shared amenities and social activities.
Walk Score
Walk Score: 37 / 100 Rank #325 / 580Walk Score — State benchmarkedThis home is ranked 325th out of 580 homes in Wisconsin. Shows how walkable this facility's neighborhood is compared to the average Walk Score across Wisconsin facilities. Higher scores benefit residents, families, and staff.Rankings are based only on facilities in Wisconsin that report data for that category. Facilities without available data are excluded from the ranking.Click the rank badge to see the full State ranking.Click here to see the full State ranking.
Somewhat walkable. A few nearby services may be reachable on foot, but most trips require transportation.

Contact Riverdale Health Care Center

Staffing Data

Reporting period: October 1 – December 31, 2025 (Q4 2025). Source: CMS Payroll-Based Journal report.

Total staff 58
Employees 40
Contractors 18
Staff to resident ratio 1.49 : 1
0% compared with State average

State average ratio: 0 : 0

Avg staff/day 18
Average shift 8.5 hours
0% compared with State average

State average: 0 hours

Total staff hours (quarter) 13,993

Nursing staff breakdown

Q4 2025 · Oct 1 – Dec 31 More info This data comes from the CMS Payroll-Based Journal report covering October 1 – December 31, 2025.
Registered Nurse

Manages medical care and health needs.

RN Staff Info 12 total: 9 full-time employees and 3 contractors. 12
Average shift length Info Average shift length. Calculated as total hours divided by days worked and average staff per day. 10.6 hours
Licensed Practical Nurse

Assists with medical care and medications.

LPN Staff Info All 4 LPN Staff are full-time employees. No contractors work on this role. 4
Average shift length Info Average shift length. Calculated as total hours divided by days worked and average staff per day. 10.3 hours
Certified Nursing Assistant

Helps with daily care and mobility.

CNA Staff Info 31 total: 19 full-time employees and 12 contractors. 31
Average shift length Info Average shift length. Calculated as total hours divided by days worked and average staff per day. 7.7 hours

Contractor staffing

Q4 2025 · Oct 1 – Dec 31 More info This data comes from the CMS Payroll-Based Journal report covering October 1 – December 31, 2025.

Total hours from contractors

4.1%

575 contractor hours this quarter

Certified Nursing Assistant: 12 Registered Nurse: 3 Occupational Therapy Assistant: 1 Occupational Therapy Aide: 1 Medical Director: 1

Staff by category

Q4 2025 · Oct 1 – Dec 31 More info This data comes from the CMS Payroll-Based Journal report covering October 1 – December 31, 2025.
Certified Nursing Assistant1912316,61892100%7.7
Registered Nurse93122,2388997%10.6
Licensed Practical Nurse4041,7258188%10.3
Medication Aide/Technician3031,0307683%8.4
Nurse Practitioner1015306672%8
Administrator1015126470%8
Mental Health Service Worker1014926368%7.8
Other Dietary Services Staff1014525661%8.1
Medical Director0112002022%10
Occupational Therapy Aide0111021314%7.8
Clinical Nurse Specialist101793841%2.1
Occupational Therapy Assistant0111567%2.5
31 Certified Nursing Assistant
% of Days 100%
12 Registered Nurse
% of Days 97%
4 Licensed Practical Nurse
% of Days 88%
3 Medication Aide/Technician
% of Days 83%
1 Nurse Practitioner
% of Days 72%
1 Administrator
% of Days 70%
1 Mental Health Service Worker
% of Days 68%
1 Other Dietary Services Staff
% of Days 61%
1 Medical Director
% of Days 22%
1 Occupational Therapy Aide
% of Days 14%
1 Clinical Nurse Specialist
% of Days 41%
1 Occupational Therapy Assistant
% of Days 7%

Penalties and fines

Includes penalties issued in 2024-2025

Federal penalties imposed by CMS for regulatory violations, including civil money penalties (fines) and denials of payment for new Medicare/Medicaid admissions.

Source: CMS Penalties Database (Data as of Jan 2026)

Total fines amount $179K Rank #155 / 180Federal fines — State benchmarkedThis home is ranked 155th out of 180 homes in Wisconsin. Shows this facility's cumulative CMS federal fine dollars versus the Wisconsin average among facilities with fines, and where it ranks among 180 facilities in the pool. Lower total dollars mean a better rank.Rankings are based only on facilities in Wisconsin that report data for that category. Facilities without available data are excluded from the ranking.Click the rank badge to see the full State ranking.Click here to see the full State ranking.
87% higher than State average

State average: $95K

Number of fines 4
94% more fines than State average

State average: 2.1

Payment Denials Info Serious action where Medicare and/or Medicaid temporarily stops payments for new residents until issues are fixed. 4
504% more payment denials than State average

State average: 0.7

Fines amount comparison
This facility $179K
State average $95K
Penalty History

Penalties are imposed by CMS for violations of federal nursing home regulations.

5 penalties in the past 3 years

Multiple penalties were reported in the last 3 years.

Payment Denial Info Serious action where Medicare and/or Medicaid temporarily stops payments for new residents until issues are fixed. Jul 9, 2025
44 days
Payment Denial Info Serious action where Medicare and/or Medicaid temporarily stops payments for new residents until issues are fixed. Mar 27, 2025
3 days
Civil Money Penalty Info Fines imposed for noncompliance, which can be assessed per day or per instance of violation. Dec 16, 2024
$26K
Civil Money Penalty Info Fines imposed for noncompliance, which can be assessed per day or per instance of violation. Jul 10, 2024
$97K

Last updated: Jan 2026

Quality of care over time

These measures show how residents usually do over time at this home, based on health outcomes and preventive care.

High-risk clinical events score Info A composite score based on pressure ulcers, falls with injury, weight loss, walking ability decline, and activities of daily living decline. 14.8
42% worse than State average

State average: 10.5

Functional decline score Info A composite score based on activities of daily living decline, walking ability decline, and incontinence. 26.4
19% worse than State average

State average: 22.1

Long-stay resident measures
Below average State avg: 3.0 Info CMS star rating based on long-stay quality measure performance. 5 stars = significantly above average, 1 star = significantly below average.
Need for Help with Daily Activities Increased Info Percent of long-stay residents whose need for help with daily activities has increased 18.5%
5% worse than State average

State average: 17.6%

Walking Ability Worsened Info Percent of long-stay residents whose ability to move independently worsened 30.3%
33% worse than State average

State average: 22.8%

Low Risk Residents with Bowel/Bladder Incontinence Info Percent of low risk long-stay residents who lose control of their bowels or bladder 30.3%
16% worse than State average

State average: 26.0%

Falls with Major Injury Info Percent of long-stay residents experiencing one or more falls with major injury 1.2%
63% better than State average

State average: 3.2%

High Risk Residents with Pressure Ulcers Info Percent of long-stay high risk residents with pressure ulcers 9.7%
78% worse than State average

State average: 5.4%

Urinary Tract Infection Info Percent of long-stay residents with a urinary tract infection 1.3%
61% better than State average

State average: 3.2%

Lost Too Much Weight Info Percent of long-stay residents who lose too much weight 14.5%
197% worse than State average

State average: 4.9%

Depressive Symptoms Info Percent of long-stay residents who have depressive symptoms 6.3%
26% worse than State average

State average: 5.0%

Antipsychotic Use Info Percent of long-stay residents who received an antipsychotic medication 14.0%
13% better than State average

State average: 16.1%

Pneumococcal Vaccine Info Percent of long-stay residents assessed and appropriately given the pneumococcal vaccine 87.0%
9% worse than State average

State average: 95.9%

Influenza Vaccine Info Percent of long-stay residents assessed and appropriately given the seasonal influenza vaccine 83.3%
12% worse than State average

State average: 95.0%

Hospitalizations per 1,000 days Info Number of hospitalizations per 1,000 long-stay resident days. 2.13
32% worse than State average

State average: 1.61

ED visits per 1,000 days Info Number of outpatient emergency department visits per 1,000 long-stay resident days. 5.84
167% worse than State average

State average: 2.19

Short-stay resident measures
Below average State avg: 2.9 Info CMS star rating based on short-stay quality measure performance. 5 stars = much above average, 1 star = much below average.
Pneumococcal Vaccine Info Percent of short-stay residents assessed and appropriately given the pneumococcal vaccine 73.8%
15% worse than State average

State average: 87.3%

Antipsychotic medication increase Info Percent of short-stay residents who newly received an antipsychotic medication 0.0%
100% better than State average

State average: 1.2%

Re-hospitalized after SNF stay Info Percentage of short-stay residents who were re-hospitalized after their nursing home admission. 19.5%
14% better than State average

State average: 22.7%

Emergency department visits Info Percentage of short-stay residents who had an outpatient emergency department visit. 22.6%
51% worse than State average

State average: 15.0%

Falls with major injury Info Percentage of SNF residents who experience falls with major injury during their stay. 0.0%
100% better than State average

State average: 0.8%

Successful return to home or community Info Rate of successful return to home or community from a skilled nursing facility. 36.6%
28% worse than State average

State average: 50.6%

Breakdown by payment type

Medicare

16% of new residents, usually for short-term rehab.

Typical stay 2 - 3 months

Private pay

39% of new residents, often for short stays.

Typical stay 1 - 2 months

Medicaid

45% of new residents, often for long-term daily care.

Typical stay 5 - 6 months

Facility Characteristics

Source: CMS Long-Term Care Facility Characteristics (Data as of Jan 2026)

Total residents 39
Medicare
2
5.1% of residents
Medicaid
32
82.1% of residents
Private pay or other
5
12.8% of residents
Programs & Services
Residents Group

Residents meet regularly to discuss policies, care quality, and activities

Active Resident Council

Organized group of residents that meets regularly to discuss facility policies, quality of life, and activities.

Finances and operations

Based on CMS SNF Cost Report for fiscal year ending in 12/2023.

For-profit
Corporation
Net patient revenue Info Net patient revenue — what the home actually collects for resident care, after contractual allowances, bad debt and discounts are subtracted from its gross charges (CMS cost report, Worksheet G-3). It covers resident care only; money the home earns from other sources is shown separately as "Other income."
$5.3M
Net patient income Info Net patient income: net patient revenue minus the home's total operating expenses. A positive figure means it earns more from resident care than it spends to deliver it; a negative figure means the opposite. It excludes non-operating "other income."
-$502.1K
For-profit Corporation
Net patient revenue Info Net patient revenue — what the home actually collects for resident care, after contractual allowances, bad debt and discounts are subtracted from its gross charges (CMS cost report, Worksheet G-3). It covers resident care only; money the home earns from other sources is shown separately as "Other income."
$5.3M Rank #147 / 183Revenue — State benchmarkedThis home is ranked 147th out of 183 homes in Wisconsin. Shows this facility's annual revenue compared to the Wisconsin average. Higher revenue generally means more resources for staffing and capital — read alongside Payroll %.Rankings are based only on facilities in Wisconsin that report data for that category. Facilities without available data are excluded from the ranking.Click the rank badge to see the full State ranking.Click here to see the full State ranking.
Net patient income Info Net patient income: net patient revenue minus the home's total operating expenses. A positive figure means it earns more from resident care than it spends to deliver it; a negative figure means the opposite. It excludes non-operating "other income."
-$502.1K
Other income Info Money the home earns outside of resident care — such as investments, grants, rentals and other non-operating sources (CMS cost report, Worksheet G-3). It is tracked separately from net patient revenue: it is not part of that figure, and it is not included in net patient income.
$54
Payroll costs Info Staff salaries plus wage-related costs — benefits such as payroll taxes, health insurance and retirement — from the home's own accounting records (CMS cost report, Worksheet A). Contract or agency labor is counted separately, under other operating costs. Rank #137 / 183Payroll — State benchmarkedThis home is ranked 137th out of 183 homes in Wisconsin. Shows total annual staff payroll benchmarked to the Wisconsin average. Higher payroll investment relative to peers often signals better staffing and less reliance on cheaper contract labor.Rankings are based only on facilities in Wisconsin that report data for that category. Facilities without available data are excluded from the ranking.Click the rank badge to see the full State ranking.Click here to see the full State ranking.
$2.0M 37% of net patient revenue Info Payroll as a share of revenue: staff salaries and wage-related benefits divided by net patient revenue. A higher figure means more of each revenue dollar goes to staff pay. Rank #44 / 183Payroll % — State benchmarkedThis home is ranked 44th out of 183 homes in Wisconsin. Shows payroll as a percentage of revenue versus the Wisconsin average. Well-run Wisconsin facilities typically land around 62–74% — the top third Statewide. Below 25% may signal understaffing or heavy agency use — read with Staffing ratings.Rankings are based only on facilities in Wisconsin that report data for that category. Facilities without available data are excluded from the ranking.Click the rank badge to see the full State ranking.Click here to see the full State ranking.
Other operating costs Info Everything it costs to run the home apart from payroll — food, utilities, supplies, maintenance, contract labor and administration. Calculated as total operating expense minus payroll (staff salaries and wage-related benefits).
$3.9M
Total costs Info The home's total operating expense for the year — all the costs of running it, salaries included (CMS cost report, Worksheet G-3).
$5.8M

Who this home usually serves

TYPE OF STAY

Mostly long-term care residents

Most residents stay for extended periods and receive ongoing daily care.

New residents most often arrive under Medicaid (45% of admissions), and a typical Medicaid stay runs around 5 - 6 months.

Admissions
128 total

Coverage residents most often arrive under.

Medicare 16%
Private pay 39%
Medicaid 45%
Discharges
138 total

Coverage residents most often leave under.

Medicare 28%
Private pay 48%
Medicaid 24%

Places of interest near Riverdale Health Care Center

Address 0.7 miles from city center Info Estimated distance in miles from Muscoda's city center to Riverdale Health Care Center's address, calculated via Google Maps. — 10.37 miles to nearest hospital (Richland Hospital)

Calculate Travel Distance to Riverdale Health Care Center

Add your location

Address

Compare Nursing Homes around the area

The information below is reported by the Wisconsin Department of Health Services, Division of Quality Assurance.

Riverdale Health Care Center
NH
Muscoda -58 - 37 -
Oak Park Nursing & Rehab Center
NH
AL
IL
MC
Madison (North Star) -100 A+ 5 1 Bed / 2 Bed
Sun Prairie Senior Living
NH
ADC
AL
Sun Prairie -42 A+ 74 Studio / 1 Bed / 2 Bed
Ascension Living Alexian Village – Milwaukee
NH
Milwaukee (Northridge) -108 A+ 24 1 Bed / 2 Bed / 3 Bed
Harbor Haven Health & Rehabilitation
NH
HC
MC
PC
Fond Du Lac -85 - 57 Private / Semi-Private Rooms

Frequently Asked Questions about Riverdale Health Care Center

What neighborhood is Riverdale Health Care Center in?

Riverdale Health Care Center is in the Muscoda neighborhood.

Is Riverdale Health Care Center in a walkable area?

Riverdale Health Care Center has a walk score of 37. Somewhat walkable. A few nearby services may be reachable on foot, but most trips require transportation.

What is the occupancy rate at Riverdale Health Care Center?

Riverdale Health Care Center's occupancy is 67.3%.

Does Riverdale Health Care Center operate as a for-profit or non-profit?

Riverdale Health Care Center is registered as a for-profit.

Are there photos of Riverdale Health Care Center?

Yes — there are 4 photos of Riverdale Health Care Center in the photo gallery on this page.

What is the address of Riverdale Health Care Center?

Riverdale Health Care Center is located at 1000 N Wisconsin Ave, Muscoda, WI 53573.

What is the phone number of Riverdale Health Care Center?

(608) 739-3186 will put you in contact with the team at Riverdale Health Care Center.

Guides for Better Senior Living

Care Cost Calculator: See Prices in Your Area

Nursing Home Data Explorer

Don’t Wait Too Long: 7 Red Flag Signs Your Parent Needs Assisted Living Now

The True Cost of Assisted Living in 2025 – And How Families Are Paying For It

Understanding Senior Living Costs: Pricing Models, Discounts & Financial Assistance