Sandstone Millcreek
CMS overall rating Info CMS (the Centers for Medicare & Medicaid Services) is the federal agency that rates nursing home quality. Its Overall Rating runs from 1 to 5 stars, combining health inspections, staffing, and quality measures, with inspections weighted most heavily.

Sandstone Millcreek

CMS overall rating Info CMS (the Centers for Medicare & Medicaid Services) is the federal agency that rates nursing home quality. Its Overall Rating runs from 1 to 5 stars, combining health inspections, staffing, and quality measures, with inspections weighted most heavily.
Calculator: See prices in your area
Sandstone Millcreek accepts Medicare, Medicaid, and private pay.

Overview of Sandstone Millcreek

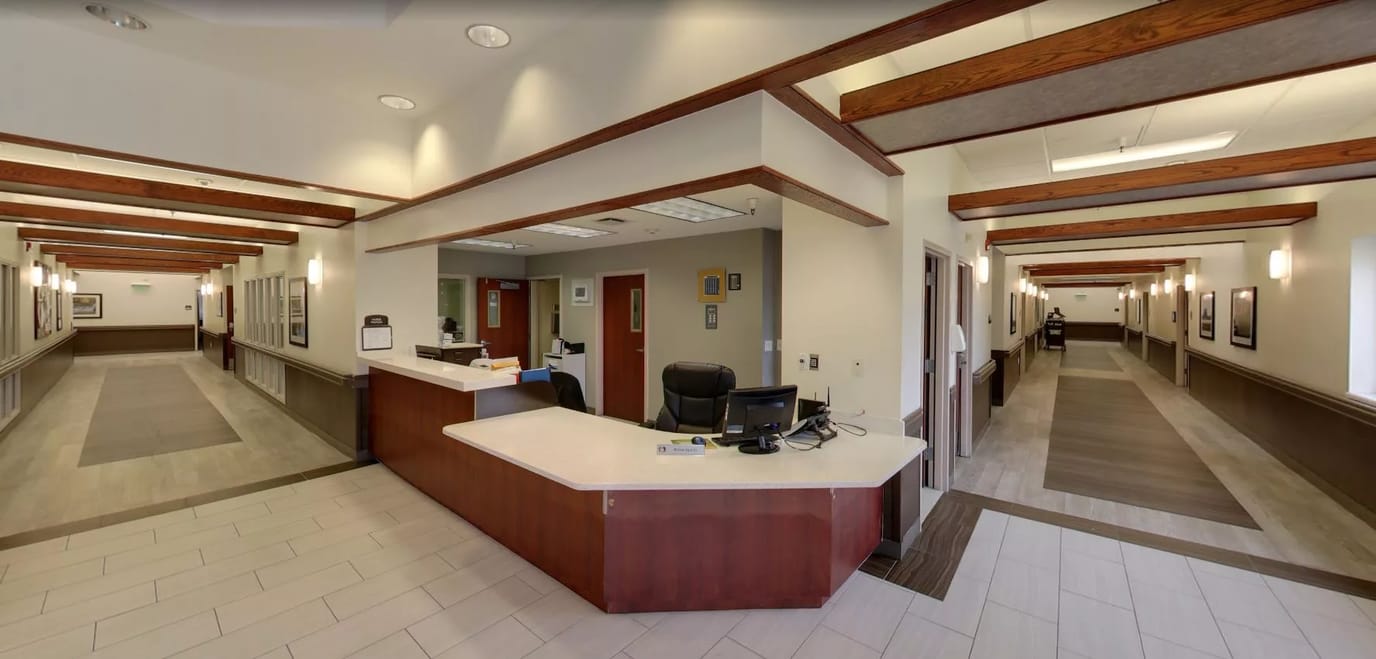
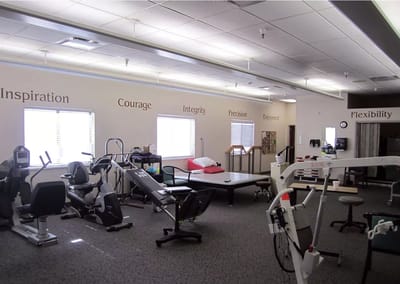
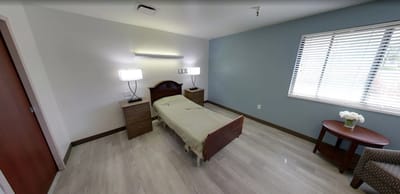
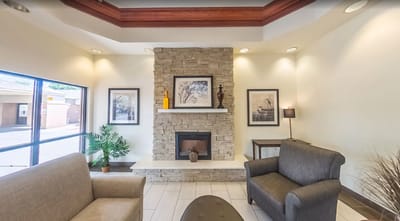
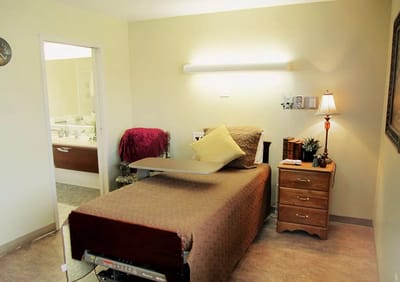
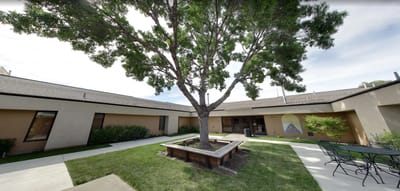
Located in the vibrant city of Salt Lake City, Utah, Sandstone Millcreek is a distinguished senior community offering expert short-term rehabilitation, skilled nursing, assisted living, and long-term living facilities, extending its services across Arizona and Nevada. Nestled in the picturesque landscape of Salt Lake City, Utah, the facility’s skilled nursing services encompass post-acute rehabilitation, long-term care, and a range of therapies, including physical, occupational, and speech therapy. Dedicated to ensuring the safety and well-being of both residents and staff, Sandstone Millcreek offers a comforting environment focused on short-term rehabilitation, physical therapy, and skilled nursing services.
Sandstone Millcreek boasts a dedicated team comprising certified nursing assistants, registered nurses, licensed practical nurses, and medication aides committed to delivering residents exceptional care. For seniors seeking a comfortable and secure place to call home in Salt Lake City, Sandstone Millcreek is an excellent option. The facility’s primary goal remains centered on providing nothing short of stellar skilled nursing care and comprehensive rehabilitation, empowering residents to reclaim their cherished activities.

Quality ratings

Measured by Centers for Medicare & Medicaid Services (CMS)

Overall rating Info The Overall CMS Rating combines results from health inspections, staffing levels and quality measures. Health inspections carry the most weight. Staffing and quality scores can increase or decrease the final rating based on performance compared to state and national standards.
▼ 40.3% Below UT avg. ▼ 40.3% Below UT avg.UT average: 3.4Click the badge to see the full State ranking.Click here to see the full State ranking.
Health Inspection Info Based on the results of the facility's three most recent standard inspections and any complaint investigations. CMS reviews the number, scope, and severity of deficiencies, with more recent findings weighted more heavily.
▼ 64.1% Below UT avg. ▼ 64.1% Below UT avg.UT average: 2.8Click the badge to see the full State ranking.Click here to see the full State ranking.
Staffing Info Measures average nursing staff hours per resident per day, including Registered Nurses (RNs) and total nursing staff. Ratings are adjusted based on the level of care residents require and are compared to state and national benchmarks.
▼ 2.7% Below UT avg. ▼ 2.7% Below UT avg.UT average: 3.1Click the badge to see the full State ranking.Click here to see the full State ranking.
Quality Measures Info Based on clinical and physical health indicators reported to CMS, such as hospital readmissions, falls, pressure ulcers, and improvements in mobility. These measures reflect how well residents' health needs are being managed.
▲ 14.9% Above UT avg. ▲ 14.9% Above UT avg.UT average: 4.4Click the badge to see the full State ranking.Click here to see the full State ranking.

Staffing hours breakdown

Info Daily nursing hours per resident by staff type, reported to CMS. Higher is generally better — compare this facility to state and national averages to see where staffing stands.

Hours per resident per day — compared to Utah state averages

Total nursing care / resident Info This home is ranked 37th out of 80 homes in Utah for nurse hours. Total adjusted nursing hours per resident per day, combining RN, LPN, and aide time. CMS adjusts this for case-mix so facilities can be fairly compared.
3h 28m per day
Rank #37 / 80Nurse hours — State benchmarkedThis home is ranked 37th out of 80 homes in Utah. Shows adjusted nurse hours per resident per day benchmarked to the Utah average, with a ranking across 80 Utah facilities. More hours mean more direct care. The national average is about 3.5 hrs; below 3.0 is a red flag.Rankings are based only on facilities in Utah that report data for that category. Facilities without available data are excluded from the ranking.Click the rank badge to see the full State ranking.Click here to see the full State ranking.
This facility Utah avg (3h 43m per day)
vs Utah avg
-7%

4 of 6 metrics below state avg

Standout metric LPN / LVN is +9% above state avg
Staff typeHours / Day / Residentvs state avg
Registered Nurse (RN) Info RNs hold the highest nursing license and can assess residents, interpret test results, and direct care plans. More RN hours per day often signals stronger clinical oversight and faster response to health changes. 1h 8m per day ▼ 4% State avg: 1h 11m per day · National avg: 41m per day
LPN / LVN Info Licensed Practical Nurses (LPNs) or Licensed Vocational Nurses (LVNs) deliver routine hands-on care — medication administration, wound dressing, and monitoring vital signs. They work under RN supervision and make up a large share of daily bedside care. 33m per day ▲ 9% State avg: 30m per day · National avg: 52m per day
Nurse Aide Info Certified Nurse Aides (CNAs) provide the most direct day-to-day assistance: bathing, dressing, feeding, and mobility. Nurse aide hours are typically the largest staffing category and directly affect residents' quality of life. 2h 16m per day ▼ 4% State avg: 2h 22m per day · National avg: 2h 21m per day
Weekend Total Nursing Info Combined nursing hours (RN + LPN + Nurse Aide) per resident per day on weekends. Staffing often drops on weekends — this figure reveals whether the facility maintains adequate coverage outside of weekday hours. 3h 28m per day ■ Avg State avg: 3h 31m per day · National avg: 3h 26m per day
Physical Therapist Info Hours per resident per day provided by licensed Physical Therapists (PTs) or PT Assistants. PT services help residents recover mobility after injury or illness and are especially important for post-acute (short-stay) rehabilitation. 1m per day ▼ 81% State avg: 7m per day · National avg: 4m per day
Weekend RN Info Registered nurse hours specifically on weekends. Facilities sometimes reduce RN presence on Saturdays and Sundays — a low weekend RN figure compared to weekday hours can indicate reduced clinical oversight when most administrative staff are absent. 46m per day ▼ 8% State avg: 50m per day · National avg: 29m per day

Capacity and availability

This home usually has availability

Lower occupancy than the Utah average: 70.1%
Occupancy rate
58.1% Rank #62 / 86Occupancy rate — State benchmarkedThis home is ranked 62nd out of 86 homes in Utah. Shows this facility's occupancy rate versus the Utah average, with its Statewide rank out of 86. Higher occupancy signals strong local demand and financial stability.Rankings are based only on facilities in Utah that report data for that category. Facilities without available data are excluded from the ranking.Click the rank badge to see the full State ranking.Click here to see the full State ranking.
Avg. Length of Stay
98 days
Bed community size
184-bed community Rank #6 / 196Bed count — State benchmarkedThis home is ranked 6th out of 196 homes in Utah. Shows this facility's certified or reported bed count compared to other Utah facilities. Larger communities may offer more amenities, programs, and on-site services for residents and families.Rankings are based only on facilities in Utah that report data for that category. Facilities without available data are excluded from the ranking.Click the rank badge to see the full State ranking.Click here to see the full State ranking.
A large-scale community that may provide a wide range of amenities, services, and structured programs.
Walk Score
Walk Score: 67 / 100 Rank #73 / 280Walk Score — State benchmarkedThis home is ranked 73rd out of 280 homes in Utah. Shows how walkable this facility's neighborhood is compared to the average Walk Score across Utah facilities. Higher scores benefit residents, families, and staff.Rankings are based only on facilities in Utah that report data for that category. Facilities without available data are excluded from the ranking.Click the rank badge to see the full State ranking.Click here to see the full State ranking.
Moderately walkable. Some errands can be accomplished on foot, with a mix of nearby amenities.

Contact Sandstone Millcreek

Staffing Data

Reporting period: October 1 – December 31, 2025 (Q4 2025). Source: CMS Payroll-Based Journal report.

Total staff 155
Employees 125
Contractors 30
Staff to resident ratio 1.65 : 1
23% fewer staff per resident than Utah average
Utah average ratio: 2.14 : 1 Utah average ratio: 2.14 : 1See full Utah ranking
Avg staff/day 57
Average shift 8 hours
0% compared with Utah average
Utah average: 7.9 hours Utah average shift: 7.9 hoursSee full Utah ranking
Total staff hours (quarter) 41,894

Nursing staff breakdown

Q4 2025 · Oct 1 – Dec 31 More info This data comes from the CMS Payroll-Based Journal report covering October 1 – December 31, 2025.
Registered Nurse

Manages medical care and health needs.

RN Staff Info 29 total: 25 full-time employees and 4 contractors. 29
Average shift length Info Average shift length. Calculated as total hours divided by days worked and average staff per day. 9.5 hours
Licensed Practical Nurse

Assists with medical care and medications.

LPN Staff Info 14 total: 13 full-time employees and 1 contractor. 14
Average shift length Info Average shift length. Calculated as total hours divided by days worked and average staff per day. 9.4 hours
Certified Nursing Assistant

Helps with daily care and mobility.

CNA Staff Info 66 total: 61 full-time employees and 5 contractors. 66
Average shift length Info Average shift length. Calculated as total hours divided by days worked and average staff per day. 7.9 hours

Contractor staffing

Q4 2025 · Oct 1 – Dec 31 More info This data comes from the CMS Payroll-Based Journal report covering October 1 – December 31, 2025.

Total hours from contractors

7.2%

3,006 contractor hours this quarter

Respiratory Therapy Technician: 7 Certified Nursing Assistant: 5 Registered Nurse: 4 Speech Language Pathologist: 4 Physical Therapy Aide: 4 Physical Therapy Assistant: 3 Qualified Social Worker: 2 Licensed Practical Nurse: 1

Staff by category

Q4 2025 · Oct 1 – Dec 31 More info This data comes from the CMS Payroll-Based Journal report covering October 1 – December 31, 2025.
Certified Nursing Assistant6156620,29492100%7.9
Registered Nurse254298,63392100%9.5
Licensed Practical Nurse131145,06592100%9.4
Clinical Nurse Specialist4041,5266470%7.5
Other Dietary Services Staff6061,42892100%7.3
Nurse Aide in Training7079908087%6.1
Dental Services Staff2027866166%7.6
Qualified Activities Professional4045834347%8.9
Administrator1015126470%8
Nurse Practitioner1015126470%8
Speech Language Pathologist0444997379%5.3
Physical Therapy Aide0444506166%7.2
Physical Therapy Assistant0332046065%3.4
Respiratory Therapy Technician0772045054%3.8
Qualified Social Worker0221855459%2.7
RN Director of Nursing1012433%8
66 Certified Nursing Assistant
% of Days 100%
29 Registered Nurse
% of Days 100%
14 Licensed Practical Nurse
% of Days 100%
4 Clinical Nurse Specialist
% of Days 70%
6 Other Dietary Services Staff
% of Days 100%
7 Nurse Aide in Training
% of Days 87%
2 Dental Services Staff
% of Days 66%
4 Qualified Activities Professional
% of Days 47%
1 Administrator
% of Days 70%
1 Nurse Practitioner
% of Days 70%
4 Speech Language Pathologist
% of Days 79%
4 Physical Therapy Aide
% of Days 66%
3 Physical Therapy Assistant
% of Days 65%
7 Respiratory Therapy Technician
% of Days 54%
2 Qualified Social Worker
% of Days 59%
1 RN Director of Nursing
% of Days 3%

Penalties and fines

Includes penalties issued in 2024

Federal penalties imposed by CMS for regulatory violations, including civil money penalties (fines) and denials of payment for new Medicare/Medicaid admissions.

Source: CMS Penalties Database (Data as of Jan 2026)

Total fines amount $8K Rank #77 / 80Federal fines — State benchmarkedThis home is ranked 77th out of 80 homes in Utah. Shows this facility's cumulative CMS federal fine dollars versus the Utah average among facilities with fines, and where it ranks among 80 facilities in the pool. Lower total dollars mean a better rank.Rankings are based only on facilities in Utah that report data for that category. Facilities without available data are excluded from the ranking.Click the rank badge to see the full State ranking.Click here to see the full State ranking.
85% lower than Utah average

Utah average: $53K

Number of fines 1
48% fewer fines than Utah average

Utah average: 1.9

Payment Denials Info Serious action where Medicare and/or Medicaid temporarily stops payments for new residents until issues are fixed. 0
100% fewer payment denials than Utah average

Utah average: 0.3

Fines amount comparison
This facility $8K
Utah average $53K
Penalty History

Penalties are imposed by CMS for violations of federal nursing home regulations.

1 penalty in the past 3 years

Jan 31, 2024 · $8K

Civil Money Penalty Info Fines imposed for noncompliance, which can be assessed per day or per instance of violation. Jan 31, 2024
$8K

Last updated: Jan 2026

Quality of care over time

These measures show how residents usually do over time at this home, based on health outcomes and preventive care.

High-risk clinical events score Info A composite score based on pressure ulcers, falls with injury, weight loss, walking ability decline, and activities of daily living decline. 5.9
37% better than Utah average

Utah average: 9.3

Functional decline score Info A composite score based on activities of daily living decline, walking ability decline, and incontinence. 14.3
29% better than Utah average

Utah average: 20.1

Long-stay resident measures
Significantly above average Utah avg: 4.0 Info CMS star rating based on long-stay quality measure performance. 5 stars = significantly above average, 1 star = significantly below average.
Need for Help with Daily Activities Increased Info Percent of long-stay residents whose need for help with daily activities has increased 5.0%
68% better than Utah average

Utah average: 15.7%

Walking Ability Worsened Info Percent of long-stay residents whose ability to move independently worsened 15.3%
28% better than Utah average

Utah average: 21.3%

Low Risk Residents with Bowel/Bladder Incontinence Info Percent of low risk long-stay residents who lose control of their bowels or bladder 22.7%
In line with Utah average

Utah average: 23.1%

Falls with Major Injury Info Percent of long-stay residents experiencing one or more falls with major injury 0.3%
88% better than Utah average

Utah average: 2.6%

High Risk Residents with Pressure Ulcers Info Percent of long-stay high risk residents with pressure ulcers 4.8%
13% worse than Utah average

Utah average: 4.2%

Urinary Tract Infection Info Percent of long-stay residents with a urinary tract infection 1.3%
39% better than Utah average

Utah average: 2.1%

Lost Too Much Weight Info Percent of long-stay residents who lose too much weight 4.1%
In line with Utah average

Utah average: 4.1%

Depressive Symptoms Info Percent of long-stay residents who have depressive symptoms 5.8%
65% better than Utah average

Utah average: 16.5%

Antipsychotic Use Info Percent of long-stay residents who received an antipsychotic medication 6.4%
52% better than Utah average

Utah average: 13.5%

Pneumococcal Vaccine Info Percent of long-stay residents assessed and appropriately given the pneumococcal vaccine 95.1%
In line with Utah average

Utah average: 97.1%

Influenza Vaccine Info Percent of long-stay residents assessed and appropriately given the seasonal influenza vaccine 100.0%
In line with Utah average

Utah average: 98.0%

Hospitalizations per 1,000 days Info Number of hospitalizations per 1,000 long-stay resident days. 1.25
5% worse than Utah average

Utah average: 1.19

ED visits per 1,000 days Info Number of outpatient emergency department visits per 1,000 long-stay resident days. 0.83
45% better than Utah average

Utah average: 1.50

Short-stay resident measures
Significantly above average Utah avg: 3.3 Info CMS star rating based on short-stay quality measure performance. 5 stars = much above average, 1 star = much below average.
Pneumococcal Vaccine Info Percent of short-stay residents assessed and appropriately given the pneumococcal vaccine 94.9%
In line with Utah average

Utah average: 92.9%

Antipsychotic medication increase Info Percent of short-stay residents who newly received an antipsychotic medication 1.0%
5% better than Utah average

Utah average: 1.1%

Influenza Vaccine Info Percent of short-stay residents assessed and appropriately given the seasonal influenza vaccine 89.7%
In line with Utah average

Utah average: 91.0%

Re-hospitalized after SNF stay Info Percentage of short-stay residents who were re-hospitalized after their nursing home admission. 13.7%
21% better than Utah average

Utah average: 17.4%

Emergency department visits Info Percentage of short-stay residents who had an outpatient emergency department visit. 12.2%
In line with Utah average

Utah average: 11.8%

Falls with major injury Info Percentage of SNF residents who experience falls with major injury during their stay. 0.0%
100% better than Utah average

Utah average: 0.8%

Ability to care for self at discharge Info Percentage of residents at or above expected ability to care for themselves at discharge. 41.4%
23% worse than Utah average

Utah average: 53.7%

Successful return to home or community Info Rate of successful return to home or community from a skilled nursing facility. 60.4%
19% better than Utah average

Utah average: 50.6%

Breakdown by payment type

Medicare

12% of new residents, usually for short-term rehab.

Typical stay 21 days

Private pay

65% of new residents, often for short stays.

Typical stay 1 - 2 months

Medicaid

23% of new residents, often for long-term daily care.

Typical stay 9 - 10 months

Facility Characteristics

Source: CMS Long-Term Care Facility Characteristics (Data as of Jan 2026)

Total residents 94
Medicare
17
18.1% of residents
Medicaid
62
66% of residents
Private pay or other
15
16% of residents
Programs & Services
Residents Group

Residents meet regularly to discuss policies, care quality, and activities

Active Resident Council

Organized group of residents that meets regularly to discuss facility policies, quality of life, and activities.

Finances and operations

Based on CMS SNF Cost Report for fiscal year ending in 06/2024.

For-profit
Operated by a single business entity.
Net patient revenue Info Net patient revenue — what the home actually collects for resident care, after contractual allowances, bad debt and discounts are subtracted from its gross charges (CMS cost report, Worksheet G-3). It covers resident care only; money the home earns from other sources is shown separately as "Other income."
$15.5M
Net patient income Info Net patient income: net patient revenue minus the home's total operating expenses. A positive figure means it earns more from resident care than it spends to deliver it; a negative figure means the opposite. It excludes non-operating "other income."
$508.8K
For-profit Operated by a single business entity.
Net patient revenue Info Net patient revenue — what the home actually collects for resident care, after contractual allowances, bad debt and discounts are subtracted from its gross charges (CMS cost report, Worksheet G-3). It covers resident care only; money the home earns from other sources is shown separately as "Other income."
$15.5M Rank #6 / 77Revenue — State benchmarkedThis home is ranked 6th out of 77 homes in Utah. Shows this facility's annual revenue compared to the Utah average. Higher revenue generally means more resources for staffing and capital — read alongside Payroll %.Rankings are based only on facilities in Utah that report data for that category. Facilities without available data are excluded from the ranking.Click the rank badge to see the full State ranking.Click here to see the full State ranking.
Net patient income Info Net patient income: net patient revenue minus the home's total operating expenses. A positive figure means it earns more from resident care than it spends to deliver it; a negative figure means the opposite. It excludes non-operating "other income."
$508.8K
Other income Info Money the home earns outside of resident care — such as investments, grants, rentals and other non-operating sources (CMS cost report, Worksheet G-3). It is tracked separately from net patient revenue: it is not part of that figure, and it is not included in net patient income.
$206.6K
Payroll costs Info Staff salaries plus wage-related costs — benefits such as payroll taxes, health insurance and retirement — from the home's own accounting records (CMS cost report, Worksheet A). Contract or agency labor is counted separately, under other operating costs. Rank #7 / 77Payroll — State benchmarkedThis home is ranked 7th out of 77 homes in Utah. Shows total annual staff payroll benchmarked to the Utah average. Higher payroll investment relative to peers often signals better staffing and less reliance on cheaper contract labor.Rankings are based only on facilities in Utah that report data for that category. Facilities without available data are excluded from the ranking.Click the rank badge to see the full State ranking.Click here to see the full State ranking.
$6.7M 43.1% of net patient revenue Info Payroll as a share of revenue: staff salaries and wage-related benefits divided by net patient revenue. A higher figure means more of each revenue dollar goes to staff pay. Rank #62 / 77Payroll % — State benchmarkedThis home is ranked 62nd out of 77 homes in Utah. Shows payroll as a percentage of revenue versus the Utah average. Well-run Utah facilities typically land around 52–58% — the top third Statewide. Below 25% may signal understaffing or heavy agency use — read with Staffing ratings.Rankings are based only on facilities in Utah that report data for that category. Facilities without available data are excluded from the ranking.Click the rank badge to see the full State ranking.Click here to see the full State ranking.
Other operating costs Info Everything it costs to run the home apart from payroll — food, utilities, supplies, maintenance, contract labor and administration. Calculated as total operating expense minus payroll (staff salaries and wage-related benefits).
$8.3M
Total costs Info The home's total operating expense for the year — all the costs of running it, salaries included (CMS cost report, Worksheet G-3).
$14.9M

Who this home usually serves

TYPE OF STAY

Primarily long-term care, limited rehab

Most residents stay long-term, while a smaller portion are admitted for short-term rehab.

Most new residents arrive under private pay (65% of admissions), and a typical private pay stay runs around 1 - 2 months.

Admissions
413 total

Coverage residents most often arrive under.

Medicare 12%
Private pay 65%
Medicaid 23%
Discharges
399 total

Coverage residents most often leave under.

Medicare 9%
Private pay 63%
Medicaid 28%

Places of interest near Sandstone Millcreek

Address 5.1 miles from city center Info Estimated distance in miles from Salt Lake City's city center to Sandstone Millcreek's address, calculated via Google Maps.

Calculate Travel Distance to Sandstone Millcreek

Add your location

Address

Compare Nursing Homes around Salt Lake City

The information below is reported by the Utah Department of Health and Human Services, Health Facility Licensing.

5 facilities compared · CMS & UT Dept. of Health data

William E. Christoffersen Salt Lake Veterans Home
NH
MC
NC
RC
Salt Lake City (University)
81
Facility 81
UT AVG 84
Rank #89 / 196
92.1%
Facility 92.1%
UT AVG 70.1%
Rank #9 / 86
+31%
4.86
Facility 4.86
UT AVG 3.72
Rank #9 / 80
+32%+31%
$12.7k
Facility $12.7k
UT AVG $52.4k
Rank #44 / 80
22
Facility 22
UT AVG 27.7
Rank #38 / 79
5.5
Facility 5.5
UT AVG 7.6
Rank #28 / 79
175-
39
Facility 39
UT AVG 47
Rank #177 / 280
Avalon Va Management LLC
$12.8M
Facility $12.8M
UT AVG $10.3M
Rank #13 / 77
$6.9M
Facility $6.9M
UT AVG $3.8M
Rank #9 / 77
53.9%
Facility 53.9%
UT AVG 38%
Rank #28 / 77
465150
Sandstone Taylorsville
NH
NC
Salt Lake City
120
Facility 120
UT AVG 84
Rank #33 / 196
33.3%
Facility 33.3%
UT AVG 70.1%
Rank #82 / 86
-53%
3.47
Facility 3.47
UT AVG 3.72
Rank #37 / 80
-3%-7%
$7.5k
Facility $7.5k
UT AVG $52.4k
Rank #38 / 80
23
Facility 23
UT AVG 27.7
Rank #41 / 79
7.7
Facility 7.7
UT AVG 7.6
Rank #51 / 79
240-
38
Facility 38
UT AVG 47
Rank #183 / 280
Redwood Nursing & Rehab LLC
$15.1M
Facility $15.1M
UT AVG $10.3M
Rank #10 / 77
$5.1M
Facility $5.1M
UT AVG $3.8M
Rank #16 / 77
33.9%
Facility 33.9%
UT AVG 38%
Rank #68 / 77
465066
City Creek Post Acute
NH
Salt Lake City (East Central)
108
Facility 108
UT AVG 84
Rank #55 / 196
70.8%
Facility 70.8%
UT AVG 70.1%
Rank #35 / 86
+1%
3.79
Facility 3.79
UT AVG 3.72
Rank #24 / 80
-54%+2%
$0
Facility $0
UT AVG $52.4k
Rank #1 / 80
18
Facility 18
UT AVG 27.7
Rank #29 / 79
6.0
Facility 6.0
UT AVG 7.6
Rank #33 / 79
268-
75
Facility 75
UT AVG 47
Rank #36 / 280
Avenues Healthcare, Inc
$7.9M
Facility $7.9M
UT AVG $10.3M
Rank #50 / 77
$4.5M
Facility $4.5M
UT AVG $3.8M
Rank #32 / 77
57.4%
Facility 57.4%
UT AVG 38%
Rank #3 / 77
465072
Sandstone Millcreek
NH
Salt Lake City
184
Facility 184
UT AVG 84
Rank #6 / 196
58.1%
Facility 58.1%
UT AVG 70.1%
Rank #62 / 86
-17%
3.47
Facility 3.47
UT AVG 3.72
Rank #37 / 80
+11%-7%
$120.9k
Facility $120.9k
UT AVG $52.4k
Rank #77 / 80
48
Facility 48
UT AVG 27.7
Rank #65 / 79
12.0
Facility 12.0
UT AVG 7.6
Rank #69 / 79
2102-
67
Facility 67
UT AVG 47
Rank #73 / 280
Millcreek Nursing & Rehab LLC
$15.5M
Facility $15.5M
UT AVG $10.3M
Rank #6 / 77
$6.7M
Facility $6.7M
UT AVG $3.8M
Rank #7 / 77
43.1%
Facility 43.1%
UT AVG 38%
Rank #62 / 77
465094
Pine Creek Rehab and Nursing
NH
HC
RC
Salt Lake City (Poplar Grove)
34
Facility 34
UT AVG 84
Rank #168 / 196
--
3.09
Facility 3.09
UT AVG 3.72
Rank #62 / 80
--17%
$56.1k
Facility $56.1k
UT AVG $52.4k
Rank #66 / 80
-
Facility -
UT AVG 27.7
Rank #64 / 79
-
Facility -
UT AVG 7.6
Rank #66 / 79
-29-
70
Facility 70
UT AVG 47
Rank #60 / 280
----46A064

Financial Assistance for
Nursing Home in Utah

Sandstone Millcreek is located in Salt Lake City, Utah.
Here are the financial assistance programs available to residents in Utah.

Get Financial aid guidance

Aging Waiver

UT Medicaid Aging Waiver

Age 65+
General Utah resident, Medicaid-eligible, nursing home-level care need.
Income Limits (2025) ~$2,829/month 300% FBR, individual
Asset Limits $2,000 (individual), $3,000 (couple).
UT

Rural challenges; waitlists possible.

Benefits
Personal care (5-7 hours/day) Respite (240 hours/year) Adult day care ($65/day) Home modifications ($1,500 avg.)

Utah Alternatives Program

UT Alternatives

Age 60+
General Utah resident, at risk of nursing home.
Income Limits ~$2,000/month individual, varies
Asset Limits $5,000 individual
UT

Limited funding; rural focus.

Benefits
In-home care (3-5 hours/week) Respite (up to 10 days/year) Transportation (~5 trips/month)

Older Americans Act (OAA) Services

Utah OAA Services

Age 60+
General UT resident; no income/asset limits.
Income Limits (2025) None; donations encouraged.
Asset Limits Not assessed.
UT

12 AAAs; includes Meals on Wheels; rural emphasis.

Benefits
Meals (~$5-$7/meal) Transportation Homemaker services (~4 hours/week) Respite (5 days/year) Legal aid

Medicare Savings Program (MSP)

Utah Medicare Savings Program

Age 65+ or disabled
General UT resident, Medicare Part A/B.
Income Limits (2025) ~$2,510/month (QMB), ~$3,380/month (SLMB), ~$3,598/month (QI)—individual.
Asset Limits $9,430 (individual), $14,130 (couple).
UT

Includes Extra Help for Part D; no waitlist.

Benefits
Covers Part B premiums ($174.70/month) Deductibles ($240/year) Copays (~20%)

Home Energy Assistance Target (HEAT) Program

Utah HEAT Program

Age 60+ prioritized
General UT resident, low-income household.
Income Limits (2025) ~$3,970/month 185% FPL
Asset Limits Not assessed.
UT

Covers gas, electric, propane; emergency aid available.

Benefits
Heating/cooling aid ($300-$1,000/season) Crisis aid ($500 max)

Utah Caregiver Support Program

Utah Family Caregiver Support Program (FCSP)

Age
General Caregivers of 60+ needing care or 55+ caregivers of others; UT resident; 2+ ADLs.
Income Limits (2025) No strict cap; prioritizes low-income ~$24,980/year
Asset Limits Not assessed.
UT

Includes grandparent caregivers; serves ~1,500 annually.

Benefits
Respite (4-6 hours/week or 5 days/year) Adult day care ($60/day) Training Supplies (~$500/year)

VA Aid and Attendance (A&A) and Housebound Benefits

Utah VA Aid and Attendance/Housebound

Age 65+ or disabled veteran/spouse
General UT resident, wartime service, ADL help (A&A) or homebound.
Income Limits (2025) Net income < ~$1,984/month (veteran with dependent, A&A); pension offsets income.
Asset Limits ~$155,356 net worth
UT

Supports rural veterans; high demand near VA centers.

Benefits
Cash (~$1,433-$2,642/month veteran, ~$951-$1,318 spouse) for care costs

Property Tax Abatement and Deferral Programs

Utah Circuit Breaker and Deferral Programs

Age 66+ (abatement) or 75+ (deferral)
General UT resident 10+ months/year, homeowner.
Income Limits (2025) ~$40,000/year (household, abatement); no limit for deferral.
Asset Limits Not assessed; home value < ~$500,000 typical.
UT

Abatement up to $1,200; deferral accrues interest (2.5%-5%).

Benefits
Tax relief (~$500-$1,200/year) or deferral (postpones payment)

Senior Farmers’ Market Nutrition Program (SFMNP)

Utah SFMNP

Age 60+
General UT resident, low-income.
Income Limits (2025) ~$2,322/month 185% FPL
Asset Limits Not assessed.
UT

Vouchers (~$50/season); serves ~5,000 via 12 AAAs.

Benefits
Vouchers (~$50/season) for produce at farmers’ markets

Frequently Asked Questions about Sandstone Millcreek

Is Sandstone Millcreek in a walkable area?

Sandstone Millcreek has a walk score of 67. Moderately walkable. Some errands can be accomplished on foot, with a mix of nearby amenities.

What is the occupancy rate at Sandstone Millcreek?

Sandstone Millcreek's occupancy is 58.1%.

Does Sandstone Millcreek operate as a for-profit or non-profit?

Sandstone Millcreek is registered as a for-profit.

Are there photos of Sandstone Millcreek?

Yes — there are 6 photos of Sandstone Millcreek in the photo gallery on this page.

What is the address of Sandstone Millcreek?

Sandstone Millcreek is located at 3855 S 700 E, Salt Lake City, UT 84106.

What is the phone number of Sandstone Millcreek?

(801) 268-4766 will put you in contact with the team at Sandstone Millcreek.

Is Sandstone Millcreek Medicare or Medicaid certified?

Yes — Sandstone Millcreek is a CMS-certified provider of Medicare and Medicaid.

Guides for Better Senior Living

Care Cost Calculator: See Prices in Your Area

Nursing Home Data Explorer

Don’t Wait Too Long: 7 Red Flag Signs Your Parent Needs Assisted Living Now

The True Cost of Assisted Living in 2025 – And How Families Are Paying For It

Understanding Senior Living Costs: Pricing Models, Discounts & Financial Assistance