


Total staff
283
Employees
112
Contractors
171
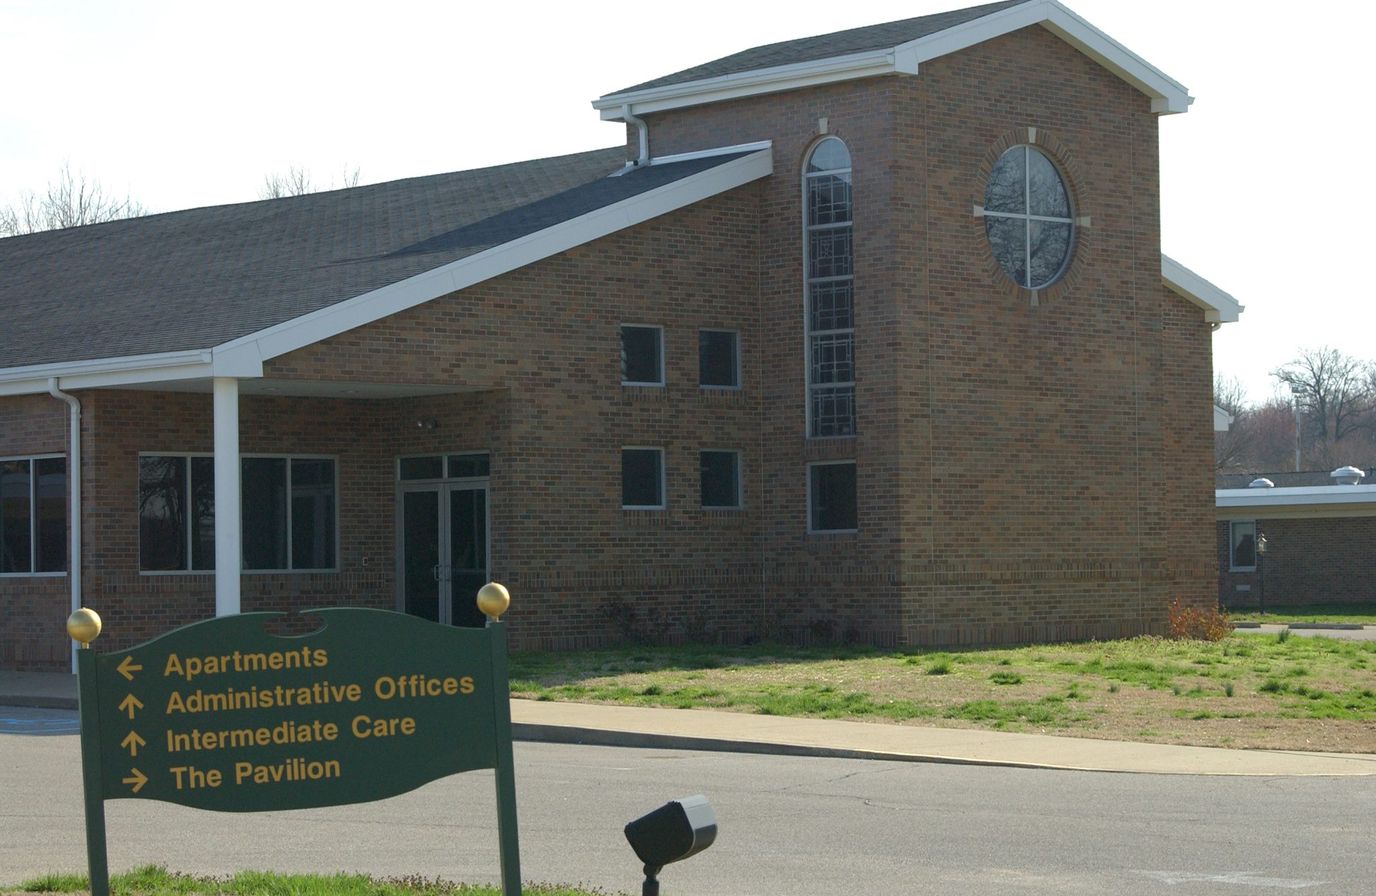


Two hundred forty beds across Evansville. That’s the first fact: the size is spread across skilled nursing, assisted living, and three separate memory care buildings. It’s a governmental operation, located at 601 N Boeke Rd, where the Walk Score hits 38. You’re driving to get groceries.
Current census is 119 residents in a 51.8% full facility. The average stay is 164 days. Medicare covers most admissions, usually for short-term post-acute rehab. Medicaid picks up the longer stays. Private pay is also accepted.
The therapy menu is basic: physical, occupational, and speech-language services. For the memory care program, the stated philosophy centers on flexibility and individual autonomy, which matters if you’re placing someone in that unit. Activities run cooking classes, bingo, live entertainment, gardening groups, movie nights, and arts programming. Laundry and housekeeping are on-site. The facility promises 24/7 emergency nursing.
Nursing hours per resident per day total 2 hours and 52 minutes. Registered nurses handle 22 minutes of that. LPNs cover 40 minutes. Nurse aides account for 2 hours and 30 minutes.
The Good Samaritan Home is structured as a mixed-acuity facility. It accepts both short-term rehabilitation admissions and longer-term placements, with dedicated memory care units running alongside. For families in the Evansville area weighing post-acute rehab against longer-term placement options, this is a setting that theoretically accommodates both timelines under one roof.
Staffing hours
![]() Daily nursing hours per resident by staff type, reported to CMS. Higher is generally better — compare this facility to state and national averages to see where staffing stands.
Daily nursing hours per resident by staff type, reported to CMS. Higher is generally better — compare this facility to state and national averages to see where staffing stands.
Hours per resident per day vs Indiana averages
4 of 6 metrics below state avg
Reporting period: October 1 – December 31, 2025 (Q4 2025). Source: CMS Payroll-Based Journal report.
Manages medical care and health needs.
Assists with medical care and medications.
Helps with daily care and mobility.
Total hours from contractors
11,126 contractor hours this quarter
| Certified Nursing Assistant | 60 | 87 | 147 | 27,606 | 92 | 100% | 8.7 |
| Other Dietary Services Staff | 19 | 0 | 19 | 8,534 | 92 | 100% | 8.5 |
| Licensed Practical Nurse | 11 | 57 | 68 | 7,358 | 92 | 100% | 9 |
| Registered Nurse | 10 | 3 | 13 | 2,744 | 92 | 100% | 9.8 |
| Mental Health Service Worker | 2 | 0 | 2 | 906 | 65 | 71% | 7.4 |
| Clinical Nurse Specialist | 5 | 0 | 5 | 835 | 81 | 88% | 5.3 |
| Speech Language Pathologist | 0 | 4 | 4 | 672 | 71 | 77% | 5.2 |
| Feeding Assistant | 0 | 1 | 1 | 512 | 64 | 70% | 8 |
| Nurse Practitioner | 1 | 0 | 1 | 464 | 58 | 63% | 8 |
| Administrator | 1 | 0 | 1 | 456 | 57 | 62% | 8 |
| Dietitian | 1 | 0 | 1 | 450 | 60 | 65% | 7.5 |
| Physical Therapy Aide | 0 | 5 | 5 | 353 | 61 | 66% | 5.4 |
| Physical Therapy Assistant | 0 | 6 | 6 | 282 | 62 | 67% | 4.3 |
| Respiratory Therapy Technician | 0 | 3 | 3 | 231 | 60 | 65% | 3.4 |
| Qualified Social Worker | 0 | 3 | 3 | 205 | 41 | 45% | 4.9 |
| Occupational Therapy Aide | 0 | 1 | 1 | 44 | 15 | 16% | 2.9 |
| Medical Director | 0 | 1 | 1 | 24 | 12 | 13% | 2 |
| RN Director of Nursing | 1 | 0 | 1 | 10 | 11 | 12% | 0.9 |
| Medication Aide/Technician | 1 | 0 | 1 | 3 | 1 | 1% | 3 |
Includes penalties issued in 2023-2024
Federal penalties imposed by CMS for regulatory violations, including civil money penalties (fines) and denials of payment for new Medicare/Medicaid admissions.
Source: CMS Penalties Database (Data as of Jan 2026)
Indiana average: $27K
Indiana average: 1.4
Indiana average: 0.4
Penalties are imposed by CMS for violations of federal nursing home regulations.
10 penalties in the past 3 years
Multiple penalties were reported in the last 3 years.
Last updated: Jan 2026
These measures show how residents usually do over time at this home, based on health outcomes and preventive care.
Indiana average: 8.0
Indiana average: 17.1
Indiana average: 12.0%
Indiana average: 14.4%
Indiana average: 24.6%
Indiana average: 3.9%
Indiana average: 4.4%
Indiana average: 1.2%
Indiana average: 5.7%
Indiana average: 24.1%
Indiana average: 12.4%
Indiana average: 93.7%
Indiana average: 95.4%
Indiana average: 1.60
Indiana average: 1.48
Indiana average: 81.7%
Indiana average: 1.4%
Indiana average: 79.0%
Indiana average: 22.4%
Indiana average: 10.5%
Indiana average: 0.8%
Indiana average: 53.7%
Indiana average: 50.6%
Quality measures are calculated from Minimum Data Set (MDS) assessments. For most measures, lower percentages indicate better care quality.
33% of new residents, usually for short-term rehab.
27% of new residents, often for short stays.
40% of new residents, often for long-term daily care.
Source: CMS Long-Term Care Facility Characteristics (Data as of Jan 2026)
Residents meet regularly to discuss policies, care quality, and activities
Part of a Continuing Care Retirement Community offering multiple care levels
Organized group of residents that meets regularly to discuss facility policies, quality of life, and activities.
Data sourced from CMS Long-Term Care Facility Characteristics quarterly report. Payer mix reflects the current resident census by primary payment source.
Historical financial and operational data for The Good Samaritan Home from 2011–2022, based on CMS SNF Cost Reports.
Key figures below are for fiscal year ending in 12/2022 — the home's most recent complete cost report, an older period than most facilities report.
Based on the home's most recent complete CMS SNF Cost Report — fiscal year ending in 12/2022. This is an older period than most facilities report, so compare with that in mind.
Most residents stay for extended periods and receive ongoing daily care.
New residents most often arrive under Medicaid (40% of admissions), and a typical Medicaid stay runs around 8 months.
Coverage residents most often arrive under.
Coverage residents most often leave under.
![]() 3.0 miles from city center
3.0 miles from city center
![]() Estimated distance in miles from Evansville's city center to The Good Samaritan Home's address, calculated via Google Maps.
Estimated distance in miles from Evansville's city center to The Good Samaritan Home's address, calculated via Google Maps.
Add your location
Info below is compiled from CMS reports & the IN Dept. of Health (IDOH), senior community websites & trusted data sources such as Walk Score & BBB.
Communities are listed from highest to lowest based on our ranking methodology.
| North River Health Campus | NH ADC AL IL MC SNF | Evansville (East Baseline Road) | 95
Facility
95
IN AVG
116
Rank
#267 / 432 |
50.5%
Facility
50.5%
IN AVG
65.3
Rank
#335 / 422 | -23% | 3.66
Facility
3.66
IN AVG
3.44
Rank
#72 / 277 | +63% | +7% | $0
Facility
$0
IN AVG
$31.4k
Rank
#1 / 279 | 95
Facility
95
IN AVG
83
Rank
#41 / 393 | 10
Facility
10
IN AVG
25.0
Rank
#40 / 279 | 3.3
Facility
3.3
IN AVG
4.1
Rank
#106 / 279 | - | 48 | A+ |
11
Facility
11
IN AVG
40
Rank
#456 / 552 | Thomas Cook | $10.8MFiscal year ending 12/2023
Facility
$10.8MFiscal year ending 12/2023
IN AVG
$10.5M
Rank
#110 / 268 | $5.8MFiscal year ending 12/2023
Facility
$5.8MFiscal year ending 12/2023
IN AVG
$5.2M
Rank
#85 / 268 | 53.6%Fiscal year ending 12/2023
Facility
53.6%Fiscal year ending 12/2023
IN AVG
51.1%
Rank
#98 / 268 | 155854 | ||||
| Cypress Grove Rehabilitation Center | NH HOS MC PC RC SNF | Newburgh | 90
Facility
90
IN AVG
116
Rank
#284 / 432 |
88.9%
Facility
88.9%
IN AVG
65.3
Rank
#37 / 422 | +36% | 3.02
Facility
3.02
IN AVG
3.44
Rank
#204 / 277 | +23% | -12% | $0
Facility
$0
IN AVG
$31.4k
Rank
#1 / 279 | 89
Facility
89
IN AVG
83
Rank
#106 / 393 | 15
Facility
15
IN AVG
25.0
Rank
#74 / 279 | 3.0
Facility
3.0
IN AVG
4.1
Rank
#80 / 279 | - | 80 | A+ |
56
Facility
56
IN AVG
40
Rank
#172 / 552 | Brandon Burns | $10.3MFiscal year ending 12/2023
Facility
$10.3MFiscal year ending 12/2023
IN AVG
$10.5M
Rank
#122 / 268 | $5.5MFiscal year ending 12/2023
Facility
$5.5MFiscal year ending 12/2023
IN AVG
$5.2M
Rank
#97 / 268 | 53.8%Fiscal year ending 12/2023
Facility
53.8%Fiscal year ending 12/2023
IN AVG
51.1%
Rank
#95 / 268 | 155273 | ||||
| River Pointe Health Campus | NH AL RC SNF | Evansville (Galaxy Drive) | 124
Facility
124
IN AVG
116
Rank
#157 / 432 |
46.8%
Facility
46.8%
IN AVG
65.3
Rank
#359 / 422 | -28% | 4.28
Facility
4.28
IN AVG
3.44
Rank
#33 / 277 | -8% | +24% | $0
Facility
$0
IN AVG
$31.4k
Rank
#1 / 279 | 79
Facility
79
IN AVG
83
Rank
#247 / 393 | 19
Facility
19
IN AVG
25.0
Rank
#114 / 279 | 3.8
Facility
3.8
IN AVG
4.1
Rank
#133 / 279 | 1 | 58 | A+ |
52
Facility
52
IN AVG
40
Rank
#199 / 552 | Randall Thompson | $11.6MFiscal year ending 12/2023
Facility
$11.6MFiscal year ending 12/2023
IN AVG
$10.5M
Rank
#92 / 268 | $6.1MFiscal year ending 12/2023
Facility
$6.1MFiscal year ending 12/2023
IN AVG
$5.2M
Rank
#74 / 268 | 52.6%Fiscal year ending 12/2023
Facility
52.6%Fiscal year ending 12/2023
IN AVG
51.1%
Rank
#109 / 268 | 155723 | ||||
| West River Health Campus | NH ADC AL MC RC SNF | Evansville (Westside) | 131
Facility
131
IN AVG
116
Rank
#138 / 432 |
74.0%
Facility
74.0%
IN AVG
65.3
Rank
#153 / 422 | +13% | 4.56
Facility
4.56
IN AVG
3.44
Rank
#27 / 277 | -1% | +33% | $18.7k
Facility
$18.7k
IN AVG
$31.4k
Rank
#253 / 279 | 80
Facility
80
IN AVG
83
Rank
#234 / 393 | 17
Facility
17
IN AVG
25.0
Rank
#102 / 279 | 2.1
Facility
2.1
IN AVG
4.1
Rank
#33 / 279 | 2 | 97 | A+ |
2
Facility
2
IN AVG
40
Rank
#546 / 552 | Carla Baker | $10.1MFiscal year ending 12/2023
Facility
$10.1MFiscal year ending 12/2023
IN AVG
$10.5M
Rank
#128 / 268 | $5.4MFiscal year ending 12/2023
Facility
$5.4MFiscal year ending 12/2023
IN AVG
$5.2M
Rank
#105 / 268 | 53.1%Fiscal year ending 12/2023
Facility
53.1%Fiscal year ending 12/2023
IN AVG
51.1%
Rank
#103 / 268 | 155785 | ||||
| The Good Samaritan Home | NH AL MC | Evansville (Wesselman Park) | 200
Facility
200
IN AVG
116
Rank
#29 / 432 |
60.2%
Facility
60.2%
IN AVG
65.3
Rank
#269 / 422 | -8% | - | -53% | - | $74.2k
Facility
$74.2k
IN AVG
$31.4k
Rank
#274 / 279 | - | 43
Facility
43
IN AVG
25.0
Rank
#239 / 279 | 6.1
Facility
6.1
IN AVG
4.1
Rank
#232 / 279 | 3 | 120 | - |
38
Facility
38
IN AVG
40
Rank
#279 / 552 | - | $13.8M*Fiscal year ending 12/2022These figures are from this home's most recent complete cost report — an older period than most facilities report. Compare with that in mind. | $11.1M*Fiscal year ending 12/2022These figures are from this home's most recent complete cost report — an older period than most facilities report. Compare with that in mind. | 80.6%*Fiscal year ending 12/2022These figures are from this home's most recent complete cost report — an older period than most facilities report. Compare with that in mind. | 155716 |
The Good Samaritan Home is located in Evansville, Indiana.
Here are the financial assistance programs available to residents in Indiana.
The Good Samaritan Home is in the Wesselman Park neighborhood.
The Good Samaritan Home has a walk score of 38. Somewhat walkable. A few nearby services may be reachable on foot, but most trips require transportation.
The Good Samaritan Home's occupancy is 51.8%.
No, The Good Samaritan Home has a no-pet policy.
The Good Samaritan Home is a government-operated nursing facility.
Yes — there are 3 photos of The Good Samaritan Home in the photo gallery on this page.
The Good Samaritan Home is located at 601 N Boeke Rd, Evansville, IN 47711.
Care Cost Calculator: See Prices in Your Area
Nursing Home Data Explorer
Don’t Wait Too Long: 7 Red Flag Signs Your Parent Needs Assisted Living Now
The True Cost of Assisted Living in 2025 – And How Families Are Paying For It
Understanding Senior Living Costs: Pricing Models, Discounts & Financial Assistance


