


Compare Memory Care around Rockville
The information below is reported by the Maryland Department of Health, Office of Health Care Quality.
| Ingleside at King Farm | MC AL IL NH SNF | Rockville (King Farm) | 45
Facility
45
MD AVG
43
Rank
#226 / 690 | Yes |
73
Facility
73
MD AVG
43
Rank
#152 / 985 | 1 Bed / 2 Bed | - | - | - | - | - | - | - | - | - | - | - |
| Revitz House | MC AL HC IL NH SNF | Rockville | 558
Facility
558
MD AVG
43
Rank
#1 / 690 | Yes |
81
Facility
81
MD AVG
43
Rank
#86 / 985 | 1 Bed | - | - | - | - | - | - | - | - | - | - | - |
| Autumn Lake Healthcare at Oak Manor | MC NH PC RC SNF | Burtonsville (Perrywood Estates) | 145
Facility
145
MD AVG
43
Rank
#46 / 690 | No |
18
Facility
18
MD AVG
43
Rank
#756 / 985 | - | - | - | - | - | - | - | - | - | - | - | - |
| Village at Rockville | MC AL HC IL NH RC SNF | Rockville | 57
Facility
57
MD AVG
43
Rank
#208 / 690 | No |
94
Facility
94
MD AVG
43
Rank
#9 / 985 | - | 13
Facility
13
MD AVG
21
Rank
#142 / 210 | - | - | - | - | - | - | - | - | - | - |
| Collingswood Rehabilitation & Healthcare Center | MC HOS NH PC RC SNF | Rockville (Hurley Avenue) | 160
Facility
160
MD AVG
43
Rank
#27 / 690 | No |
43
Facility
43
MD AVG
43
Rank
#495 / 985 | - | - | A+ | - | - | - | - | - | - | - | - | - |
| Sunrise of Rockville | MC AL HOS | Rockville (Baltimore Road) | 89
Facility
89
MD AVG
43
Rank
#155 / 690 | Yes |
89
Facility
89
MD AVG
43
Rank
#32 / 985 | Studio / 1 Bed / 2 Bed | 45
Facility
45
MD AVG
21
Rank
#4 / 210 | A- |
23% Male Residents — State Benchmarked 23% of residents are male, compared to the Maryland average of 31%. This facility caters to a majority female resident pool (77% female), consistent with the broader assisted living trend where women significantly outnumber men. |
77% Female Residents — State Benchmarked 77% of residents are female, compared to the Maryland average of 69%. Women comprise the large majority, consistent with national assisted living demographics where women live longer and enter care facilities at higher rates. |
87% White Residents — State Benchmarked 87% of residents are reported as White, compared to the Maryland average of 81%. Close to the average for this category among assisted living facilities in Maryland with reported race/ethnicity data. |
2% African American Residents — State Benchmarked 2% of residents are reported as African American or Black, compared to the Maryland average of 13%. A lower African American share than is typical in Maryland; local markets still vary widely. |
11% Other Ethnicity Residents — State Benchmarked 11% of residents fall into categories other than White or African American (combined), compared to the Maryland average of 6%. This column aggregates Hispanic, Asian, multiracial, and any other labeled groups that are not classified as White or African American. Reported subgroups in this total: Mixed Race (6%), Hispanic (3%), Asian (2%). |
3% Residents Age 65–74 — State Benchmarked 3% of residents are 65–74, compared to the Maryland average of 13%. Fewer younger seniors suggests the resident population skews older, likely requiring higher acuity care and more hands-on support. |
31% Residents Age 75–84 — State Benchmarked 31% of residents are 75–84, compared to the Maryland average of 31%. This is the second most common age bracket in assisted living, representing residents with moderate care needs. |
56% Residents Age 85–94 — State Benchmarked 56% of residents are 85–94, compared to the Maryland average of 44%. A high concentration of very elderly residents signals a higher-acuity facility with experience caring for advanced age-related needs. |
10% Residents Age 95+ — State Benchmarked 10% of residents are 95 or older, compared to the Maryland average of 16%. Most residents here have not yet reached the oldest-old bracket, suggesting a younger overall community. |
| AlfredHouse V | MC AL RC | Rockville | 16
Facility
16
MD AVG
43
Rank
#253 / 690 | No |
12
Facility
12
MD AVG
43
Rank
#802 / 985 | Private Rooms | 33
Facility
33
MD AVG
21
Rank
#25 / 210 | A+ |
33% Male Residents — State Benchmarked 33% of residents are male, compared to the Maryland average of 31%. This facility caters to a majority female resident pool (67% female), consistent with the broader assisted living trend where women significantly outnumber men. |
67% Female Residents — State Benchmarked 67% of residents are female, compared to the Maryland average of 69%. Women comprise the large majority, consistent with national assisted living demographics where women live longer and enter care facilities at higher rates. |
92% White Residents — State Benchmarked 92% of residents are reported as White, compared to the Maryland average of 81%. A higher White share than is typical for assisted living in Maryland in this dataset — compare with peer facilities for local context. |
8% African American Residents — State Benchmarked 8% of residents are reported as African American or Black, compared to the Maryland average of 13%. In line with the Maryland average for African American residents among facilities reporting this breakdown. |
0% Other Ethnicity Residents — State Benchmarked 0% of residents fall into categories other than White or African American (combined), compared to the Maryland average of 6%. This column aggregates Hispanic, Asian, multiracial, and any other labeled groups that are not classified as White or African American. | - |
58% Residents Age 75–84 — State Benchmarked 58% of residents are 75–84, compared to the Maryland average of 31%. A high concentration in this mid-range bracket, where residents typically need moderate support with daily activities. |
42% Residents Age 85–94 — State Benchmarked 42% of residents are 85–94, compared to the Maryland average of 44%. This is typically the most common age bracket in assisted living — this facility is in line with the statewide norm. | - |
| Arbor Place Dementia Care | MC HOS | Rockville (Muncaster Mill Road) | 16
Facility
16
MD AVG
43
Rank
#253 / 690 | No |
26
Facility
26
MD AVG
43
Rank
#677 / 985 | Private Rooms | 28
Facility
28
MD AVG
21
Rank
#53 / 210 | - |
19% Male Residents — State Benchmarked 19% of residents are male, compared to the Maryland average of 31%. This facility caters to a majority female resident pool (81% female), consistent with the broader assisted living trend where women significantly outnumber men. |
81% Female Residents — State Benchmarked 81% of residents are female, compared to the Maryland average of 69%. Women comprise the large majority, consistent with national assisted living demographics where women live longer and enter care facilities at higher rates. |
100% White Residents — State Benchmarked 100% of residents are reported as White, compared to the Maryland average of 81%. A higher White share than is typical for assisted living in Maryland in this dataset — compare with peer facilities for local context. |
0% African American Residents — State Benchmarked 0% of residents are reported as African American or Black, compared to the Maryland average of 13%. A lower African American share than is typical in Maryland; local markets still vary widely. |
0% Other Ethnicity Residents — State Benchmarked 0% of residents fall into categories other than White or African American (combined), compared to the Maryland average of 6%. This column aggregates Hispanic, Asian, multiracial, and any other labeled groups that are not classified as White or African American. |
6% Residents Age 65–74 — State Benchmarked 6% of residents are 65–74, compared to the Maryland average of 13%. Fewer younger seniors suggests the resident population skews older, likely requiring higher acuity care and more hands-on support. |
25% Residents Age 75–84 — State Benchmarked 25% of residents are 75–84, compared to the Maryland average of 31%. Below the state norm — the resident mix may skew either younger or older than this typical middle bracket. |
19% Residents Age 85–94 — State Benchmarked 19% of residents are 85–94, compared to the Maryland average of 44%. The population here skews younger than the statewide norm, which may indicate a more active, lower-acuity community. |
44% Residents Age 95+ — State Benchmarked 44% of residents are 95 or older, compared to the Maryland average of 16%. A high proportion of the oldest-old suggests strong end-of-life care experience and very-high-acuity capabilities. |
| Brightview West End | MC AL IL | Rockville | 98
Facility
98
MD AVG
43
Rank
#131 / 690 | Yes |
89
Facility
89
MD AVG
43
Rank
#32 / 985 | Studio / 1 Bed / 2 Bed | 8
Facility
8
MD AVG
21
Rank
#164 / 210 | - |
32% Male Residents — State Benchmarked 32% of residents are male, compared to the Maryland average of 31%. This facility caters to a majority female resident pool (68% female), consistent with the broader assisted living trend where women significantly outnumber men. |
68% Female Residents — State Benchmarked 68% of residents are female, compared to the Maryland average of 69%. Women comprise the large majority, consistent with national assisted living demographics where women live longer and enter care facilities at higher rates. |
84% White Residents — State Benchmarked 84% of residents are reported as White, compared to the Maryland average of 81%. Close to the average for this category among assisted living facilities in Maryland with reported race/ethnicity data. |
4% African American Residents — State Benchmarked 4% of residents are reported as African American or Black, compared to the Maryland average of 13%. A lower African American share than is typical in Maryland; local markets still vary widely. |
12% Other Ethnicity Residents — State Benchmarked 12% of residents fall into categories other than White or African American (combined), compared to the Maryland average of 6%. This column aggregates Hispanic, Asian, multiracial, and any other labeled groups that are not classified as White or African American. Reported subgroups in this total: Other (5%), Asian (4%), Mixed Race (4%). |
14% Residents Age 65–74 — State Benchmarked 14% of residents are 65–74, compared to the Maryland average of 13%. In line with the statewide profile for this youngest senior bracket in assisted living. |
37% Residents Age 75–84 — State Benchmarked 37% of residents are 75–84, compared to the Maryland average of 31%. A high concentration in this mid-range bracket, where residents typically need moderate support with daily activities. |
33% Residents Age 85–94 — State Benchmarked 33% of residents are 85–94, compared to the Maryland average of 44%. The population here skews younger than the statewide norm, which may indicate a more active, lower-acuity community. |
16% Residents Age 95+ — State Benchmarked 16% of residents are 95 or older, compared to the Maryland average of 16%. In line with the statewide profile for the oldest resident bracket. |
| Brightview Fallsgrove | MC AL | Rockville (Glenora Hills) | 100
Facility
100
MD AVG
43
Rank
#114 / 690 | No |
34
Facility
34
MD AVG
43
Rank
#590 / 985 | Studio / 1 Bed | 13
Facility
13
MD AVG
21
Rank
#142 / 210 | - |
19% Male Residents — State Benchmarked 19% of residents are male, compared to the Maryland average of 31%. This facility caters to a majority female resident pool (81% female), consistent with the broader assisted living trend where women significantly outnumber men. |
81% Female Residents — State Benchmarked 81% of residents are female, compared to the Maryland average of 69%. Women comprise the large majority, consistent with national assisted living demographics where women live longer and enter care facilities at higher rates. |
91% White Residents — State Benchmarked 91% of residents are reported as White, compared to the Maryland average of 81%. A higher White share than is typical for assisted living in Maryland in this dataset — compare with peer facilities for local context. |
2% African American Residents — State Benchmarked 2% of residents are reported as African American or Black, compared to the Maryland average of 13%. A lower African American share than is typical in Maryland; local markets still vary widely. |
7% Other Ethnicity Residents — State Benchmarked 7% of residents fall into categories other than White or African American (combined), compared to the Maryland average of 6%. This column aggregates Hispanic, Asian, multiracial, and any other labeled groups that are not classified as White or African American. Reported subgroups in this total: Asian (5%), Other (2%). |
2% Residents Age 65–74 — State Benchmarked 2% of residents are 65–74, compared to the Maryland average of 13%. Fewer younger seniors suggests the resident population skews older, likely requiring higher acuity care and more hands-on support. |
35% Residents Age 75–84 — State Benchmarked 35% of residents are 75–84, compared to the Maryland average of 31%. This is the second most common age bracket in assisted living, representing residents with moderate care needs. |
39% Residents Age 85–94 — State Benchmarked 39% of residents are 85–94, compared to the Maryland average of 44%. This is typically the most common age bracket in assisted living — this facility is in line with the statewide norm. |
19% Residents Age 95+ — State Benchmarked 19% of residents are 95 or older, compared to the Maryland average of 16%. In line with the statewide profile for the oldest resident bracket. |
| The Seneca Rockville | MC AL | Rockville (King Farm) | 156
Facility
156
MD AVG
43
Rank
#36 / 690 | Yes |
45
Facility
45
MD AVG
43
Rank
#475 / 985 | Studio / 1 Bed / 2 Bed | 4
Facility
4
MD AVG
21
Rank
#195 / 210 | - |
32% Male Residents — State Benchmarked 32% of residents are male, compared to the Maryland average of 31%. This facility caters to a majority female resident pool (68% female), consistent with the broader assisted living trend where women significantly outnumber men. |
68% Female Residents — State Benchmarked 68% of residents are female, compared to the Maryland average of 69%. Women comprise the large majority, consistent with national assisted living demographics where women live longer and enter care facilities at higher rates. |
87% White Residents — State Benchmarked 87% of residents are reported as White, compared to the Maryland average of 81%. Close to the average for this category among assisted living facilities in Maryland with reported race/ethnicity data. |
2% African American Residents — State Benchmarked 2% of residents are reported as African American or Black, compared to the Maryland average of 13%. A lower African American share than is typical in Maryland; local markets still vary widely. |
11% Other Ethnicity Residents — State Benchmarked 11% of residents fall into categories other than White or African American (combined), compared to the Maryland average of 6%. This column aggregates Hispanic, Asian, multiracial, and any other labeled groups that are not classified as White or African American. Reported subgroups in this total: Asian (10%), Hispanic (2%). |
8% Residents Age 65–74 — State Benchmarked 8% of residents are 65–74, compared to the Maryland average of 13%. Fewer younger seniors suggests the resident population skews older, likely requiring higher acuity care and more hands-on support. |
34% Residents Age 75–84 — State Benchmarked 34% of residents are 75–84, compared to the Maryland average of 31%. This is the second most common age bracket in assisted living, representing residents with moderate care needs. |
45% Residents Age 85–94 — State Benchmarked 45% of residents are 85–94, compared to the Maryland average of 44%. This is typically the most common age bracket in assisted living — this facility is in line with the statewide norm. |
13% Residents Age 95+ — State Benchmarked 13% of residents are 95 or older, compared to the Maryland average of 16%. In line with the statewide profile for the oldest resident bracket. |
| Landow House | MC AL HC IL NH SNF | Rockville (Rollins Park) | 98
Facility
98
MD AVG
43
Rank
#131 / 690 | Yes |
59
Facility
59
MD AVG
43
Rank
#327 / 985 | 1 Bed / 2 Bed | 31
Facility
31
MD AVG
21
Rank
#39 / 210 | - |
31% Male Residents — State Benchmarked 31% of residents are male, compared to the Maryland average of 31%. This facility caters to a majority female resident pool (69% female), consistent with the broader assisted living trend where women significantly outnumber men. |
69% Female Residents — State Benchmarked 69% of residents are female, compared to the Maryland average of 69%. Women comprise the large majority, consistent with national assisted living demographics where women live longer and enter care facilities at higher rates. |
99% White Residents — State Benchmarked 99% of residents are reported as White, compared to the Maryland average of 81%. A higher White share than is typical for assisted living in Maryland in this dataset — compare with peer facilities for local context. |
0% African American Residents — State Benchmarked 0% of residents are reported as African American or Black, compared to the Maryland average of 13%. A lower African American share than is typical in Maryland; local markets still vary widely. |
1% Other Ethnicity Residents — State Benchmarked 1% of residents fall into categories other than White or African American (combined), compared to the Maryland average of 6%. This column aggregates Hispanic, Asian, multiracial, and any other labeled groups that are not classified as White or African American. Reported subgroups in this total: Asian (1%). |
7% Residents Age 65–74 — State Benchmarked 7% of residents are 65–74, compared to the Maryland average of 13%. Fewer younger seniors suggests the resident population skews older, likely requiring higher acuity care and more hands-on support. |
20% Residents Age 75–84 — State Benchmarked 20% of residents are 75–84, compared to the Maryland average of 31%. Below the state norm — the resident mix may skew either younger or older than this typical middle bracket. |
49% Residents Age 85–94 — State Benchmarked 49% of residents are 85–94, compared to the Maryland average of 44%. A high concentration of very elderly residents signals a higher-acuity facility with experience caring for advanced age-related needs. |
24% Residents Age 95+ — State Benchmarked 24% of residents are 95 or older, compared to the Maryland average of 16%. A high proportion of the oldest-old suggests strong end-of-life care experience and very-high-acuity capabilities. |
| AlfredHouse Symphony | MC AL HOS RC | Derwood | 34
Facility
34
MD AVG
43
Rank
#242 / 690 | No |
6
Facility
6
MD AVG
43
Rank
#891 / 985 | Private Rooms | 9
Facility
9
MD AVG
21
Rank
#161 / 210 | - |
40% Male Residents — State Benchmarked 40% of residents are male, compared to the Maryland average of 31%. A relatively balanced gender mix for assisted living, where facilities typically skew heavily female. |
60% Female Residents — State Benchmarked 60% of residents are female, compared to the Maryland average of 69%. Closer to an even gender split than most assisted living facilities, which typically have 65–75% female residents. |
84% White Residents — State Benchmarked 84% of residents are reported as White, compared to the Maryland average of 81%. Close to the average for this category among assisted living facilities in Maryland with reported race/ethnicity data. |
16% African American Residents — State Benchmarked 16% of residents are reported as African American or Black, compared to the Maryland average of 13%. In line with the Maryland average for African American residents among facilities reporting this breakdown. |
0% Other Ethnicity Residents — State Benchmarked 0% of residents fall into categories other than White or African American (combined), compared to the Maryland average of 6%. This column aggregates Hispanic, Asian, multiracial, and any other labeled groups that are not classified as White or African American. |
28% Residents Age 65–74 — State Benchmarked 28% of residents are 65–74, compared to the Maryland average of 13%. A higher share of younger seniors often signals a more independent, active resident community with lower acuity care needs. |
32% Residents Age 75–84 — State Benchmarked 32% of residents are 75–84, compared to the Maryland average of 31%. This is the second most common age bracket in assisted living, representing residents with moderate care needs. |
40% Residents Age 85–94 — State Benchmarked 40% of residents are 85–94, compared to the Maryland average of 44%. This is typically the most common age bracket in assisted living — this facility is in line with the statewide norm. | - |
| Cedar Glen Memory Care Home | MC AL | Rockville (Pipestem Court) | 8 Residents | No |
23
Facility
23
MD AVG
43
Rank
#704 / 985 | Private Rooms | - | - | - | - | - | - | - | - | - | - | - |
| Cadence Living Olney | MC AL IL | Olney (Cherry Valley) | - | Yes |
48
Facility
48
MD AVG
43
Rank
#448 / 985 | Studio / 1 Bed | - | - | - | - | - | - | - | - | - | - | - |
| Aberdeen House II | — | Rockville | 8 | — | — | — | — | — | — | — | — | — | — | — | — | — | — |
| Aberdeen House III | — | Rockville | 8 | — | — | — | — | — | — | — | — | — | — | — | — | — | — |
| Absolute Assisted Living | — | Rockville | 5 | — | — | — | — | — | — | — | — | — | — | — | — | — | — |
| AlfredHouse I | — | Rockville | 16 | — | — | — | 34 | — | — | — | — | — | — | — | — | — | — |
| An An Assisted Living II | — | Rockville | 5 | — | — | — | — | — | — | — | — | — | — | — | — | — | — |
| Angels Garden I | — | Rockville | 15 | — | — | — | 20 | — | — | — | — | — | — | — | — | — | — |
| Assisted Living of Rockville IV | — | Rockville | 5 | — | — | — | — | — | — | — | — | — | — | — | — | — | — |
| Best Fortune Senior Care | — | Rockville | 8 | — | — | — | — | — | — | — | — | — | — | — | — | — | — |
| Best Home For Mom and Dad | — | Rockville | 6 | — | — | — | — | — | — | — | — | — | — | — | — | — | — |
| Cedar Creek - Cedar Glen | — | Rockville | 8 | — | — | — | — | — | — | — | — | — | — | — | — | — | — |
| Cedar Creek - Maple Ridge | — | Rockville | 16 | — | — | — | 31 | — | — | — | — | — | — | — | — | — | — |
| JK House of Grace IV | — | Rockville | 4 | — | — | — | — | — | — | — | — | — | — | — | — | — | — |
| Raphael House - East | — | Rockville | 16 | — | — | — | 34 | — | — | — | — | — | — | — | — | — | — |
| Serenity Gardens - Rockville | — | Rockville | 5 | — | — | — | — | — | — | — | — | — | — | — | — | — | — |
Rows per page:

View all Nearby Homes
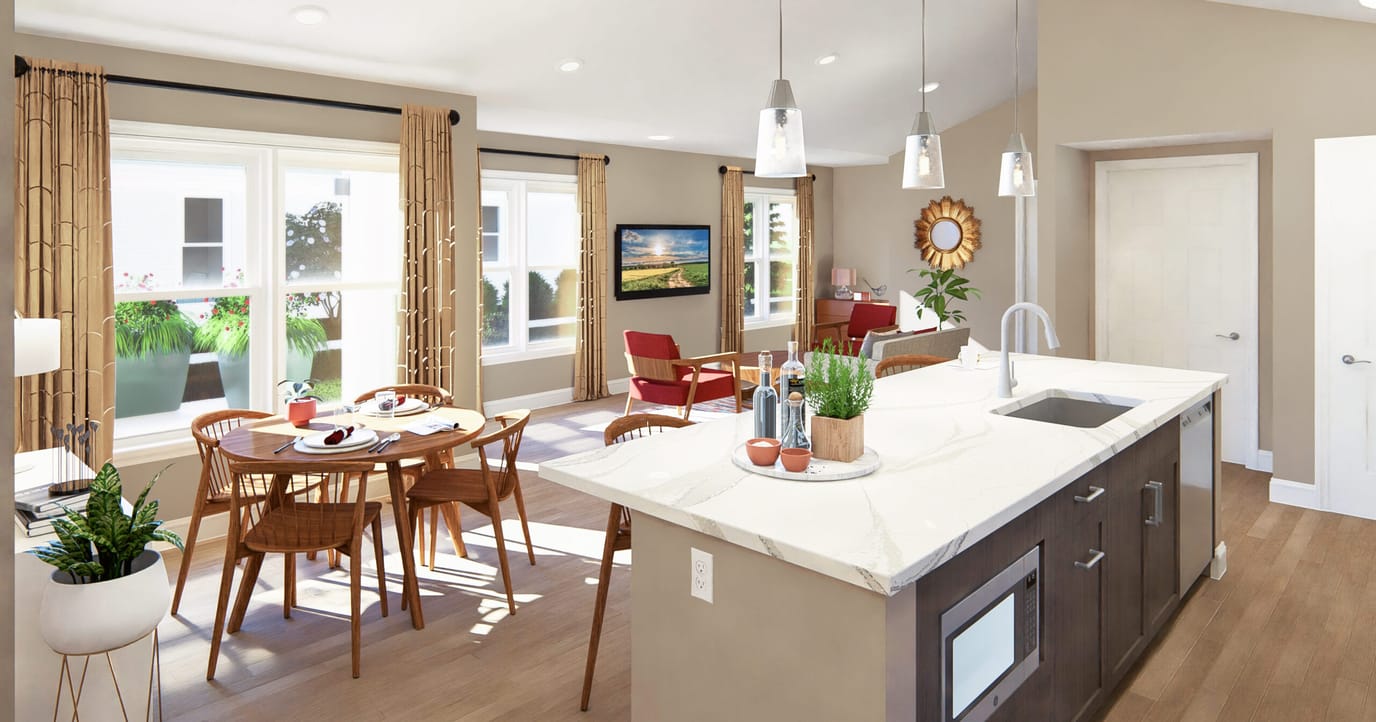
Conveniently located in Rockville, MD, AlfredHouse Andrus is a paradisal senior living community that offers assisted living, memory care, personal care, and respite care. The community features 15 thoughtfully designed accommodations with standard 1:4 caregiver ratio for excellent care services with a touch of personal support. With a focus on helping residents dealing with memory and cognitive challenges, the community provides an array of specialized care services, including BCAT certified memory care, emotional & behavioral support, and Alzheimer’s & dementia care.
The community makes sure residents’ everyday life is as vibrant as possible by offering an array of engaging activities or fitness programs. Residents enjoy delicious and nutritious meals prepared in collaboration with licensed dieticians to ensure they receive the right nourishment. The community designed their community to foster relaxation, leisure, and convenience with cozy reading rooms, gardening spaces, water therapies, salon, and complimentary WiFi.
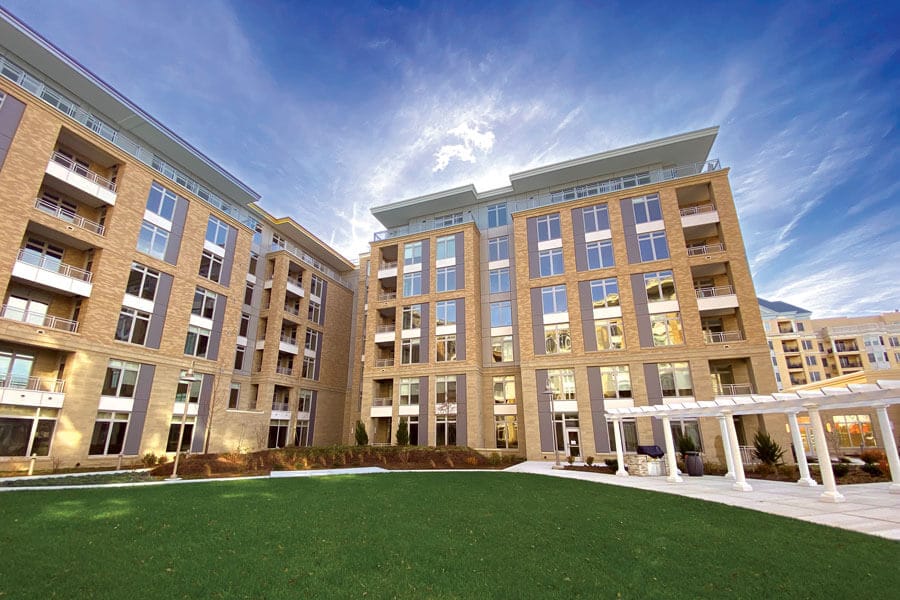
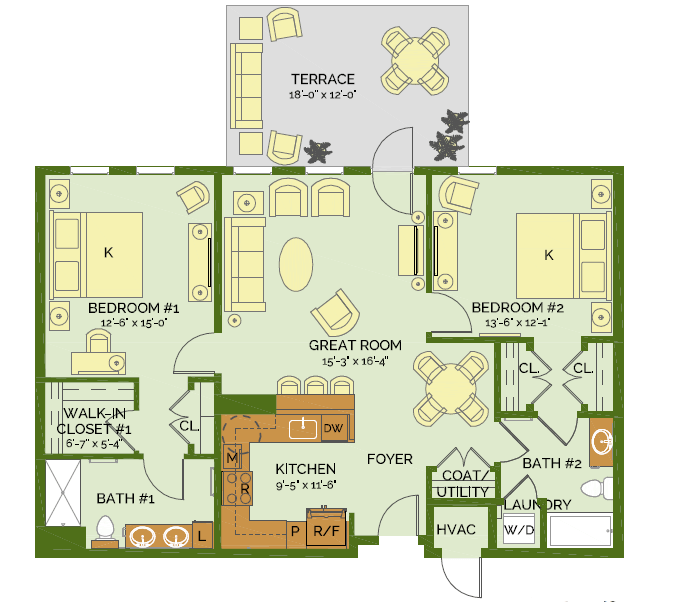
Conveniently located in the harmonious residential area of East Jefferson Street, Rockville, MD, Ring House Independent Living Apartments is a blissful retreat that offers independent living. Featuring cozy and specially designed studio to two-bedroom floor plans, residents are guaranteed to find the accommodation that best matches their preferences. The community also offers round-the-clock concierge to assist residents with their day-to-day activities.
With a carefully curated calendar of fun activities and enriching programs, residents gain meaningful experiences and meet new friends. Therapy services, including physical, occupational, and speech therapy, are also available in the community with its rehab suite. Here, residents retain their independence while doing the things they love, surrounded by the community’s welcoming spaces.
Ingleside at King Farm – Fountainside is a 46-bed assisted living and memory care community located at 701 King Farm Boulevard in Rockville, Maryland. Serving older adults in Montgomery County, the facility operates as a nonprofit community within a continuum-of-care campus that includes skilled nursing, rehabilitation, and home care services.
Nursing hours at this facility are reported above Maryland state averages across several categories. RN hours are 41% above the state average, LPN hours are 15% above, and nurse aide hours are 32% above. Physical therapist hours are reported at three minutes per resident per day, which is below the state average of five minutes. Quality metrics indicate that long-stay residents experience hospitalizations and emergency department visits at rates 37% and 44% below the Maryland average. Short-stay residents show a discharge-to-home rate of 59.8% compared to the state average of 50.6%.
The Maryland Department of Health, Office of Health Care Quality, oversees the inspection of this facility. The community maintains a citations-per-inspection rate of 0.0. Records show that no civil money penalties or payment denials have been imposed by CMS within the past three years.
The community holds CARF accreditation and SAGECare Platinum certification. Specific details regarding on-site dining, daily activities, and monthly pricing are not reported in the available source data, so families should request these details during a tour. Occupancy levels and payment options are also not publicly listed in the current records.
Families seeking nonprofit assisted living or memory care with a focus on nursing staffing levels and quality performance measures may find this setting suitable. Families evaluating Ingleside at King Farm – Fountainside should confirm Medicaid acceptance, current occupancy, and the full inspection history directly with the Maryland Department of Health before making a placement decision.
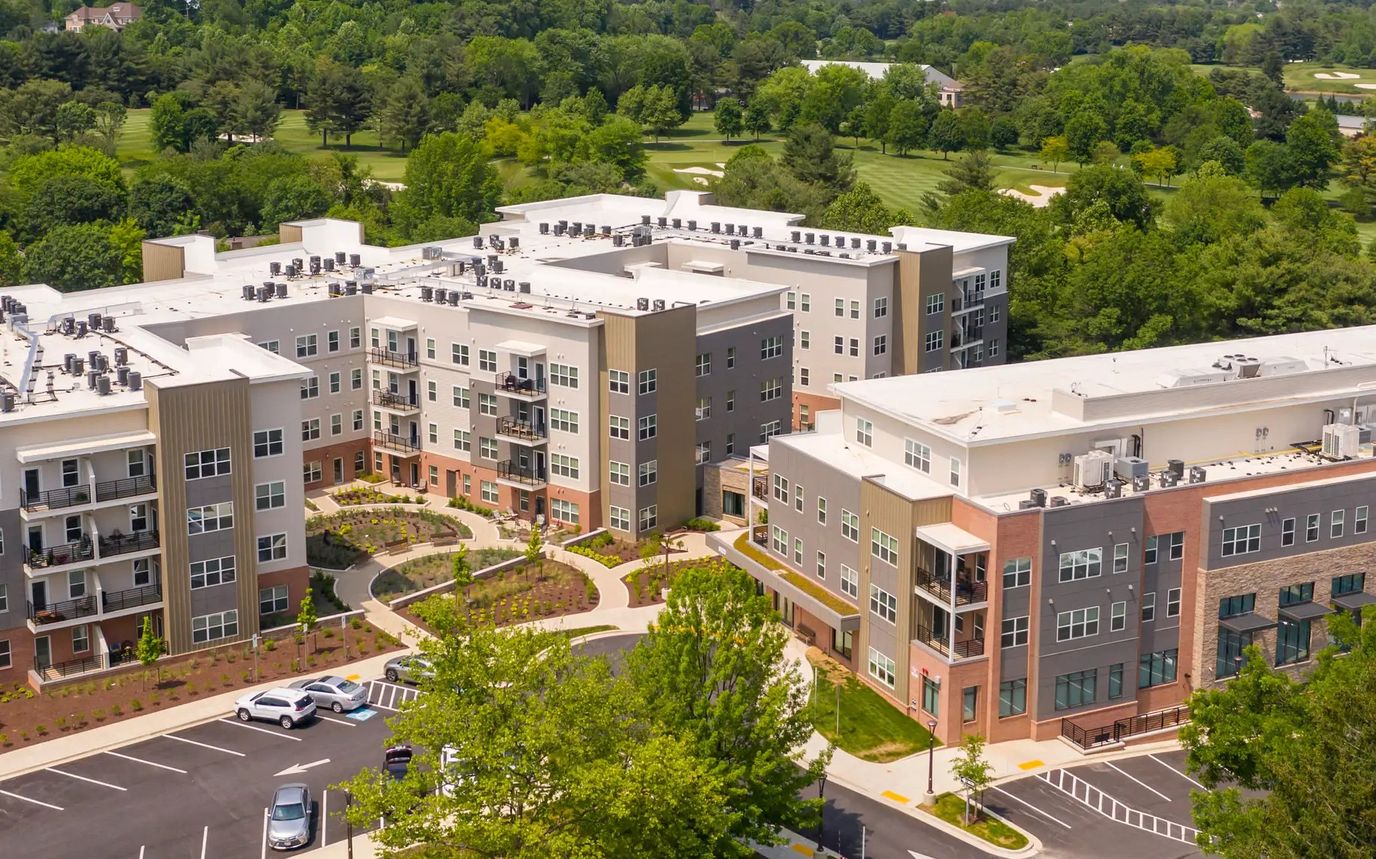
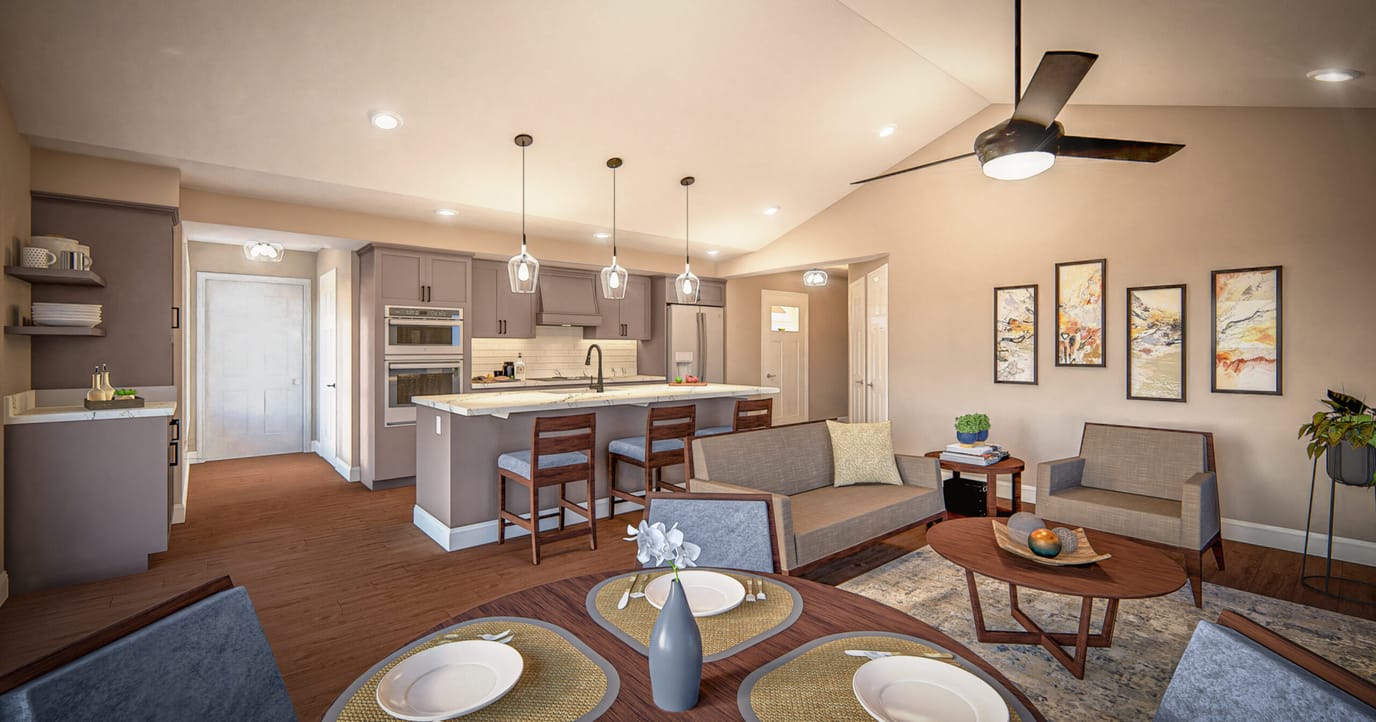
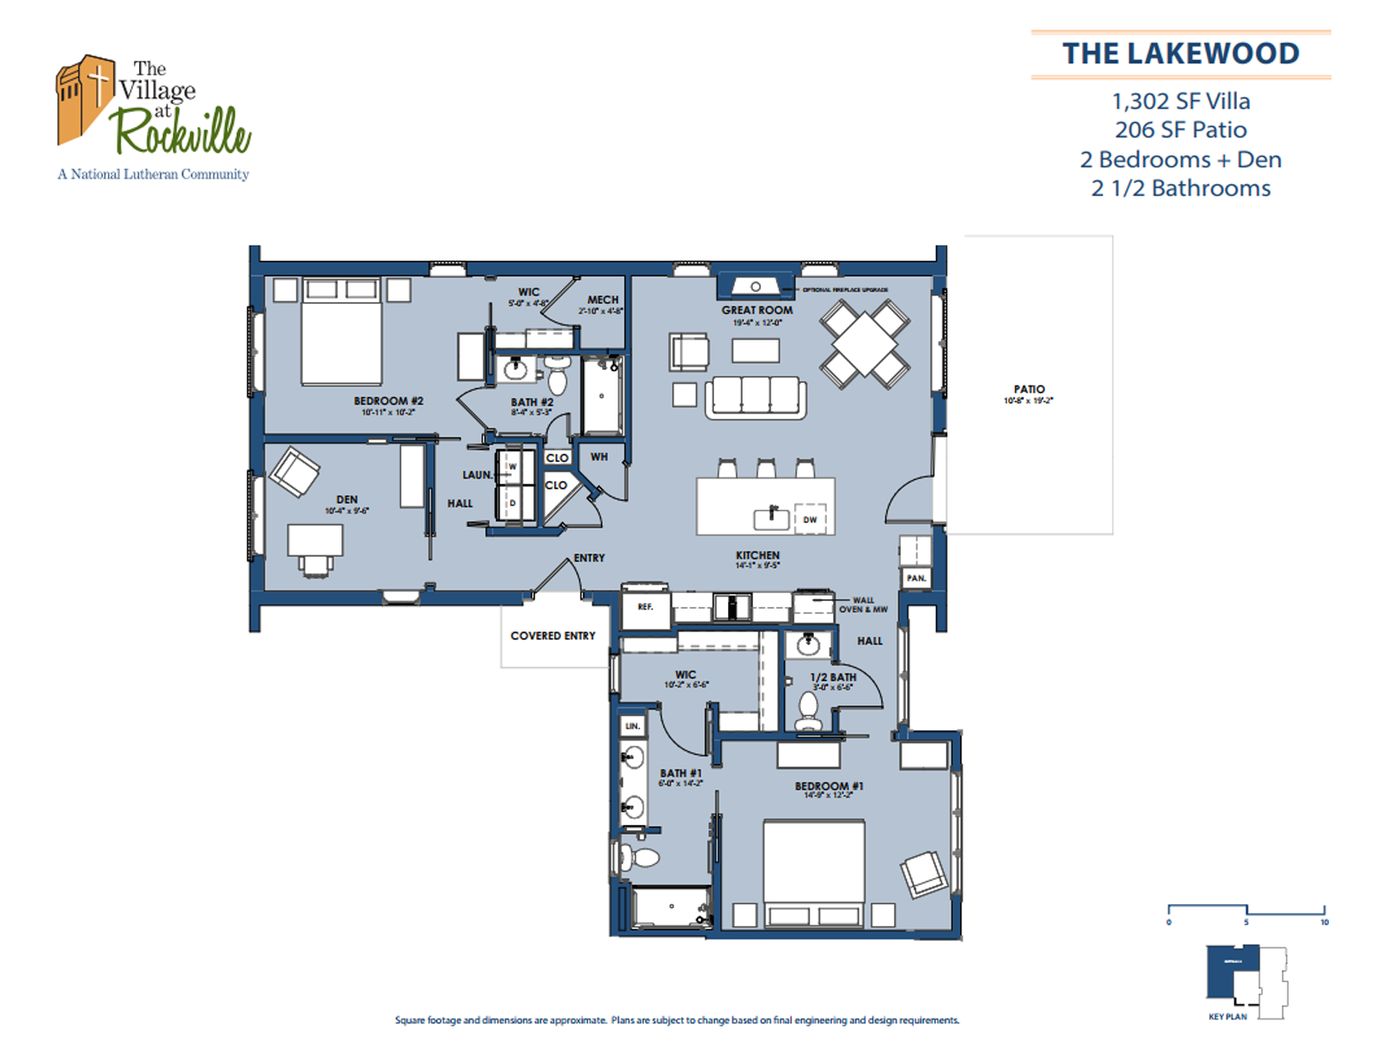
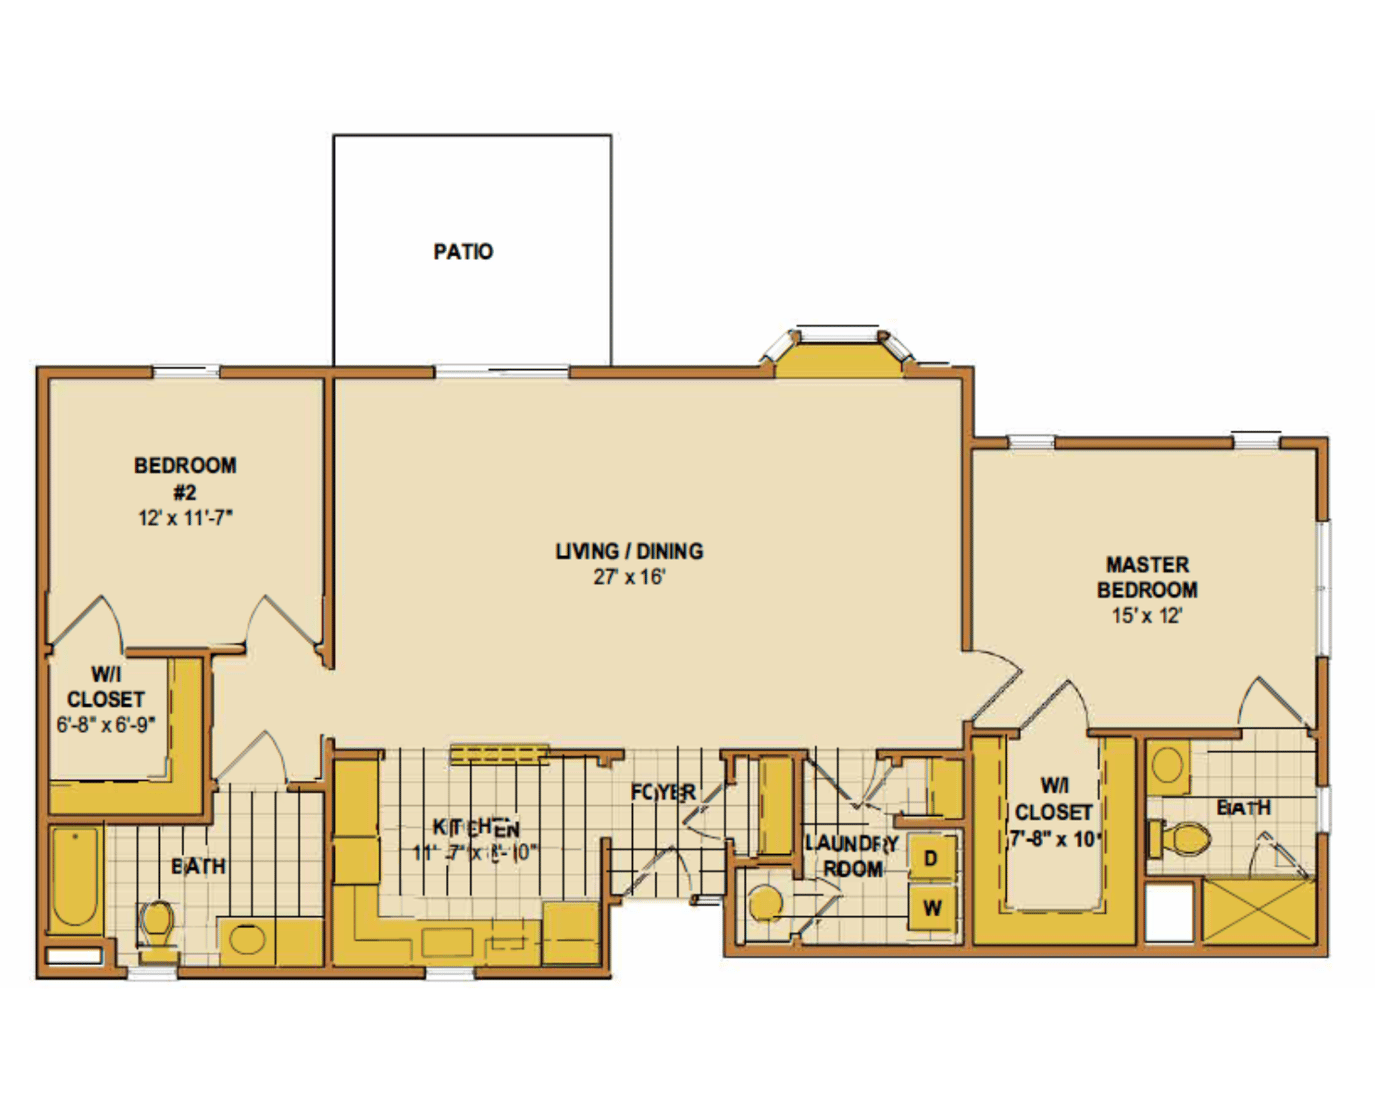
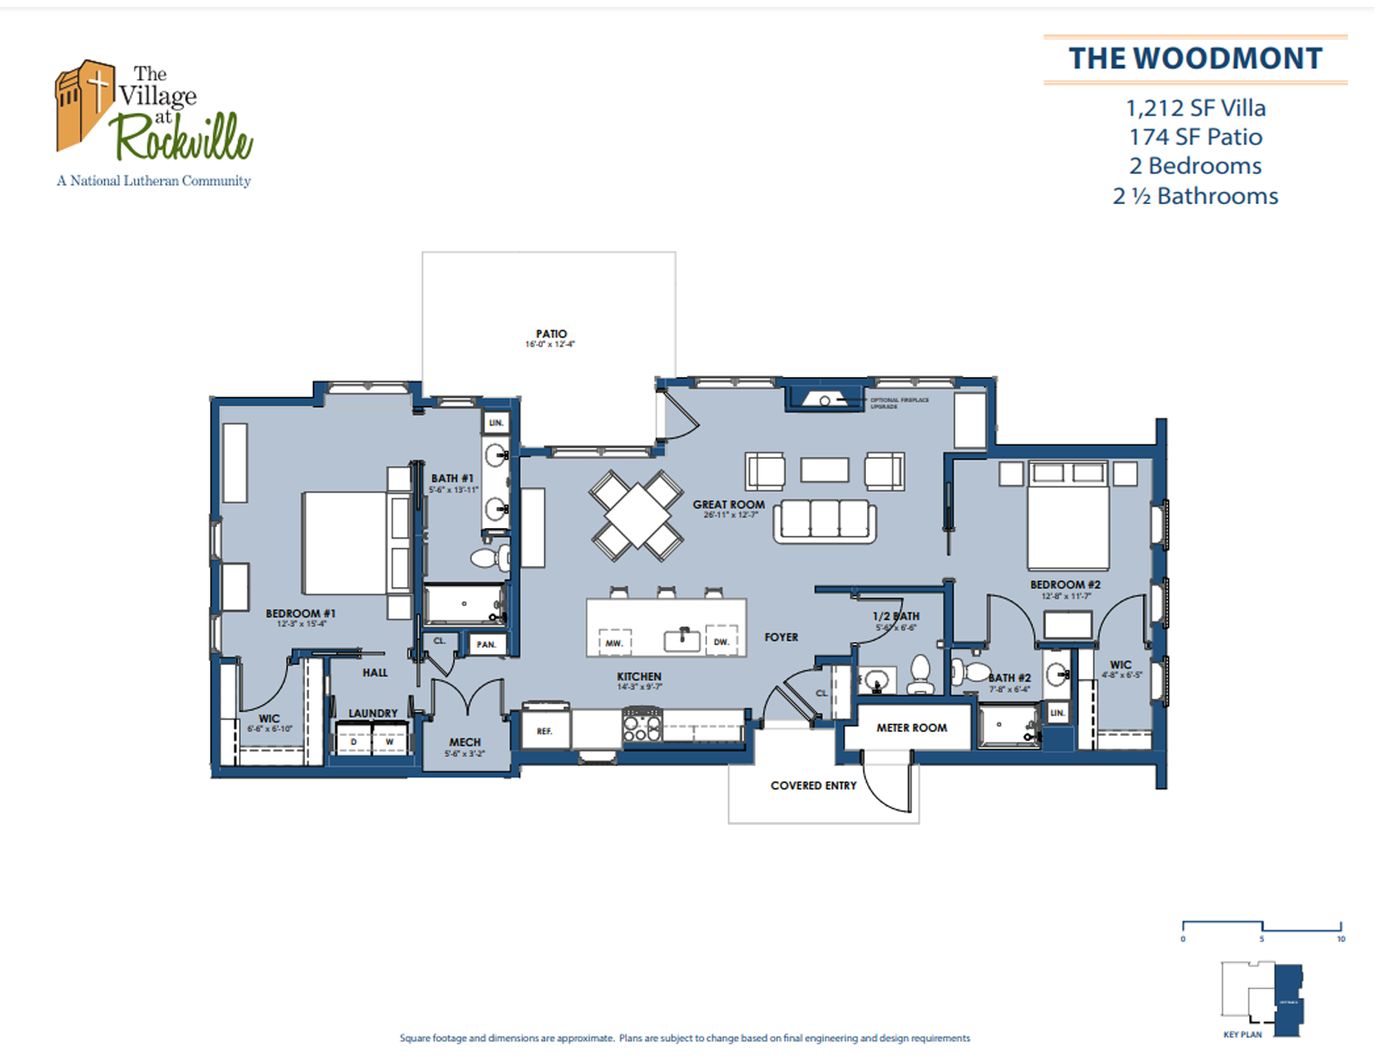
Overview of The Village at Rockville—a National Lutheran Community


The Village at Rockville is the distinguished flagship community of National Lutheran, boasting a legacy spanning over 130 years in partnership with seniors. Nestled within the heart of Montgomery County, this assisted living community has cultivated a reputation as a sanctuary of care and expertise, catering to seniors through its esteemed Life Plan Community situated in Rockville, Maryland.
The Village at Rockville is the distinguished flagship community of National Lutheran, boasting a legacy spanning over 130 years in partnership with seniors. Nestled within the heart of Montgomery County, this assisted living community has cultivated a reputation as a sanctuary of care and expertise, catering to seniors through its esteemed Life Plan Community situated in Rockville, Maryland.
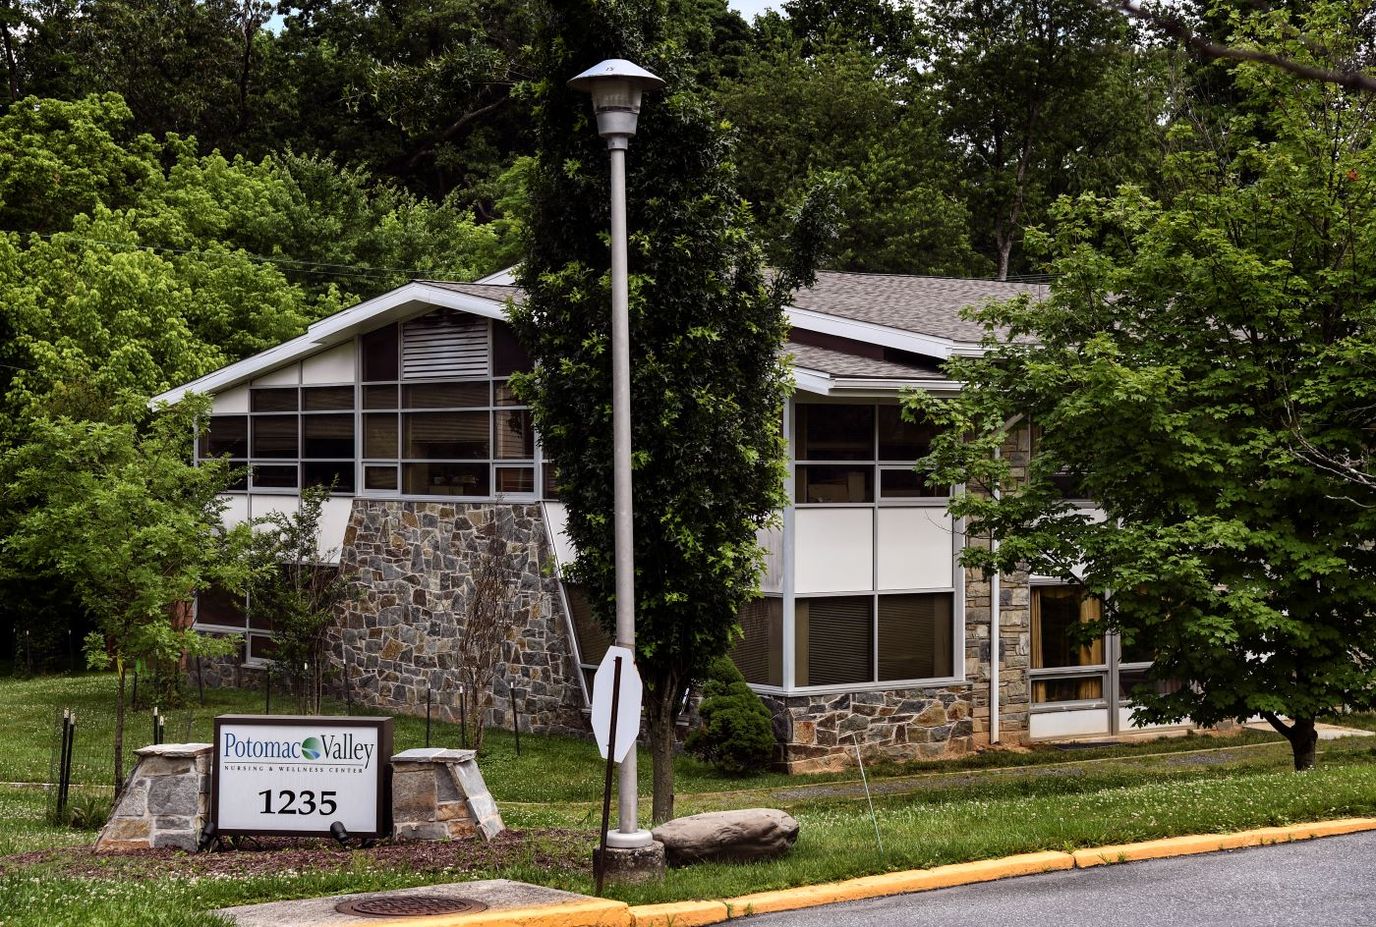
Overview of Potomac Valley Nursing & Wellness

Potomac Valley Nursing & Wellness provides skilled nursing, short-term rehabilitation, memory care, and hospice services in Rockville, Maryland. The clinical department utilizes structured therapy frameworks like the LifeWorks Rehab and HeartWorks Recovery programs to help patients regain mobility following surgeries or major medical diagnoses. On-site care teams include registered nurses, licensed practical nurses, physical therapists, and certified nursing assistants.
The surrounding Rockville neighborhood carries a walkability score of 46 out of 100, showing a mostly car-dependent setup where you will typically need a vehicle for standard errands. State health department audits show that the facility has a citations-per-inspection rate that is not zero, with past regulatory reports noting required adjustments for infection prevention and behavioral health services. For payment options, the home accepts both Medicare and Medicaid alongside private funding.
Prospective residents or family members interested in examining the layout can tour the facility Monday through Saturday from 9:00 a.m. to 5:00 p.m., or contact the admissions department directly to check on bed availability.
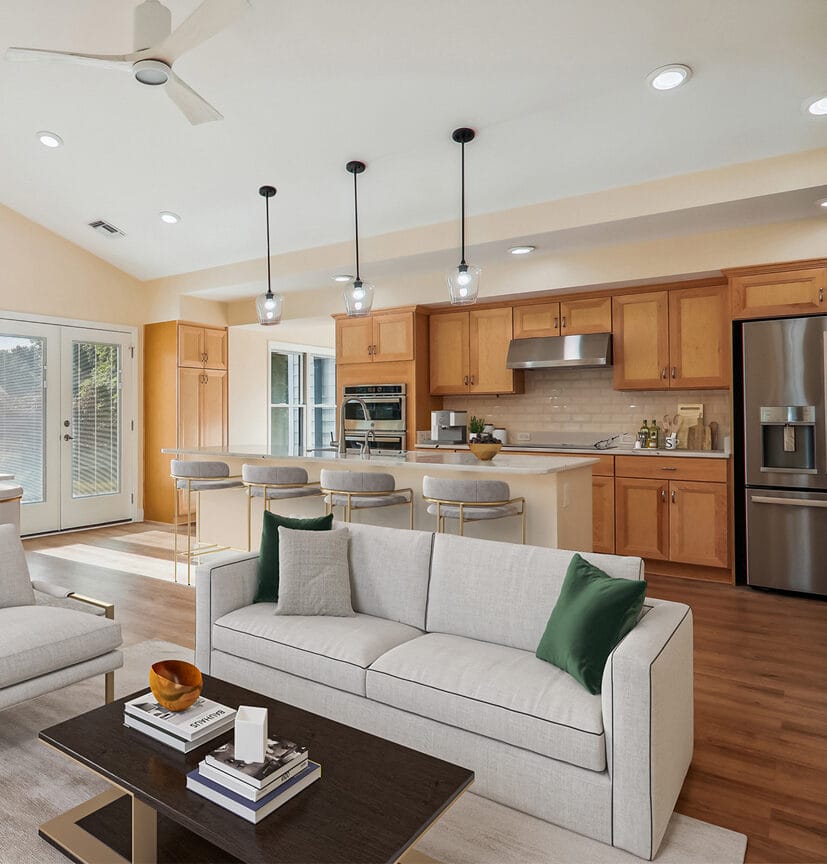
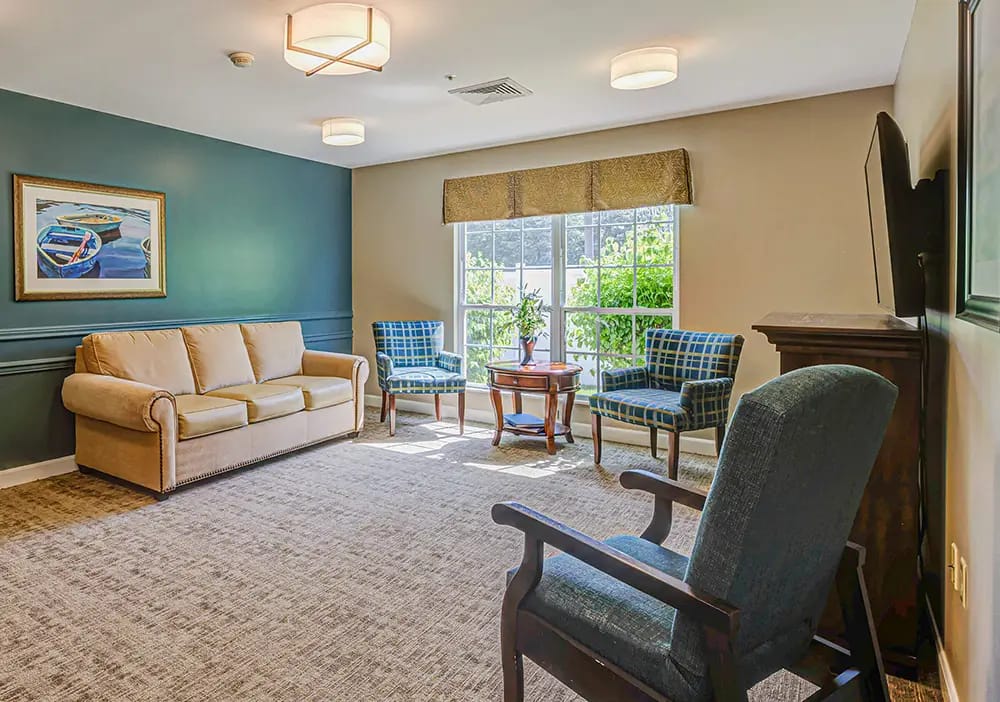
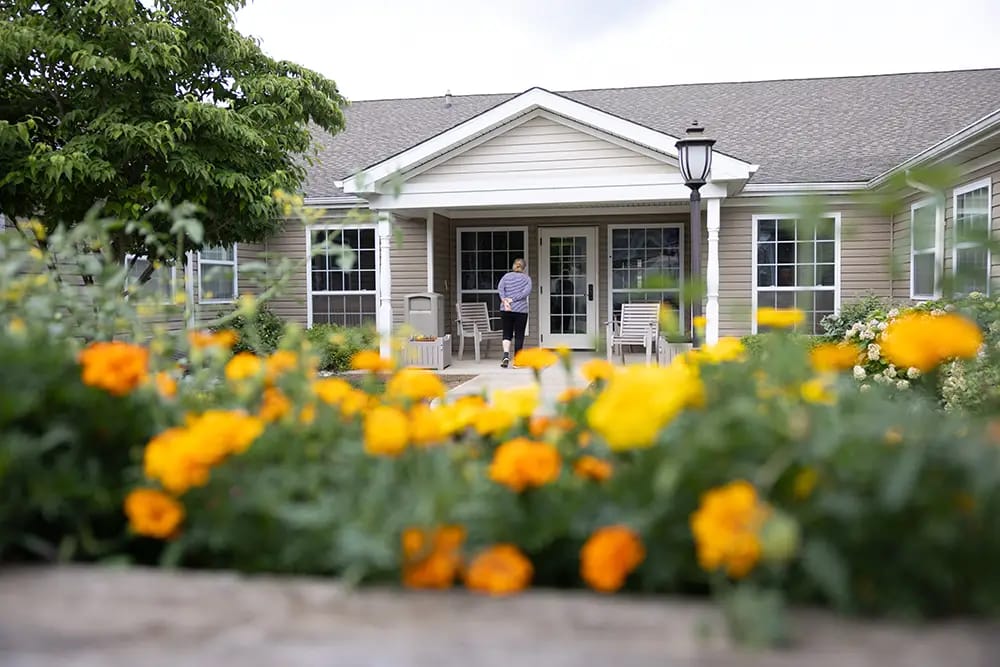
Arden Courts Memory Care Community on Knowles Avenue in Kensington is a unique assisted living community designed for seniors facing memory loss. With a specialized team of caregivers, Arden Courts is devoted to offering kind care for those dealing with Alzheimer’s and related dementias. The community features cozy shared spaces, well-equipped kitchens, family rooms, and enclosed courtyards with winding pathways, all carefully designed for resident safety and comfort.
Arden Courts is the result of five years of careful research, created not only for safety but also to provide a true sense of home, empowering residents to maintain their independence. In collaboration with families, the community develops personalized care plans that adapt as the resident’s routine or condition changes. Arden Courts Memory Care Community embodies empathy, creating an environment where each individual’s journey is embraced, fostering a haven of support and warmth.
Ranking Methodology
How we rank these memory care communities
Every community above is evaluated across six weighted categories using public data including state inspection records, review platforms, BBB profiles, and operator-published materials.
Weighting overview
- 35%Resident Experience
- 25%Regulatory
- 15%Visual Media
- 10%Website
- 10%Stability
- 5%Environment
01
Resident & Family Experience 35%
The single largest share of every ranking. Aggregated review sentiment and volume from major platforms — the closest signal to real resident experience.
- Includes
- Review Sentiment
- Review Volume
02
Regulatory & Safety Record 25%
State inspection records, citations, and complaint visits. We weight per-inspection rates more heavily than raw counts.
- Includes
- State Inspections
- Citations/Inspection
- % Inspections w/ Citations
- Complaint Visits
- Accreditations
- BBB Rating
03
Visual Media & Transparency 15%
Communities that publish high-quality visuals give families a real preview. No photos or tours = a negative transparency signal.
- Includes
- Video Tours
- Virtual Walkthroughs
- Photo Quantity
- Photo Quality
04
Website & Operator Transparency 10%
Site quality and whether the operator publishes basic accountability information — staff names, contact details, ownership.
- Includes
- Website Content
- Mobile Usability
- Staff Info Available
- Owner Info Available
05
Community Stability 10%
Operational signals indicating whether a community is well-run and meeting demand.
- Includes
- Occupancy Rate
- Bed Options
06
Environment & Pricing 5%
Walkability and pricing transparency. Walk Score is weighted higher for Independent Living than for Memory Care, where most residents do not leave unaccompanied.
- Includes
- Walk Score
- Pricing Transparency
Who we are
Your Senior Care Partner, Every Step of the Way
We help families find affordable senior communities and unlock same day discounts, Medicaid, and Medicare options tailored to your needs.
Contact us Today
Frequently Asked Questions about Memory Care in Rockville, MD
What is the average cost of memory care in Rockville, MD?
The average monthly cost of memory care in Rockville, MD is approximately $5,500. Actual rates vary by community, level of care, and floorplan.
What is the price range for memory care in Rockville, MD?
Memory care in Rockville, MD typically ranges from $4,500–$7,000 per month, depending on the community, room type, and care needs.
What is the typical staff-to-resident ratio at memory care communities in Rockville, MD?
Memory care communities in Rockville, MD typically operate with a staff-to-resident ratio in the range of 1:5–1:8.
What's the difference between assisted living and memory care in Maryland?
Assisted living in Maryland supports residents with daily activities (bathing, dressing, medication management) while preserving independence. Memory care is a specialized form of assisted living for residents living with Alzheimer's or dementia, and adds 24/7 secured environments, dementia-trained staff, and structured routines designed to reduce confusion and wandering.
Does Maryland Medicaid cover memory care?
Maryland Medicaid does not directly pay room-and-board for memory care, but most states (including Maryland) offer Home and Community-Based Services (HCBS) waivers that can offset the cost of care services delivered inside a licensed community. Eligibility, waitlists, and covered services vary — check directly with the state Medicaid agency.
What is memory care?
Memory care is a specialized form of assisted living for residents living with Alzheimer's disease or other forms of dementia, with secured environments, dementia-trained staff, and routines built to reduce confusion and wandering.
How many memory care communities are listed on this page?
This page features 26 memory care communities in Rockville, MD. Use the filters and comparison tools above to compare ratings, amenities, and pricing.
Updated on
