


Compare Memory Care around Rockville
The information below is reported by the Maryland Department of Health, Office of Health Care Quality.
| Ingleside at King Farm | MC AL IL NH SNF | Rockville (King Farm) | 45
Facility
45
MD AVG
43
Rank
#226 / 690 | Yes |
73
Facility
73
MD AVG
43
Rank
#152 / 985 | 1 Bed / 2 Bed | - | - | - | - | - | - | - | - | - | - | - |
| Revitz House | MC AL HC IL NH SNF | Rockville | 558
Facility
558
MD AVG
43
Rank
#1 / 690 | Yes |
81
Facility
81
MD AVG
43
Rank
#86 / 985 | 1 Bed | - | - | - | - | - | - | - | - | - | - | - |
| Autumn Lake Healthcare at Oak Manor | MC NH PC RC SNF | Burtonsville (Perrywood Estates) | 145
Facility
145
MD AVG
43
Rank
#46 / 690 | No |
18
Facility
18
MD AVG
43
Rank
#756 / 985 | - | - | - | - | - | - | - | - | - | - | - | - |
| Village at Rockville | MC AL HC IL NH RC SNF | Rockville | 57
Facility
57
MD AVG
43
Rank
#208 / 690 | No |
94
Facility
94
MD AVG
43
Rank
#9 / 985 | - | 13
Facility
13
MD AVG
21
Rank
#142 / 210 | - | - | - | - | - | - | - | - | - | - |
| Collingswood Rehabilitation & Healthcare Center | MC HOS NH PC RC SNF | Rockville (Hurley Avenue) | 160
Facility
160
MD AVG
43
Rank
#27 / 690 | No |
43
Facility
43
MD AVG
43
Rank
#495 / 985 | - | - | A+ | - | - | - | - | - | - | - | - | - |
| Sunrise of Rockville | MC AL HOS | Rockville (Baltimore Road) | 89
Facility
89
MD AVG
43
Rank
#155 / 690 | Yes |
89
Facility
89
MD AVG
43
Rank
#32 / 985 | Studio / 1 Bed / 2 Bed | 45
Facility
45
MD AVG
21
Rank
#4 / 210 | A- |
23% Male Residents — State Benchmarked 23% of residents are male, compared to the Maryland average of 31%. This facility caters to a majority female resident pool (77% female), consistent with the broader assisted living trend where women significantly outnumber men. |
77% Female Residents — State Benchmarked 77% of residents are female, compared to the Maryland average of 69%. Women comprise the large majority, consistent with national assisted living demographics where women live longer and enter care facilities at higher rates. |
87% White Residents — State Benchmarked 87% of residents are reported as White, compared to the Maryland average of 81%. Close to the average for this category among assisted living facilities in Maryland with reported race/ethnicity data. |
2% African American Residents — State Benchmarked 2% of residents are reported as African American or Black, compared to the Maryland average of 13%. A lower African American share than is typical in Maryland; local markets still vary widely. |
11% Other Ethnicity Residents — State Benchmarked 11% of residents fall into categories other than White or African American (combined), compared to the Maryland average of 6%. This column aggregates Hispanic, Asian, multiracial, and any other labeled groups that are not classified as White or African American. Reported subgroups in this total: Mixed Race (6%), Hispanic (3%), Asian (2%). |
3% Residents Age 65–74 — State Benchmarked 3% of residents are 65–74, compared to the Maryland average of 13%. Fewer younger seniors suggests the resident population skews older, likely requiring higher acuity care and more hands-on support. |
31% Residents Age 75–84 — State Benchmarked 31% of residents are 75–84, compared to the Maryland average of 31%. This is the second most common age bracket in assisted living, representing residents with moderate care needs. |
56% Residents Age 85–94 — State Benchmarked 56% of residents are 85–94, compared to the Maryland average of 44%. A high concentration of very elderly residents signals a higher-acuity facility with experience caring for advanced age-related needs. |
10% Residents Age 95+ — State Benchmarked 10% of residents are 95 or older, compared to the Maryland average of 16%. Most residents here have not yet reached the oldest-old bracket, suggesting a younger overall community. |
| AlfredHouse V | MC AL RC | Rockville | 16
Facility
16
MD AVG
43
Rank
#253 / 690 | No |
12
Facility
12
MD AVG
43
Rank
#802 / 985 | Private Rooms | 33
Facility
33
MD AVG
21
Rank
#25 / 210 | A+ |
33% Male Residents — State Benchmarked 33% of residents are male, compared to the Maryland average of 31%. This facility caters to a majority female resident pool (67% female), consistent with the broader assisted living trend where women significantly outnumber men. |
67% Female Residents — State Benchmarked 67% of residents are female, compared to the Maryland average of 69%. Women comprise the large majority, consistent with national assisted living demographics where women live longer and enter care facilities at higher rates. |
92% White Residents — State Benchmarked 92% of residents are reported as White, compared to the Maryland average of 81%. A higher White share than is typical for assisted living in Maryland in this dataset — compare with peer facilities for local context. |
8% African American Residents — State Benchmarked 8% of residents are reported as African American or Black, compared to the Maryland average of 13%. In line with the Maryland average for African American residents among facilities reporting this breakdown. |
0% Other Ethnicity Residents — State Benchmarked 0% of residents fall into categories other than White or African American (combined), compared to the Maryland average of 6%. This column aggregates Hispanic, Asian, multiracial, and any other labeled groups that are not classified as White or African American. | - |
58% Residents Age 75–84 — State Benchmarked 58% of residents are 75–84, compared to the Maryland average of 31%. A high concentration in this mid-range bracket, where residents typically need moderate support with daily activities. |
42% Residents Age 85–94 — State Benchmarked 42% of residents are 85–94, compared to the Maryland average of 44%. This is typically the most common age bracket in assisted living — this facility is in line with the statewide norm. | - |
| Arbor Place Dementia Care | MC HOS | Rockville (Muncaster Mill Road) | 16
Facility
16
MD AVG
43
Rank
#253 / 690 | No |
26
Facility
26
MD AVG
43
Rank
#677 / 985 | Private Rooms | 28
Facility
28
MD AVG
21
Rank
#53 / 210 | - |
19% Male Residents — State Benchmarked 19% of residents are male, compared to the Maryland average of 31%. This facility caters to a majority female resident pool (81% female), consistent with the broader assisted living trend where women significantly outnumber men. |
81% Female Residents — State Benchmarked 81% of residents are female, compared to the Maryland average of 69%. Women comprise the large majority, consistent with national assisted living demographics where women live longer and enter care facilities at higher rates. |
100% White Residents — State Benchmarked 100% of residents are reported as White, compared to the Maryland average of 81%. A higher White share than is typical for assisted living in Maryland in this dataset — compare with peer facilities for local context. |
0% African American Residents — State Benchmarked 0% of residents are reported as African American or Black, compared to the Maryland average of 13%. A lower African American share than is typical in Maryland; local markets still vary widely. |
0% Other Ethnicity Residents — State Benchmarked 0% of residents fall into categories other than White or African American (combined), compared to the Maryland average of 6%. This column aggregates Hispanic, Asian, multiracial, and any other labeled groups that are not classified as White or African American. |
6% Residents Age 65–74 — State Benchmarked 6% of residents are 65–74, compared to the Maryland average of 13%. Fewer younger seniors suggests the resident population skews older, likely requiring higher acuity care and more hands-on support. |
25% Residents Age 75–84 — State Benchmarked 25% of residents are 75–84, compared to the Maryland average of 31%. Below the state norm — the resident mix may skew either younger or older than this typical middle bracket. |
19% Residents Age 85–94 — State Benchmarked 19% of residents are 85–94, compared to the Maryland average of 44%. The population here skews younger than the statewide norm, which may indicate a more active, lower-acuity community. |
44% Residents Age 95+ — State Benchmarked 44% of residents are 95 or older, compared to the Maryland average of 16%. A high proportion of the oldest-old suggests strong end-of-life care experience and very-high-acuity capabilities. |
| Brightview West End | MC AL IL | Rockville | 98
Facility
98
MD AVG
43
Rank
#131 / 690 | Yes |
89
Facility
89
MD AVG
43
Rank
#32 / 985 | Studio / 1 Bed / 2 Bed | 8
Facility
8
MD AVG
21
Rank
#164 / 210 | - |
32% Male Residents — State Benchmarked 32% of residents are male, compared to the Maryland average of 31%. This facility caters to a majority female resident pool (68% female), consistent with the broader assisted living trend where women significantly outnumber men. |
68% Female Residents — State Benchmarked 68% of residents are female, compared to the Maryland average of 69%. Women comprise the large majority, consistent with national assisted living demographics where women live longer and enter care facilities at higher rates. |
84% White Residents — State Benchmarked 84% of residents are reported as White, compared to the Maryland average of 81%. Close to the average for this category among assisted living facilities in Maryland with reported race/ethnicity data. |
4% African American Residents — State Benchmarked 4% of residents are reported as African American or Black, compared to the Maryland average of 13%. A lower African American share than is typical in Maryland; local markets still vary widely. |
12% Other Ethnicity Residents — State Benchmarked 12% of residents fall into categories other than White or African American (combined), compared to the Maryland average of 6%. This column aggregates Hispanic, Asian, multiracial, and any other labeled groups that are not classified as White or African American. Reported subgroups in this total: Other (5%), Asian (4%), Mixed Race (4%). |
14% Residents Age 65–74 — State Benchmarked 14% of residents are 65–74, compared to the Maryland average of 13%. In line with the statewide profile for this youngest senior bracket in assisted living. |
37% Residents Age 75–84 — State Benchmarked 37% of residents are 75–84, compared to the Maryland average of 31%. A high concentration in this mid-range bracket, where residents typically need moderate support with daily activities. |
33% Residents Age 85–94 — State Benchmarked 33% of residents are 85–94, compared to the Maryland average of 44%. The population here skews younger than the statewide norm, which may indicate a more active, lower-acuity community. |
16% Residents Age 95+ — State Benchmarked 16% of residents are 95 or older, compared to the Maryland average of 16%. In line with the statewide profile for the oldest resident bracket. |
| Brightview Fallsgrove | MC AL | Rockville (Glenora Hills) | 100
Facility
100
MD AVG
43
Rank
#114 / 690 | No |
34
Facility
34
MD AVG
43
Rank
#590 / 985 | Studio / 1 Bed | 13
Facility
13
MD AVG
21
Rank
#142 / 210 | - |
19% Male Residents — State Benchmarked 19% of residents are male, compared to the Maryland average of 31%. This facility caters to a majority female resident pool (81% female), consistent with the broader assisted living trend where women significantly outnumber men. |
81% Female Residents — State Benchmarked 81% of residents are female, compared to the Maryland average of 69%. Women comprise the large majority, consistent with national assisted living demographics where women live longer and enter care facilities at higher rates. |
91% White Residents — State Benchmarked 91% of residents are reported as White, compared to the Maryland average of 81%. A higher White share than is typical for assisted living in Maryland in this dataset — compare with peer facilities for local context. |
2% African American Residents — State Benchmarked 2% of residents are reported as African American or Black, compared to the Maryland average of 13%. A lower African American share than is typical in Maryland; local markets still vary widely. |
7% Other Ethnicity Residents — State Benchmarked 7% of residents fall into categories other than White or African American (combined), compared to the Maryland average of 6%. This column aggregates Hispanic, Asian, multiracial, and any other labeled groups that are not classified as White or African American. Reported subgroups in this total: Asian (5%), Other (2%). |
2% Residents Age 65–74 — State Benchmarked 2% of residents are 65–74, compared to the Maryland average of 13%. Fewer younger seniors suggests the resident population skews older, likely requiring higher acuity care and more hands-on support. |
35% Residents Age 75–84 — State Benchmarked 35% of residents are 75–84, compared to the Maryland average of 31%. This is the second most common age bracket in assisted living, representing residents with moderate care needs. |
39% Residents Age 85–94 — State Benchmarked 39% of residents are 85–94, compared to the Maryland average of 44%. This is typically the most common age bracket in assisted living — this facility is in line with the statewide norm. |
19% Residents Age 95+ — State Benchmarked 19% of residents are 95 or older, compared to the Maryland average of 16%. In line with the statewide profile for the oldest resident bracket. |
| The Seneca Rockville | MC AL | Rockville (King Farm) | 156
Facility
156
MD AVG
43
Rank
#36 / 690 | Yes |
45
Facility
45
MD AVG
43
Rank
#475 / 985 | Studio / 1 Bed / 2 Bed | 4
Facility
4
MD AVG
21
Rank
#195 / 210 | - |
32% Male Residents — State Benchmarked 32% of residents are male, compared to the Maryland average of 31%. This facility caters to a majority female resident pool (68% female), consistent with the broader assisted living trend where women significantly outnumber men. |
68% Female Residents — State Benchmarked 68% of residents are female, compared to the Maryland average of 69%. Women comprise the large majority, consistent with national assisted living demographics where women live longer and enter care facilities at higher rates. |
87% White Residents — State Benchmarked 87% of residents are reported as White, compared to the Maryland average of 81%. Close to the average for this category among assisted living facilities in Maryland with reported race/ethnicity data. |
2% African American Residents — State Benchmarked 2% of residents are reported as African American or Black, compared to the Maryland average of 13%. A lower African American share than is typical in Maryland; local markets still vary widely. |
11% Other Ethnicity Residents — State Benchmarked 11% of residents fall into categories other than White or African American (combined), compared to the Maryland average of 6%. This column aggregates Hispanic, Asian, multiracial, and any other labeled groups that are not classified as White or African American. Reported subgroups in this total: Asian (10%), Hispanic (2%). |
8% Residents Age 65–74 — State Benchmarked 8% of residents are 65–74, compared to the Maryland average of 13%. Fewer younger seniors suggests the resident population skews older, likely requiring higher acuity care and more hands-on support. |
34% Residents Age 75–84 — State Benchmarked 34% of residents are 75–84, compared to the Maryland average of 31%. This is the second most common age bracket in assisted living, representing residents with moderate care needs. |
45% Residents Age 85–94 — State Benchmarked 45% of residents are 85–94, compared to the Maryland average of 44%. This is typically the most common age bracket in assisted living — this facility is in line with the statewide norm. |
13% Residents Age 95+ — State Benchmarked 13% of residents are 95 or older, compared to the Maryland average of 16%. In line with the statewide profile for the oldest resident bracket. |
| Landow House | MC AL HC IL NH SNF | Rockville (Rollins Park) | 98
Facility
98
MD AVG
43
Rank
#131 / 690 | Yes |
59
Facility
59
MD AVG
43
Rank
#327 / 985 | 1 Bed / 2 Bed | 31
Facility
31
MD AVG
21
Rank
#39 / 210 | - |
31% Male Residents — State Benchmarked 31% of residents are male, compared to the Maryland average of 31%. This facility caters to a majority female resident pool (69% female), consistent with the broader assisted living trend where women significantly outnumber men. |
69% Female Residents — State Benchmarked 69% of residents are female, compared to the Maryland average of 69%. Women comprise the large majority, consistent with national assisted living demographics where women live longer and enter care facilities at higher rates. |
99% White Residents — State Benchmarked 99% of residents are reported as White, compared to the Maryland average of 81%. A higher White share than is typical for assisted living in Maryland in this dataset — compare with peer facilities for local context. |
0% African American Residents — State Benchmarked 0% of residents are reported as African American or Black, compared to the Maryland average of 13%. A lower African American share than is typical in Maryland; local markets still vary widely. |
1% Other Ethnicity Residents — State Benchmarked 1% of residents fall into categories other than White or African American (combined), compared to the Maryland average of 6%. This column aggregates Hispanic, Asian, multiracial, and any other labeled groups that are not classified as White or African American. Reported subgroups in this total: Asian (1%). |
7% Residents Age 65–74 — State Benchmarked 7% of residents are 65–74, compared to the Maryland average of 13%. Fewer younger seniors suggests the resident population skews older, likely requiring higher acuity care and more hands-on support. |
20% Residents Age 75–84 — State Benchmarked 20% of residents are 75–84, compared to the Maryland average of 31%. Below the state norm — the resident mix may skew either younger or older than this typical middle bracket. |
49% Residents Age 85–94 — State Benchmarked 49% of residents are 85–94, compared to the Maryland average of 44%. A high concentration of very elderly residents signals a higher-acuity facility with experience caring for advanced age-related needs. |
24% Residents Age 95+ — State Benchmarked 24% of residents are 95 or older, compared to the Maryland average of 16%. A high proportion of the oldest-old suggests strong end-of-life care experience and very-high-acuity capabilities. |
| AlfredHouse Symphony | MC AL HOS RC | Derwood | 34
Facility
34
MD AVG
43
Rank
#242 / 690 | No |
6
Facility
6
MD AVG
43
Rank
#891 / 985 | Private Rooms | 9
Facility
9
MD AVG
21
Rank
#161 / 210 | - |
40% Male Residents — State Benchmarked 40% of residents are male, compared to the Maryland average of 31%. A relatively balanced gender mix for assisted living, where facilities typically skew heavily female. |
60% Female Residents — State Benchmarked 60% of residents are female, compared to the Maryland average of 69%. Closer to an even gender split than most assisted living facilities, which typically have 65–75% female residents. |
84% White Residents — State Benchmarked 84% of residents are reported as White, compared to the Maryland average of 81%. Close to the average for this category among assisted living facilities in Maryland with reported race/ethnicity data. |
16% African American Residents — State Benchmarked 16% of residents are reported as African American or Black, compared to the Maryland average of 13%. In line with the Maryland average for African American residents among facilities reporting this breakdown. |
0% Other Ethnicity Residents — State Benchmarked 0% of residents fall into categories other than White or African American (combined), compared to the Maryland average of 6%. This column aggregates Hispanic, Asian, multiracial, and any other labeled groups that are not classified as White or African American. |
28% Residents Age 65–74 — State Benchmarked 28% of residents are 65–74, compared to the Maryland average of 13%. A higher share of younger seniors often signals a more independent, active resident community with lower acuity care needs. |
32% Residents Age 75–84 — State Benchmarked 32% of residents are 75–84, compared to the Maryland average of 31%. This is the second most common age bracket in assisted living, representing residents with moderate care needs. |
40% Residents Age 85–94 — State Benchmarked 40% of residents are 85–94, compared to the Maryland average of 44%. This is typically the most common age bracket in assisted living — this facility is in line with the statewide norm. | - |
| Cedar Glen Memory Care Home | MC AL | Rockville (Pipestem Court) | 8 Residents | No |
23
Facility
23
MD AVG
43
Rank
#704 / 985 | Private Rooms | - | - | - | - | - | - | - | - | - | - | - |
| Cadence Living Olney | MC AL IL | Olney (Cherry Valley) | - | Yes |
48
Facility
48
MD AVG
43
Rank
#448 / 985 | Studio / 1 Bed | - | - | - | - | - | - | - | - | - | - | - |
| Aberdeen House II | — | Rockville | 8 | — | — | — | — | — | — | — | — | — | — | — | — | — | — |
| Aberdeen House III | — | Rockville | 8 | — | — | — | — | — | — | — | — | — | — | — | — | — | — |
| Absolute Assisted Living | — | Rockville | 5 | — | — | — | — | — | — | — | — | — | — | — | — | — | — |
| AlfredHouse I | — | Rockville | 16 | — | — | — | 34 | — | — | — | — | — | — | — | — | — | — |
| An An Assisted Living II | — | Rockville | 5 | — | — | — | — | — | — | — | — | — | — | — | — | — | — |
| Angels Garden I | — | Rockville | 15 | — | — | — | 20 | — | — | — | — | — | — | — | — | — | — |
| Assisted Living of Rockville IV | — | Rockville | 5 | — | — | — | — | — | — | — | — | — | — | — | — | — | — |
| Best Fortune Senior Care | — | Rockville | 8 | — | — | — | — | — | — | — | — | — | — | — | — | — | — |
| Best Home For Mom and Dad | — | Rockville | 6 | — | — | — | — | — | — | — | — | — | — | — | — | — | — |
| Cedar Creek - Cedar Glen | — | Rockville | 8 | — | — | — | — | — | — | — | — | — | — | — | — | — | — |
| Cedar Creek - Maple Ridge | — | Rockville | 16 | — | — | — | 31 | — | — | — | — | — | — | — | — | — | — |
| JK House of Grace IV | — | Rockville | 4 | — | — | — | — | — | — | — | — | — | — | — | — | — | — |
| Raphael House - East | — | Rockville | 16 | — | — | — | 34 | — | — | — | — | — | — | — | — | — | — |
| Serenity Gardens - Rockville | — | Rockville | 5 | — | — | — | — | — | — | — | — | — | — | — | — | — | — |
Rows per page:

View all Nearby Homes
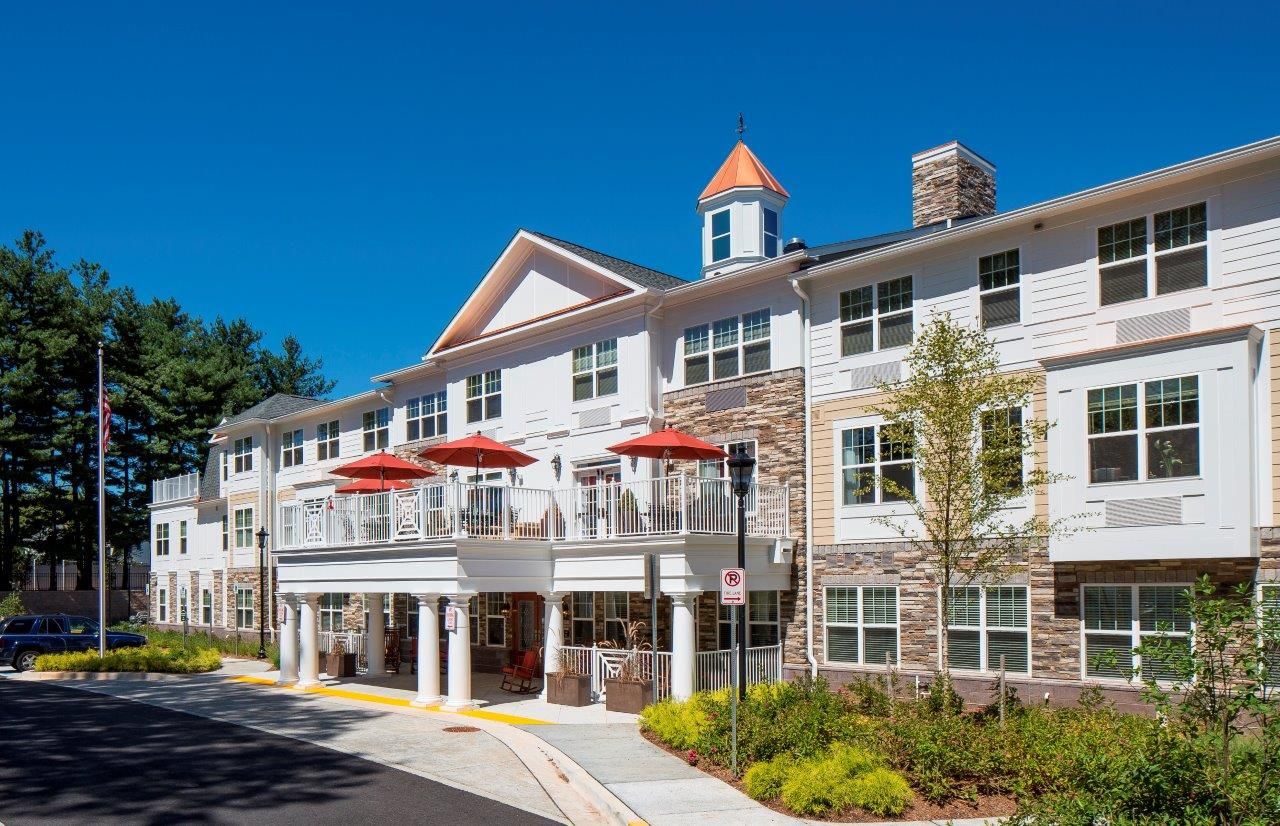
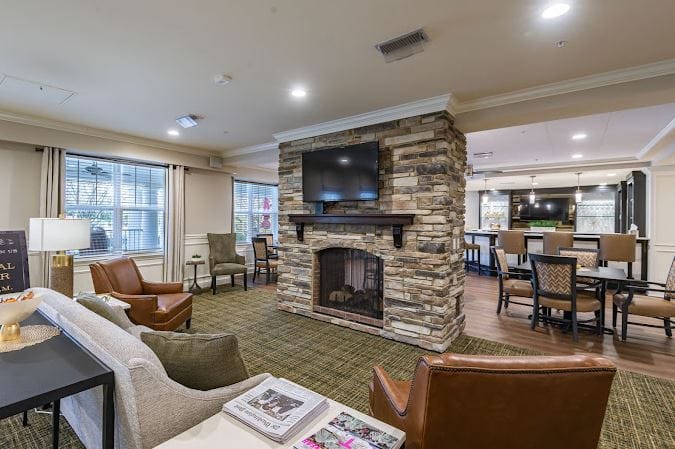
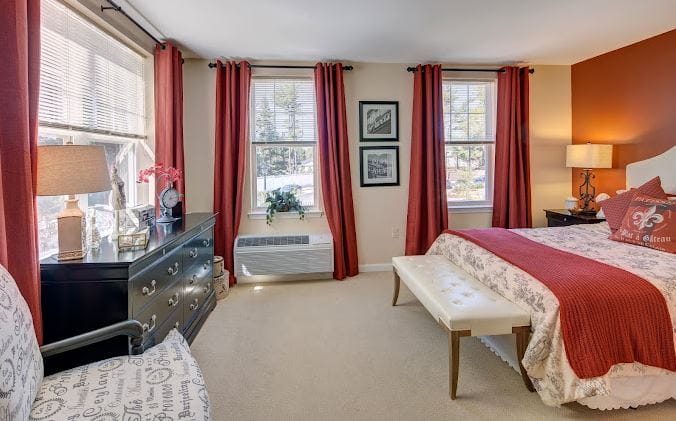
Located within the charming Rockville, Maryland, Brightview Fallsgrove offers a captivating blend of assisted living and memory care services, making it a beacon of exceptional care for seniors. Its enchanting surroundings are adorned with an on-site conservation area, highlighted by the presence of Rockville’s oldest tree, creating a tranquil atmosphere. Serenity beckons with winding walking paths, while the community boasts additional delights such as a cozy Café and a well-stocked library. The calendar brims with a myriad of engaging events, inviting residents to embrace a vibrant and fulfilling lifestyle. Notably, an on-site public art gallery adds an extra touch of cultural enrichment to the community’s offerings.
With a rich history spanning over two decades, Brightview Fallsgrove has become synonymous with trust and expertise in senior living. Its distinguished reputation is a testament to its enduring commitment to providing top-notch amenities and services, each designed to cater to the unique preferences of its cherished residents. From its stunning environment to its thoughtfully curated events and unwavering dedication to seniors’ well-being, Brightview Fallsgrove stands as a true haven of comfort, where every detail is carefully orchestrated to ensure a life enriched with fulfillment.
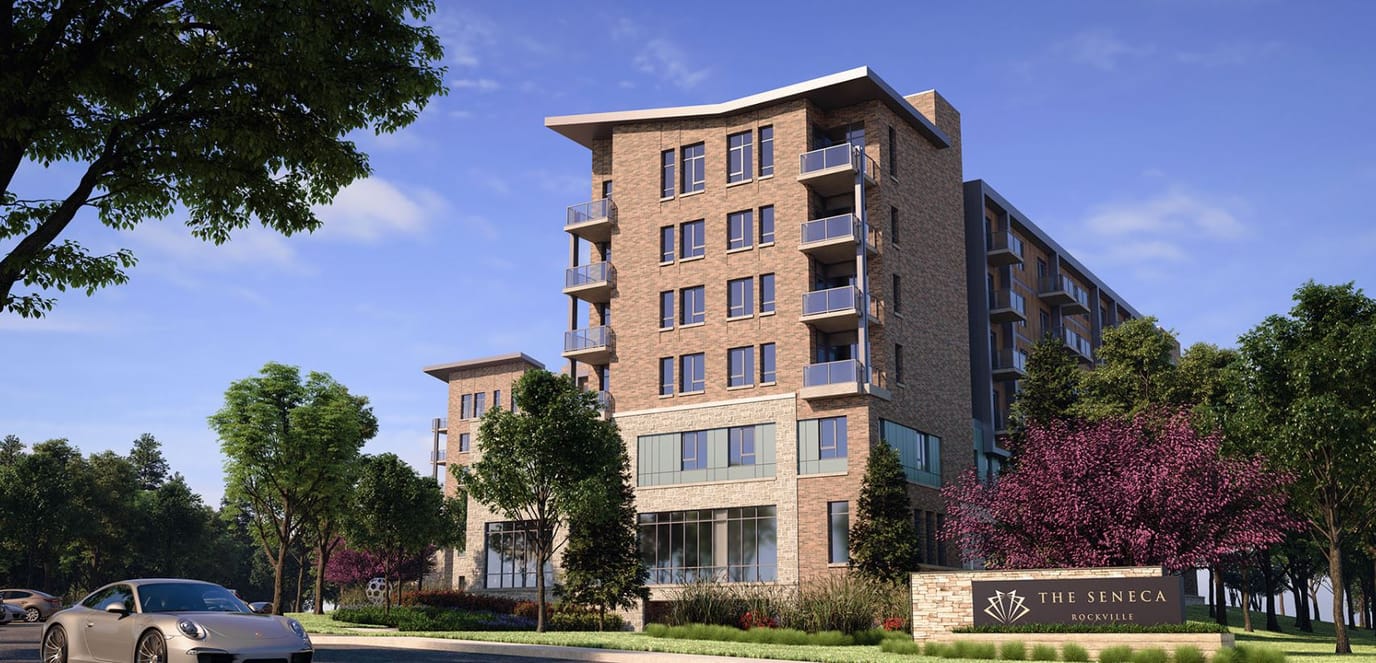
The Seneca Rockville is a lively Assisted Living and Memory Care community that warmly welcomes residents. Conveniently located in the heart of Montgomery County, it’s close to the renowned King Farm community and the tranquil King Farm Stream Valley Park. Nestled beside the serene park, The Seneca offers innovative senior living.
Senior residents get to experience the luxury of a rental community with exceptional hospitality. With a perfect balance of personalized support, residents can choose from Assisted Living, Bridge Program, or Memory Care living options. Every facet is meticulously designed to foster thriving, tailor-made for each individual. This assisted living community also offers expert-led programs, local culture, and personalized care.
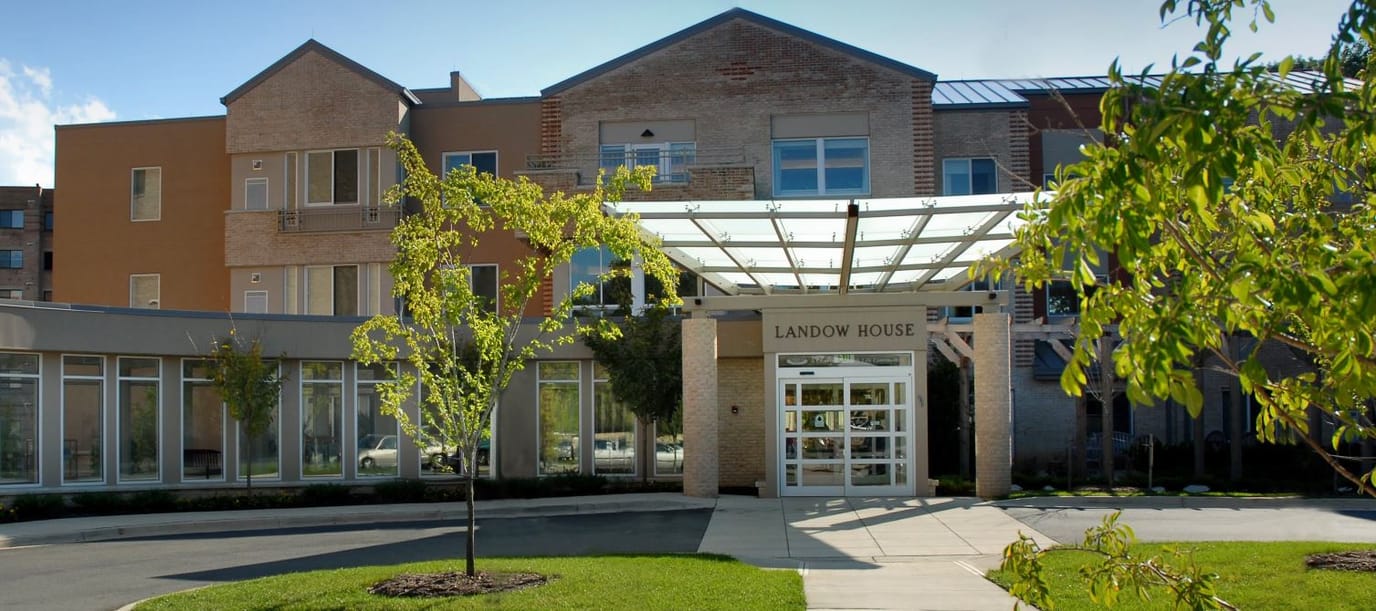
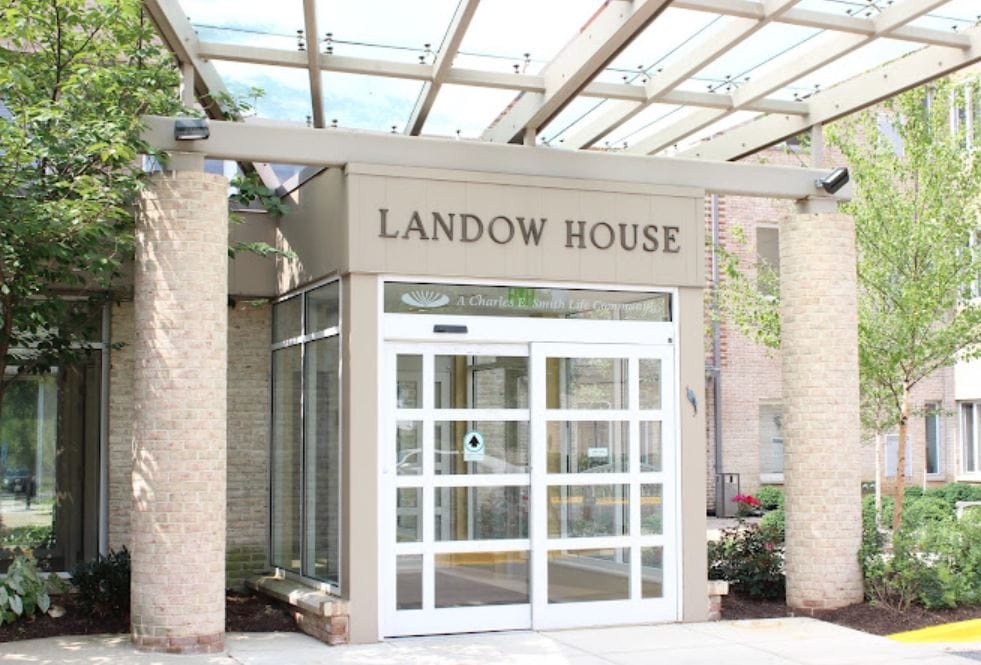
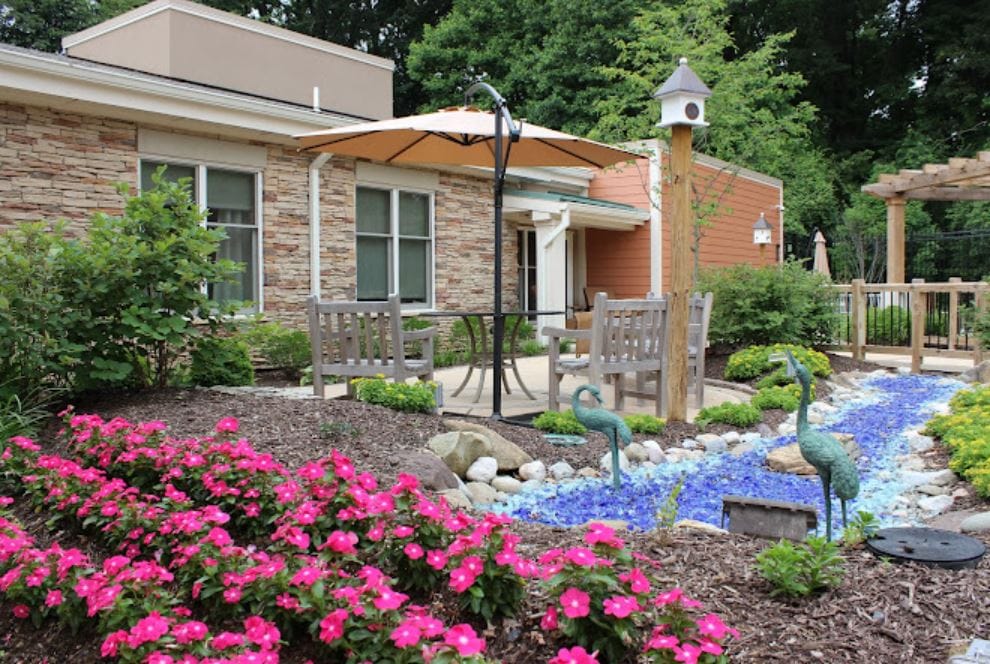
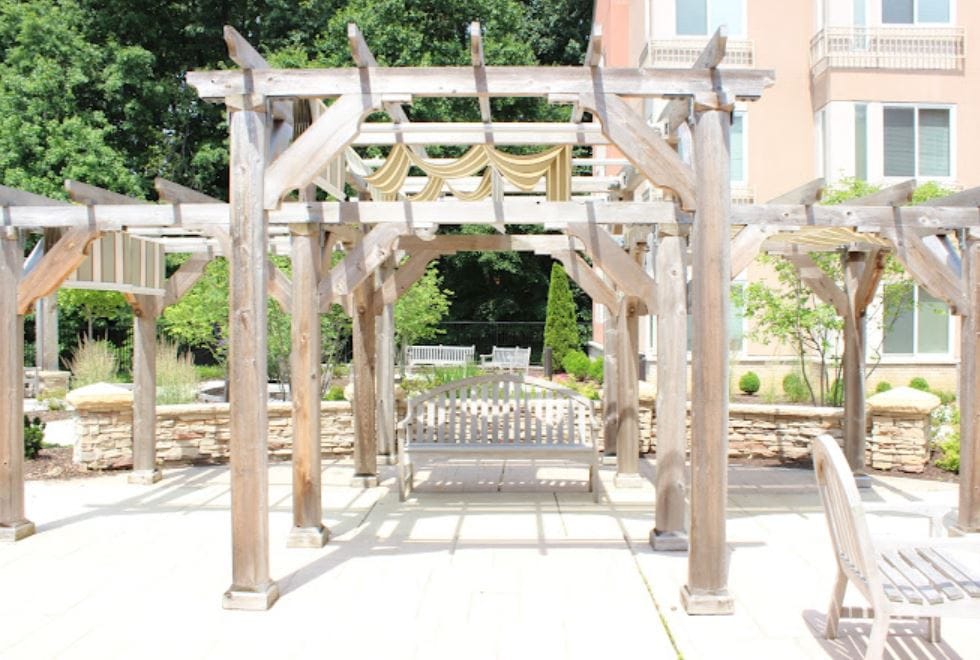
Nestled within the heart of Rockville, Maryland, Landow House stands as a haven where seniors can cherish their independence while residing in luxurious assisted living apartments. With a commitment to exceptional service, this residence offers daily assistance and provides a seamless blend of comfort and quality within its assisted living facilities. Here, residents find themselves immersed in a world of meaningful experiences that cater to their unique needs.
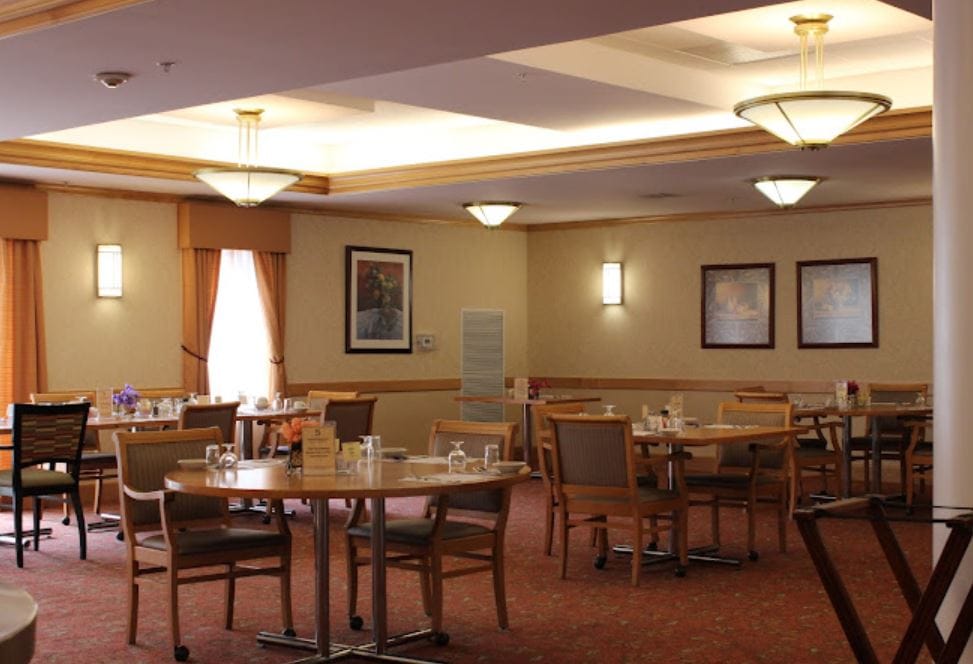
With the presence of an on-site licensed nurse available around the clock, as well as rigorous cleaning protocols for high-touch areas, the community fosters an environment of safety and reassurance. State-of-the-art amenities, including physical, occupational, and speech therapy services, further enhance the quality of life here. Physician services are conveniently offered on campus, and a diverse array of floor plans for assisted living apartments cater to individual preferences. From engaging leisure activities to delightful dining options, Landow House features a future movie theater, an inviting library, an art gallery, an outdoor garden, and more, creating a multi-awarded community that continues to exceed expectations in its commitment to excellence.
Ideally settled in Derwood, MD, AlfredHouse Symphony is an upscale senior living community that offers assisted living, memory care, personal care, and respite care. The community features 34 bright and spacious accommodations for a comfortable living environment supported with a 24-hour care team and security. Specializing in Behavioral Health, the community offers 22 of its accommodations to treating people with mental health diagnoses as well as dementia-related cognitive challenges.
Here, residents are provided access to a wide array of care services that empower them to continue living a fulfilling lifestyle, such as on-site therapies, mobility care, hospice care, and medication management. Convenient services, such as housekeeping, linen services, and scheduled transportation are also offered to free residents from chores and give them more time for fun and enjoyment. Amenities like gardening spaces, reading rooms, salon, water therapies, and chef-prepared meals are available to further improve residents’ living experience.
Overview of Cedar Glen Memory Care Home


Set in the serene area of Rockville, MD, Cedar Glen Memory Care Home is a thriving community designed to offer specialized memory care services. The community provides its residents with well-designed accommodations that foster independence and utmost safety to ensure they can comfortably enjoy their personal time. Their dedicated team of caregivers is also available 24/7 to assist residents with their daily living activities and unique care needs.
Dedicated to creating a vibrant and nurturing environment for residents, the community curates a specialized activity program that caters to residents’ preferences and levels of skills. Knowing the importance of proper nutrition, the community also offers three delicious meals tailored to their specific needs and preferences. From nurturing care to thoughtful amenities, Cedar Glen provides everything residents need to thrive despite their conditions.
Discover the convenience of having all needs met under one roof at Cadence at Olney, an exceptional retirement lifestyle community that offers independent living, assisted living, and memory care. This community extends an invitation to senior residents, offering an opportunity to relish an upscale lifestyle enriched by opulent amenities and comprehensive holistic programming designed to enhance every aspect of life.
Nestled on the fringes of a picturesque nature preserve, Cadence at Olney provides a splendid backdrop that empowers residents to thrive. Embracing the tranquility of a serene nature preserve, this assisted living community seamlessly weaves the beauty of its natural surroundings with the vibrancy of downtown Onley. This community has an array of enriching classes, engaging events, and invigorating activities awaiting the resident’s participation each day. Cadence at Olney ensures that the days are thoughtfully curated, ensuring not only a purposeful existence but also a sense of fulfillment nurtured by a plethora of tailored experiences that elevate well-being and celebrate joyful living.
Overview of Maple Ridge Memory Care Home
Receive compassionate care from well-experienced care professionals in Maple Ridge Memory Care Home, a warm and inviting community in Rockville, MD designed for memory care. Their accommodations are conveniently located near local recreational amenities and designed to foster a familiar and safe atmosphere for residents. Here, they offer personalized care services including daily living assistance, medication management, and therapy services to ensure residents maintain their overall well-being.
To make sure residents maintain an active lifestyle, the community offers an array of dementia-friendly activities tailored to their abilities and preferences. Healthy and balanced meals are also served daily to help residents maintain their health and proper diet. Here, everyone is well-supported to enjoy an excellent quality of life with no chores to worry about and all the care they need to thrive.
Age gracefully at Charles E. Smith Life Communities-Revitz House, a distinguished community located in the harmonious neighborhood of Rockville, MD, offering independent living. Beautifully designed one-bedroom floor plans are provided in a warm and welcoming environment, ensuring residents are comfortable and safe. A 24-hour concierge and a personal emergency response system are available for residents’ safety.
Residents will not run out of things to do, with plenty of recreational opportunities and engaging programs. Delightful dining options are also available, ensuring residents have the finest dining experience that caters to their dietary needs and preferences. Filled with state-of-the-art amenities and exceptional services, the community ensures residents have the finest retirement experience.
Set amidst lush green landscapes in Rockville, MD, AlfredHouse IV Villa is a welcoming senior living community that offers excellent assisted living, memory care, personal care, and respite care. Featuring only 6 well-designed residences and the standard 1:4 caregiver ratio, the community guarantees personalized assistance and focused attention in an intimate living environment. The community is equipped with 24-hour security and team members to guarantee residents’ safety and security.
In addition to extensive care and support, residents are also given plenty of opportunities for enrichment through the community’s broad array of engaging and stimulating activities and programs. The community also offers scheduled transportation to help residents freely explore the world around them. Chef-prepared meals, housekeeping services, and thoughtful amenities are also offered to make residents’ lives easier and fun.
Peacefully settled in a serene and peaceful environment in Rockville, MD, AlfredHouse III is a blissful senior living community that provides assisted living, memory care, personal care, and respite care. Featuring beautifully appointed residences with 24 hour team availability and security, the community warrants a safe, secure, and comfortable living environment. The community makes sure residents feel well cared for with access to various supportive services, including assistance with daily living activities, medication management or personal care assistance.
Lively and engaging daily events, fitness programs, and emotional support and therapy are available to help residents live a fulfilling lifestyle that nurtures their mind, body, and soul. Chef-prepared meals are also offered to provide residents the nourishment they need to continue staying active and healthy. Various amenities, such as gardening spaces, reading rooms, water therapies, and salon & grooming services are available to provide residents with convenience and spaces for relaxation.
Ranking Methodology
How we rank these memory care communities
Every community above is evaluated across six weighted categories using public data including state inspection records, review platforms, BBB profiles, and operator-published materials.
Weighting overview
- 35%Resident Experience
- 25%Regulatory
- 15%Visual Media
- 10%Website
- 10%Stability
- 5%Environment
01
Resident & Family Experience 35%
The single largest share of every ranking. Aggregated review sentiment and volume from major platforms — the closest signal to real resident experience.
- Includes
- Review Sentiment
- Review Volume
02
Regulatory & Safety Record 25%
State inspection records, citations, and complaint visits. We weight per-inspection rates more heavily than raw counts.
- Includes
- State Inspections
- Citations/Inspection
- % Inspections w/ Citations
- Complaint Visits
- Accreditations
- BBB Rating
03
Visual Media & Transparency 15%
Communities that publish high-quality visuals give families a real preview. No photos or tours = a negative transparency signal.
- Includes
- Video Tours
- Virtual Walkthroughs
- Photo Quantity
- Photo Quality
04
Website & Operator Transparency 10%
Site quality and whether the operator publishes basic accountability information — staff names, contact details, ownership.
- Includes
- Website Content
- Mobile Usability
- Staff Info Available
- Owner Info Available
05
Community Stability 10%
Operational signals indicating whether a community is well-run and meeting demand.
- Includes
- Occupancy Rate
- Bed Options
06
Environment & Pricing 5%
Walkability and pricing transparency. Walk Score is weighted higher for Independent Living than for Memory Care, where most residents do not leave unaccompanied.
- Includes
- Walk Score
- Pricing Transparency
Who we are
Your Senior Care Partner, Every Step of the Way
We help families find affordable senior communities and unlock same day discounts, Medicaid, and Medicare options tailored to your needs.
Contact us Today
Frequently Asked Questions about Memory Care in Rockville, MD
What is the average cost of memory care in Rockville, MD?
The average monthly cost of memory care in Rockville, MD is approximately $5,500. Actual rates vary by community, level of care, and floorplan.
What is the price range for memory care in Rockville, MD?
Memory care in Rockville, MD typically ranges from $4,500–$7,000 per month, depending on the community, room type, and care needs.
What is the typical staff-to-resident ratio at memory care communities in Rockville, MD?
Memory care communities in Rockville, MD typically operate with a staff-to-resident ratio in the range of 1:5–1:8.
What's the difference between assisted living and memory care in Maryland?
Assisted living in Maryland supports residents with daily activities (bathing, dressing, medication management) while preserving independence. Memory care is a specialized form of assisted living for residents living with Alzheimer's or dementia, and adds 24/7 secured environments, dementia-trained staff, and structured routines designed to reduce confusion and wandering.
Does Maryland Medicaid cover memory care?
Maryland Medicaid does not directly pay room-and-board for memory care, but most states (including Maryland) offer Home and Community-Based Services (HCBS) waivers that can offset the cost of care services delivered inside a licensed community. Eligibility, waitlists, and covered services vary — check directly with the state Medicaid agency.
What is memory care?
Memory care is a specialized form of assisted living for residents living with Alzheimer's disease or other forms of dementia, with secured environments, dementia-trained staff, and routines built to reduce confusion and wandering.
How many memory care communities are listed on this page?
This page features 26 memory care communities in Rockville, MD. Use the filters and comparison tools above to compare ratings, amenities, and pricing.
Updated on
