


Parkwood Village and The Landing
Assisted Living, Nursing Home, Independent Living, Memory Care & Respite Care · Wilson, NC
Parkwood Village and The Landing
Assisted Living, Nursing Home, Independent Living, Memory Care & Respite Care · Wilson, NC
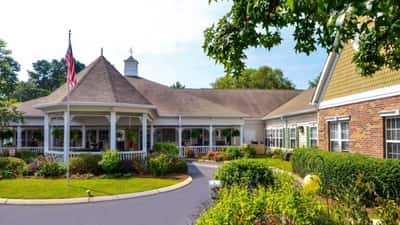
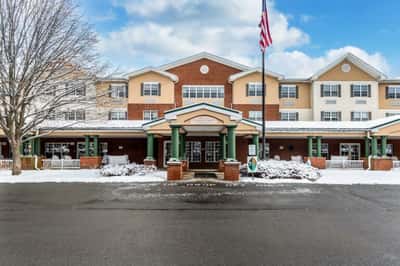
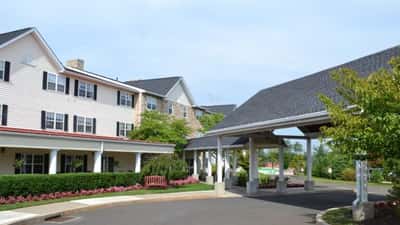
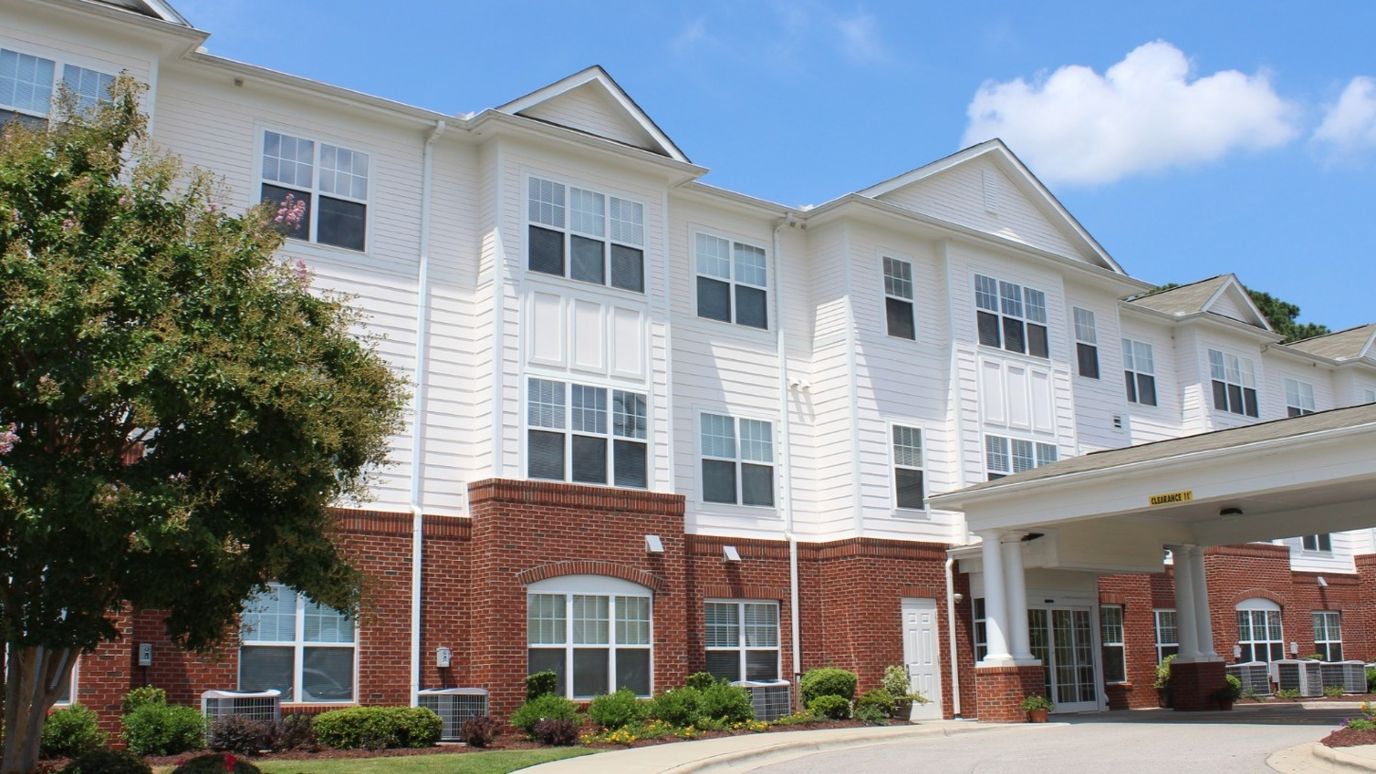
Parkwood Village and the Landing, a 70-bed nonprofit community at 1730 Parkwood Blvd W in Wilson, Wilson County, North Carolina, is operated by Well Spring Retirement Community. The facility serves residents with assisted living, independent living, memory care, and respite care needs on both Medicare and private-pay bases.
The inspection record reflects persistent challenges with medication administration and safety.
Since 2015, the facility has accumulated 62 deficiencies, 35 percent more than the state average and with recurring concerns including missed medication doses, failure to directly observe medication intake, and inaccurate medication records. Four state penalties totaling $25,000 were assessed between 2023 and 2024, including a settlement agreement. The most recent February 2025 annual inspection identified two moderate-level deficiencies: unsecured oxygen tanks stored in a resident’s room and missing physician-ordered therapeutic diet documentation for three sampled residents. These findings suggest ongoing gaps in storage protocols and dietary coordination despite previous cited deficiencies.
The facility’s 5-star CMS rating reflects substantial investment in staffing depth. Average nursing care runs 8 hours 7 minutes per resident per day, representing a 65 percent margin above the state benchmark and ranking third among North Carolina nursing homes. This staffing commitment provides meaningful direct care capacity for residents requiring frequent assistance.
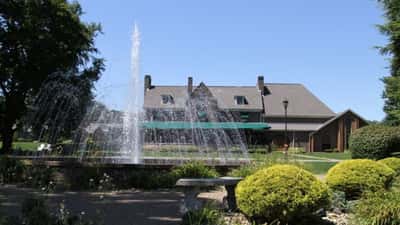
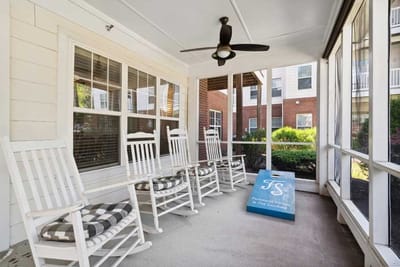
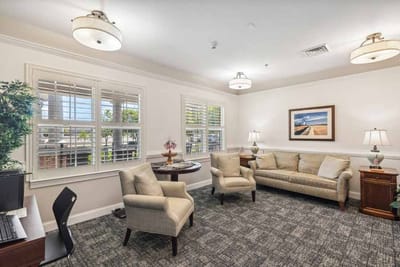
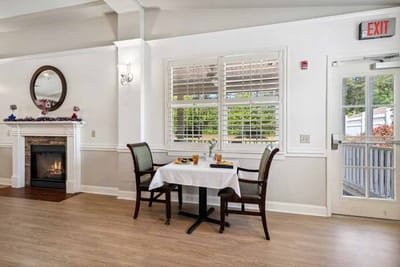
Amenities include a theater with reclining seating, a secured memory care garden, and a patio courtyard. Residents participate in live entertainment, arts programming, walking groups, bingo, exercise classes, and scheduled excursions. The facility offers beauty services, a library, fitness facilities, and complimentary transportation. On-site staff operate around the clock.
The community fits residents and families prioritizing high nurse-staffing ratios and structured activity programming alongside acceptance of a facility with a record of medication administration compliance challenges that persist despite remedial efforts.
70-bed community Rank #184 / 388Bed count — State benchmarkedThis home is ranked 184th out of 388 homes in North Carolina for bed count. Shows this facility's certified or reported bed count compared to other North Carolina facilities. Larger communities may offer more amenities, programs, and on-site services for residents and families.Facilities with the same value for a metric share the same rank. Rankings are based only on facilities in North Carolina that report data for that category. Facilities without available data are excluded from the ranking.Click the rank badge to see the full State ranking.Click here to see the full State ranking.
A moderately sized community that may balance personal attention with shared amenities and social activities.
Walk Score: 42 / 100 Rank #211 / 573Walk Score — State benchmarkedThis home is ranked 211th out of 573 homes in North Carolina for walk score. Shows how walkable this facility's neighborhood is compared to the average walk score across North Carolina facilities. Higher scores benefit residents, families, and staff.Facilities with the same value for a metric share the same rank. Rankings are based only on facilities in North Carolina that report data for that category. Facilities without available data are excluded from the ranking.Click the rank badge to see the full State ranking.Click here to see the full State ranking.
Somewhat walkable. A few nearby services may be reachable on foot, but most trips require transportation.
About this community
StatusActive
CountyWilson
License NumberHAL-098-033
Staffing
Key information about the people who lead and staff this community.
ContactJaime Waters, Administrator (per state records, record updated Jul 2026)
Inspection History
In North Carolina, the Department of Health and Human Services, Division of Health Service Regulation conducts unannounced surveys to ensure nursing and adult care homes meet safety standards.
Since 2015 · 11 years of data
62 deficiencies
27 inspections
4 penalties
$25.0K fined
23 inspections with deficiencies
Penalties
 Civil monetary penalties issued by North Carolina regulators against this facility, including fines and total monetary penalties.
This Facility
NC Average
vs. NC Avg-
4——
-
$25k——
Data reflects the most recent 11 years (since 2015).
- 2023-04-04 $2,000 Paid in Full
- 2023-04-04 $4,000 Paid in Full
- 2024-03-22 $12,000 Settlement Agreement
Inspection Scorecard
This scorecard compares key inspection, deficiency, and complaint metrics at this facility against the North Carolina state average. Metrics rated ≥15% worse than average are highlighted in red; those ≥15% better are highlighted in green.
Since 2015 vs. North Carolina state average
Overall vs. NC average
3 Worse
Metrics worse than North Carolina average:
• Total deficiencies (35% above)
• Deficiencies per inspection (5% above)
• Inspections with deficiencies (21% above) 1 Better Metrics better than North Carolina average:
• Inspection deficiency rate (6% below)
• Total deficiencies (35% above)
• Deficiencies per inspection (5% above)
• Inspections with deficiencies (21% above) 1 Better Metrics better than North Carolina average:
• Inspection deficiency rate (6% below)
Deficiencies
| This Facility | NC Average | vs. NC Avg |
|---|---|---|---|
|
Total deficiencies
| 62 | 46 | This facility has 35% more total deficiencies than a typical North Carolina nursing home (62 vs. NC avg 46).↑ 35% worse |
|
Deficiencies per inspection
| 2.3 | 2.2 | This facility has 5% more deficiencies per inspection than a typical North Carolina nursing home (2.3 vs. NC avg 2.2).↑ 5% worse |
Inspections
| This Facility | NC Average | vs. NC Avg |
|---|---|---|---|
|
Total inspections
| 27 | 21 | This facility has had 29% more total inspections than the North Carolina average (27 vs. NC avg 21). More inspections can mean more regulatory scrutiny rather than worse care.↑ 29% more |
|
Inspections with deficiencies
| 23 | 19 | This facility has 21% more inspections with deficiencies than a typical North Carolina nursing home (23 vs. NC avg 19).↑ 21% worse |
|
Inspection deficiency rate
| 85% | 90% | This facility has 5 percentage points lower inspection deficiency rate than a typical North Carolina nursing home (85% vs. NC avg 90%).↓ 5% better |
Inspection Reports Summary
An editor-reviewed summary of the themes and findings across this facility's recent inspection reports.
- February 26, 2025 inspection found two deficiencies including unsecured oxygen tanks in a resident’s room and incomplete therapeutic diet listings for half of sampled residents.
- March 22, 2024 complaint investigation cited seven deficiencies for medication errors, untrained medication aides, failure to clarify orders, and allowing a staff member under drug diversion investigation to administer medications.
- July 24, 2024 follow-up survey confirmed correction of prior medication administration documentation issues but found one new deficiency for unsecured medications left in a resident’s room.
What does this home offer?
Pets Allowed
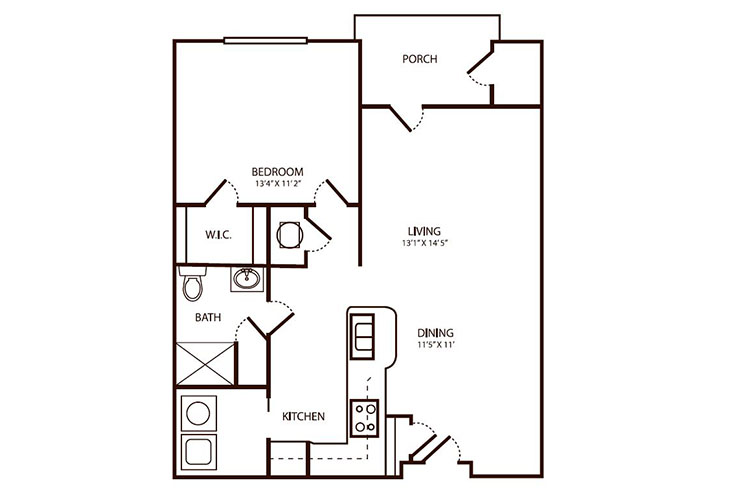
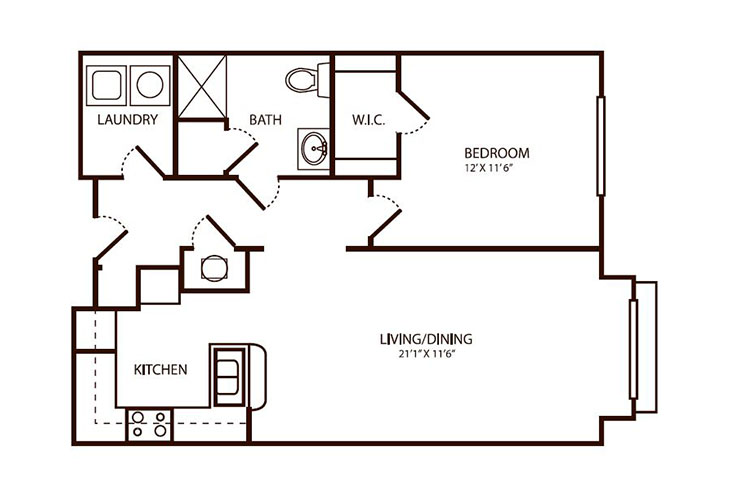
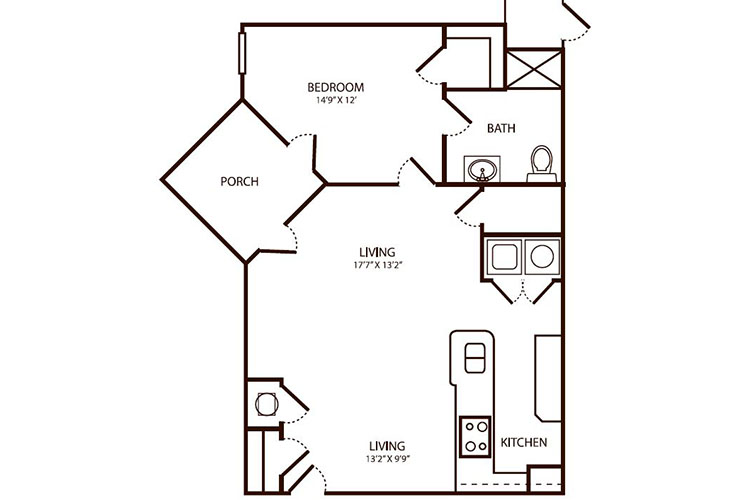
Housing Options: 1 Bed / 2 Bed
Building Type: 3-story
Beauty Services
Transportation Services
Housekeeping Services
Recreational Activities
Exercise Programs
Living Spaces & Floor Plans for Parkwood Village and The Landing
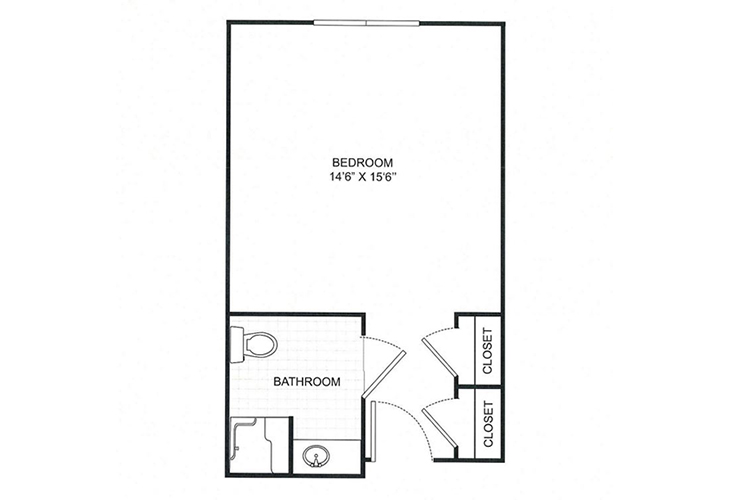
Suite
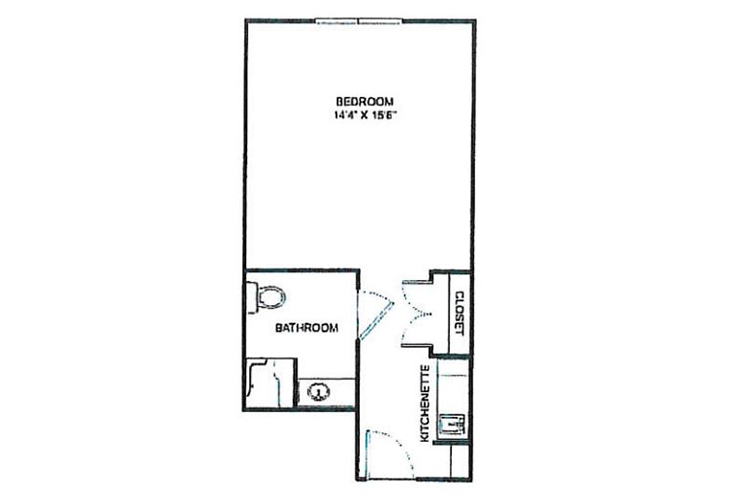
Suite
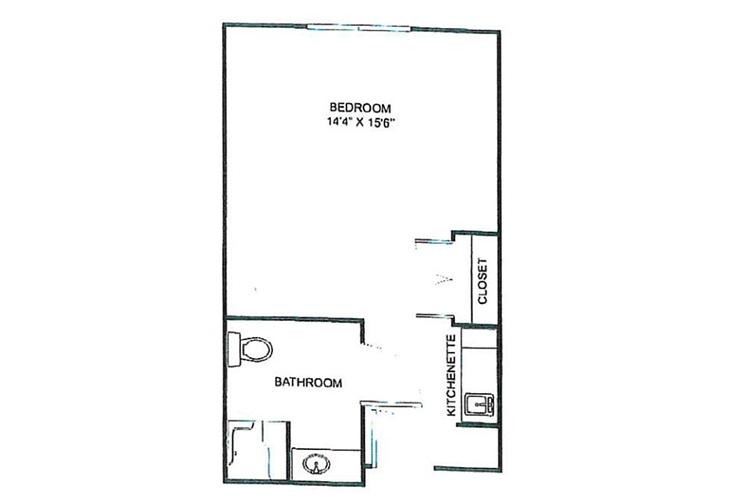
Suite
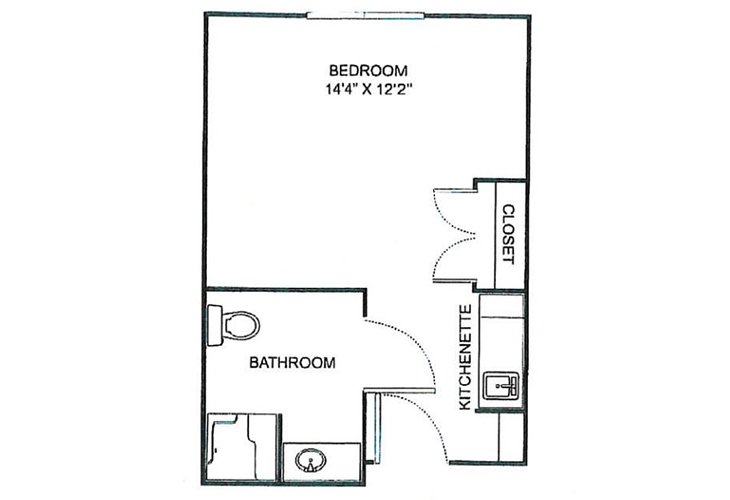
Suite
Suite
Suite
Suite
Places of interest near Parkwood Village and The Landing
![]() 1.9 miles from city center
1.9 miles from city center
![]() Estimated distance in miles from Wilson's city center to Parkwood Village and The Landing's address, calculated via Google Maps.
— 0.51 miles to nearest hospital (Wilson Medical Center)
Estimated distance in miles from Wilson's city center to Parkwood Village and The Landing's address, calculated via Google Maps.
— 0.51 miles to nearest hospital (Wilson Medical Center)
Calculate Travel Distance to Parkwood Village and The Landing
Add your location
Financial Assistance for
Assisted Living in North Carolina
Parkwood Village and The Landing is located in Wilson, North Carolina.
Here are the financial assistance programs available to residents in North Carolina.
More homes from the same operator
Operated by
Discovery Senior Living
Frequently Asked Questions about Parkwood Village and The Landing
What neighborhood is Parkwood Village and The Landing in?
Parkwood Village and The Landing is in the Westwood neighborhood of Wilson.
Is Parkwood Village and The Landing in a walkable area?
Parkwood Village and The Landing has a walk score of 42. Somewhat walkable. A few nearby services may be reachable on foot, but most trips require transportation.
What is the license number of Parkwood Village and The Landing?
According to NC state health department records, Parkwood Village and The Landing's license number is HAL-098-033.
Are pets allowed at Parkwood Village and The Landing?
Yes, Parkwood Village and The Landing allows residents to bring their pets.
How many beds does Parkwood Village and The Landing have?
Parkwood Village and The Landing has 70 beds.
Are there photos of Parkwood Village and The Landing?
Yes — there are 4 photos of Parkwood Village and The Landing in the photo gallery on this page.
What is the address of Parkwood Village and The Landing?
Parkwood Village and The Landing is located at 1730 Parkwood Blvd W, Wilson, NC 27893.
Guides for Better Senior Living
Care Cost Calculator: See Prices in Your Area
Nursing Home Data Explorer
Don’t Wait Too Long: 7 Red Flag Signs Your Parent Needs Assisted Living Now
The True Cost of Assisted Living in 2025 – And How Families Are Paying For It
Understanding Senior Living Costs: Pricing Models, Discounts & Financial Assistance
Updated on
