


Compare Senior Care around Maryland
Info below is compiled from the MD Dept. of Health (OHCQ), senior community websites & trusted data sources such as Walk Score & BBB.
Communities are listed from highest to lowest based on our ranking methodology.
| Bedford Court, a CCRC | SC AL HOS IL MC NH RC SNF | Silver Spring (International Drive) | 76
Facility
76
MD AVG
42
Rank
#174 / 685 | Yes |
64
Facility
64
MD AVG
43
Rank
#261 / 985 | Studio / 1 Bed | 34
Facility
34
MD AVG
21
Rank
#22 / 210 | - |
15% Male Residents — State Benchmarked 15% of residents are male, compared to the Maryland average of 31%. This facility caters to a majority female resident pool (85% female), consistent with the broader assisted living trend where women significantly outnumber men. |
85% Female Residents — State Benchmarked 85% of residents are female, compared to the Maryland average of 69%. Women comprise the large majority, consistent with national assisted living demographics where women live longer and enter care facilities at higher rates. |
95% White Residents — State Benchmarked 95% of residents are reported as White, compared to the Maryland average of 81%. A higher White share than is typical for assisted living in Maryland in this dataset — compare with peer facilities for local context. |
3% African American Residents — State Benchmarked 3% of residents are reported as African American or Black, compared to the Maryland average of 13%. A lower African American share than is typical in Maryland; local markets still vary widely. |
2% Other Ethnicity Residents — State Benchmarked 2% of residents fall into categories other than White or African American (combined), compared to the Maryland average of 6%. This column aggregates Hispanic, Asian, multiracial, and any other labeled groups that are not classified as White or African American. Reported subgroups in this total: Asian (2%). |
2% Residents Age 65–74 — State Benchmarked 2% of residents are 65–74, compared to the Maryland average of 13%. Fewer younger seniors suggests the resident population skews older, likely requiring higher acuity care and more hands-on support. |
8% Residents Age 75–84 — State Benchmarked 8% of residents are 75–84, compared to the Maryland average of 31%. Below the state norm — the resident mix may skew either younger or older than this typical middle bracket. |
65% Residents Age 85–94 — State Benchmarked 65% of residents are 85–94, compared to the Maryland average of 44%. A high concentration of very elderly residents signals a higher-acuity facility with experience caring for advanced age-related needs. |
26% Residents Age 95+ — State Benchmarked 26% of residents are 95 or older, compared to the Maryland average of 16%. A high proportion of the oldest-old suggests strong end-of-life care experience and very-high-acuity capabilities. |
| Edenwald Senior Living | SC AL IL MC NH SNF | Towson (Southerly Road) | 94
Facility
94
MD AVG
42
Rank
#139 / 685 | No |
83
Facility
83
MD AVG
43
Rank
#70 / 985 | 1 Bed / 2 Bed | - | A+ |
18% Male Residents — State Benchmarked 18% of residents are male, compared to the Maryland average of 31%. This facility caters to a majority female resident pool (82% female), consistent with the broader assisted living trend where women significantly outnumber men. |
82% Female Residents — State Benchmarked 82% of residents are female, compared to the Maryland average of 69%. Women comprise the large majority, consistent with national assisted living demographics where women live longer and enter care facilities at higher rates. |
100% White Residents — State Benchmarked 100% of residents are reported as White, compared to the Maryland average of 81%. A higher White share than is typical for assisted living in Maryland in this dataset — compare with peer facilities for local context. |
0% African American Residents — State Benchmarked 0% of residents are reported as African American or Black, compared to the Maryland average of 13%. A lower African American share than is typical in Maryland; local markets still vary widely. |
0% Other Ethnicity Residents — State Benchmarked 0% of residents fall into categories other than White or African American (combined), compared to the Maryland average of 6%. This column aggregates Hispanic, Asian, multiracial, and any other labeled groups that are not classified as White or African American. | - |
13% Residents Age 75–84 — State Benchmarked 13% of residents are 75–84, compared to the Maryland average of 31%. Below the state norm — the resident mix may skew either younger or older than this typical middle bracket. |
53% Residents Age 85–94 — State Benchmarked 53% of residents are 85–94, compared to the Maryland average of 44%. A high concentration of very elderly residents signals a higher-acuity facility with experience caring for advanced age-related needs. |
35% Residents Age 95+ — State Benchmarked 35% of residents are 95 or older, compared to the Maryland average of 16%. A high proportion of the oldest-old suggests strong end-of-life care experience and very-high-acuity capabilities. |
| Lutheran Village at Miller’s Grant | SC AL IL NH SNF | Ellicott City (Lutheran Village At Miller’s Grant) | 36
Facility
36
MD AVG
42
Rank
#230 / 685 | Yes |
19
Facility
19
MD AVG
43
Rank
#746 / 985 | 1 Bed / 2 Bed | 21
Facility
21
MD AVG
21
Rank
#108 / 210 | - |
17% Male Residents — State Benchmarked 17% of residents are male, compared to the Maryland average of 31%. This facility caters to a majority female resident pool (83% female), consistent with the broader assisted living trend where women significantly outnumber men. |
83% Female Residents — State Benchmarked 83% of residents are female, compared to the Maryland average of 69%. Women comprise the large majority, consistent with national assisted living demographics where women live longer and enter care facilities at higher rates. |
83% White Residents — State Benchmarked 83% of residents are reported as White, compared to the Maryland average of 81%. Close to the average for this category among assisted living facilities in Maryland with reported race/ethnicity data. |
11% African American Residents — State Benchmarked 11% of residents are reported as African American or Black, compared to the Maryland average of 13%. In line with the Maryland average for African American residents among facilities reporting this breakdown. |
6% Other Ethnicity Residents — State Benchmarked 6% of residents fall into categories other than White or African American (combined), compared to the Maryland average of 6%. This column aggregates Hispanic, Asian, multiracial, and any other labeled groups that are not classified as White or African American. Reported subgroups in this total: Asian (6%). | - |
33% Residents Age 75–84 — State Benchmarked 33% of residents are 75–84, compared to the Maryland average of 31%. This is the second most common age bracket in assisted living, representing residents with moderate care needs. |
44% Residents Age 85–94 — State Benchmarked 44% of residents are 85–94, compared to the Maryland average of 44%. This is typically the most common age bracket in assisted living — this facility is in line with the statewide norm. |
22% Residents Age 95+ — State Benchmarked 22% of residents are 95 or older, compared to the Maryland average of 16%. A high proportion of the oldest-old suggests strong end-of-life care experience and very-high-acuity capabilities. |
| Friends House Retirement Community | SC AL IL NH SNF | Sandy Spring | 24
Facility
24
MD AVG
42
Rank
#242 / 685 | Yes |
6
Facility
6
MD AVG
43
Rank
#891 / 985 | - | 20
Facility
20
MD AVG
21
Rank
#112 / 210 | - |
6% Male Residents — State Benchmarked 6% of residents are male, compared to the Maryland average of 31%. This facility caters to a majority female resident pool (94% female), consistent with the broader assisted living trend where women significantly outnumber men. |
94% Female Residents — State Benchmarked 94% of residents are female, compared to the Maryland average of 69%. Women comprise the large majority, consistent with national assisted living demographics where women live longer and enter care facilities at higher rates. |
94% White Residents — State Benchmarked 94% of residents are reported as White, compared to the Maryland average of 81%. A higher White share than is typical for assisted living in Maryland in this dataset — compare with peer facilities for local context. |
0% African American Residents — State Benchmarked 0% of residents are reported as African American or Black, compared to the Maryland average of 13%. A lower African American share than is typical in Maryland; local markets still vary widely. |
6% Other Ethnicity Residents — State Benchmarked 6% of residents fall into categories other than White or African American (combined), compared to the Maryland average of 6%. This column aggregates Hispanic, Asian, multiracial, and any other labeled groups that are not classified as White or African American. Reported subgroups in this total: Asian (6%). |
6% Residents Age 65–74 — State Benchmarked 6% of residents are 65–74, compared to the Maryland average of 13%. Fewer younger seniors suggests the resident population skews older, likely requiring higher acuity care and more hands-on support. |
18% Residents Age 75–84 — State Benchmarked 18% of residents are 75–84, compared to the Maryland average of 31%. Below the state norm — the resident mix may skew either younger or older than this typical middle bracket. |
53% Residents Age 85–94 — State Benchmarked 53% of residents are 85–94, compared to the Maryland average of 44%. A high concentration of very elderly residents signals a higher-acuity facility with experience caring for advanced age-related needs. |
24% Residents Age 95+ — State Benchmarked 24% of residents are 95 or older, compared to the Maryland average of 16%. A high proportion of the oldest-old suggests strong end-of-life care experience and very-high-acuity capabilities. |
| Sunrise of Rockville | SC AL HOS MC | Rockville (Baltimore Road) | 89
Facility
89
MD AVG
42
Rank
#150 / 685 | Yes |
89
Facility
89
MD AVG
43
Rank
#32 / 985 | Studio / 1 Bed / 2 Bed | 45
Facility
45
MD AVG
21
Rank
#4 / 210 | A- |
23% Male Residents — State Benchmarked 23% of residents are male, compared to the Maryland average of 31%. This facility caters to a majority female resident pool (77% female), consistent with the broader assisted living trend where women significantly outnumber men. |
77% Female Residents — State Benchmarked 77% of residents are female, compared to the Maryland average of 69%. Women comprise the large majority, consistent with national assisted living demographics where women live longer and enter care facilities at higher rates. |
87% White Residents — State Benchmarked 87% of residents are reported as White, compared to the Maryland average of 81%. Close to the average for this category among assisted living facilities in Maryland with reported race/ethnicity data. |
2% African American Residents — State Benchmarked 2% of residents are reported as African American or Black, compared to the Maryland average of 13%. A lower African American share than is typical in Maryland; local markets still vary widely. |
11% Other Ethnicity Residents — State Benchmarked 11% of residents fall into categories other than White or African American (combined), compared to the Maryland average of 6%. This column aggregates Hispanic, Asian, multiracial, and any other labeled groups that are not classified as White or African American. Reported subgroups in this total: Mixed Race (6%), Hispanic (3%), Asian (2%). |
3% Residents Age 65–74 — State Benchmarked 3% of residents are 65–74, compared to the Maryland average of 13%. Fewer younger seniors suggests the resident population skews older, likely requiring higher acuity care and more hands-on support. |
31% Residents Age 75–84 — State Benchmarked 31% of residents are 75–84, compared to the Maryland average of 31%. This is the second most common age bracket in assisted living, representing residents with moderate care needs. |
56% Residents Age 85–94 — State Benchmarked 56% of residents are 85–94, compared to the Maryland average of 44%. A high concentration of very elderly residents signals a higher-acuity facility with experience caring for advanced age-related needs. |
10% Residents Age 95+ — State Benchmarked 10% of residents are 95 or older, compared to the Maryland average of 16%. Most residents here have not yet reached the oldest-old bracket, suggesting a younger overall community. |
| Maplewood Park Place | SC AL IL MC NH SNF | Bethesda (Pooks Hill) | 29
Facility
29
MD AVG
42
Rank
#240 / 685 | Yes |
38
Facility
38
MD AVG
43
Rank
#542 / 985 | 1 Bed / 2 Bed | 30
Facility
30
MD AVG
21
Rank
#44 / 210 | - |
18% Male Residents — State Benchmarked 18% of residents are male, compared to the Maryland average of 31%. This facility caters to a majority female resident pool (82% female), consistent with the broader assisted living trend where women significantly outnumber men. |
82% Female Residents — State Benchmarked 82% of residents are female, compared to the Maryland average of 69%. Women comprise the large majority, consistent with national assisted living demographics where women live longer and enter care facilities at higher rates. |
100% White Residents — State Benchmarked 100% of residents are reported as White, compared to the Maryland average of 81%. A higher White share than is typical for assisted living in Maryland in this dataset — compare with peer facilities for local context. |
0% African American Residents — State Benchmarked 0% of residents are reported as African American or Black, compared to the Maryland average of 13%. A lower African American share than is typical in Maryland; local markets still vary widely. |
0% Other Ethnicity Residents — State Benchmarked 0% of residents fall into categories other than White or African American (combined), compared to the Maryland average of 6%. This column aggregates Hispanic, Asian, multiracial, and any other labeled groups that are not classified as White or African American. | - |
6% Residents Age 75–84 — State Benchmarked 6% of residents are 75–84, compared to the Maryland average of 31%. Below the state norm — the resident mix may skew either younger or older than this typical middle bracket. |
24% Residents Age 85–94 — State Benchmarked 24% of residents are 85–94, compared to the Maryland average of 44%. The population here skews younger than the statewide norm, which may indicate a more active, lower-acuity community. |
71% Residents Age 95+ — State Benchmarked 71% of residents are 95 or older, compared to the Maryland average of 16%. A high proportion of the oldest-old suggests strong end-of-life care experience and very-high-acuity capabilities. |
| Ingleside at King Farm | SC AL IL MC NH SNF | Rockville (King Farm) | 45
Facility
45
MD AVG
42
Rank
#219 / 685 | Yes |
73
Facility
73
MD AVG
43
Rank
#152 / 985 | 1 Bed / 2 Bed | - | - | - | - | - | - | - | - | - | - | - |
| Homewood Living Frederick | SC AL IL MC NH SNF | Frederick | 120
Facility
120
MD AVG
42
Rank
#73 / 685 | Yes |
14
Facility
14
MD AVG
43
Rank
#788 / 985 | 1 Bed / 2 Bed | - | - | - | - | - | - | - | - | - | - | - |
| Residences at Vantage Point | SC AL HC IL MC NH SNF | Columbia (Town Center) | 44
Facility
44
MD AVG
42
Rank
#222 / 685 | Yes |
52
Facility
52
MD AVG
43
Rank
#402 / 985 | Studio / 1 Bed / 2 Bed | 36
Facility
36
MD AVG
21
Rank
#16 / 210 | - | - | - | - | - | - | - | - | - | - |
| Buckingham‘s Choice | SC AL MC NH RC SNF | Adamstown (Baker Circle) | 42
Facility
42
MD AVG
42
Rank
#223 / 685 | No |
3
Facility
3
MD AVG
43
Rank
#930 / 985 | Private Rooms | 31
Facility
31
MD AVG
21
Rank
#39 / 210 | - | - | - | - | - | - | - | - | - | - |
| Sunrise of Pikesville | SC NH AL HOS MC | Pikesville (Old Court Road) | 96
Facility
96
MD AVG
42
Rank
#131 / 685 | Yes |
75
Facility
75
MD AVG
43
Rank
#131 / 985 | Studio / 1 Bed / 2 Bed | 45
Facility
45
MD AVG
21
Rank
#4 / 210 | A- |
30% Male Residents — State Benchmarked 30% of residents are male, compared to the Maryland average of 31%. This facility caters to a majority female resident pool (70% female), consistent with the broader assisted living trend where women significantly outnumber men. |
70% Female Residents — State Benchmarked 70% of residents are female, compared to the Maryland average of 69%. Women comprise the large majority, consistent with national assisted living demographics where women live longer and enter care facilities at higher rates. |
63% White Residents — State Benchmarked 63% of residents are reported as White, compared to the Maryland average of 81%. A lower White share than the Maryland average — the community may draw a more diverse resident mix relative to other facilities in Maryland. |
37% African American Residents — State Benchmarked 37% of residents are reported as African American or Black, compared to the Maryland average of 13%. A higher African American share than the typical Maryland average — useful context when comparing cultural fit and community composition. |
0% Other Ethnicity Residents — State Benchmarked 0% of residents fall into categories other than White or African American (combined), compared to the Maryland average of 6%. This column aggregates Hispanic, Asian, multiracial, and any other labeled groups that are not classified as White or African American. |
15% Residents Age 65–74 — State Benchmarked 15% of residents are 65–74, compared to the Maryland average of 13%. In line with the statewide profile for this youngest senior bracket in assisted living. |
27% Residents Age 75–84 — State Benchmarked 27% of residents are 75–84, compared to the Maryland average of 31%. This is the second most common age bracket in assisted living, representing residents with moderate care needs. |
41% Residents Age 85–94 — State Benchmarked 41% of residents are 85–94, compared to the Maryland average of 44%. This is typically the most common age bracket in assisted living — this facility is in line with the statewide norm. |
15% Residents Age 95+ — State Benchmarked 15% of residents are 95 or older, compared to the Maryland average of 16%. In line with the statewide profile for the oldest resident bracket. |
| Brighton Gardens of Friendship Heights | SC AL HOS MC | Chevy Chase (Friendship Boulevard) | 154
Facility
154
MD AVG
42
Rank
#39 / 685 | Yes |
86
Facility
86
MD AVG
43
Rank
#47 / 985 | Studio / 1 Bed / 2 Bed | 29
Facility
29
MD AVG
21
Rank
#48 / 210 | - |
20% Male Residents — State Benchmarked 20% of residents are male, compared to the Maryland average of 31%. This facility caters to a majority female resident pool (80% female), consistent with the broader assisted living trend where women significantly outnumber men. |
80% Female Residents — State Benchmarked 80% of residents are female, compared to the Maryland average of 69%. Women comprise the large majority, consistent with national assisted living demographics where women live longer and enter care facilities at higher rates. |
96% White Residents — State Benchmarked 96% of residents are reported as White, compared to the Maryland average of 81%. A higher White share than is typical for assisted living in Maryland in this dataset — compare with peer facilities for local context. |
1% African American Residents — State Benchmarked 1% of residents are reported as African American or Black, compared to the Maryland average of 13%. A lower African American share than is typical in Maryland; local markets still vary widely. |
3% Other Ethnicity Residents — State Benchmarked 3% of residents fall into categories other than White or African American (combined), compared to the Maryland average of 6%. This column aggregates Hispanic, Asian, multiracial, and any other labeled groups that are not classified as White or African American. Reported subgroups in this total: Asian (2%), Hispanic (1%). |
3% Residents Age 65–74 — State Benchmarked 3% of residents are 65–74, compared to the Maryland average of 13%. Fewer younger seniors suggests the resident population skews older, likely requiring higher acuity care and more hands-on support. |
31% Residents Age 75–84 — State Benchmarked 31% of residents are 75–84, compared to the Maryland average of 31%. This is the second most common age bracket in assisted living, representing residents with moderate care needs. |
49% Residents Age 85–94 — State Benchmarked 49% of residents are 85–94, compared to the Maryland average of 44%. A high concentration of very elderly residents signals a higher-acuity facility with experience caring for advanced age-related needs. |
15% Residents Age 95+ — State Benchmarked 15% of residents are 95 or older, compared to the Maryland average of 16%. In line with the statewide profile for the oldest resident bracket. |
| Sunrise of Frederick | SC AL MC | Frederick (Waterford) | 88
Facility
88
MD AVG
42
Rank
#152 / 685 | Yes |
62
Facility
62
MD AVG
43
Rank
#286 / 985 | Studio / Suite / 2 Bed | 45
Facility
45
MD AVG
21
Rank
#4 / 210 | A- |
31% Male Residents — State Benchmarked 31% of residents are male, compared to the Maryland average of 31%. This facility caters to a majority female resident pool (69% female), consistent with the broader assisted living trend where women significantly outnumber men. |
69% Female Residents — State Benchmarked 69% of residents are female, compared to the Maryland average of 69%. Women comprise the large majority, consistent with national assisted living demographics where women live longer and enter care facilities at higher rates. |
97% White Residents — State Benchmarked 97% of residents are reported as White, compared to the Maryland average of 81%. A higher White share than is typical for assisted living in Maryland in this dataset — compare with peer facilities for local context. |
2% African American Residents — State Benchmarked 2% of residents are reported as African American or Black, compared to the Maryland average of 13%. A lower African American share than is typical in Maryland; local markets still vary widely. |
2% Other Ethnicity Residents — State Benchmarked 2% of residents fall into categories other than White or African American (combined), compared to the Maryland average of 6%. This column aggregates Hispanic, Asian, multiracial, and any other labeled groups that are not classified as White or African American. Reported subgroups in this total: Hispanic (2%). |
10% Residents Age 65–74 — State Benchmarked 10% of residents are 65–74, compared to the Maryland average of 13%. Fewer younger seniors suggests the resident population skews older, likely requiring higher acuity care and more hands-on support. |
34% Residents Age 75–84 — State Benchmarked 34% of residents are 75–84, compared to the Maryland average of 31%. This is the second most common age bracket in assisted living, representing residents with moderate care needs. |
48% Residents Age 85–94 — State Benchmarked 48% of residents are 85–94, compared to the Maryland average of 44%. This is typically the most common age bracket in assisted living — this facility is in line with the statewide norm. |
6% Residents Age 95+ — State Benchmarked 6% of residents are 95 or older, compared to the Maryland average of 16%. Most residents here have not yet reached the oldest-old bracket, suggesting a younger overall community. |
| Autumn Lake Healthcare at Riverview | SC HOS NH PC RC SNF | Essex | 238
Facility
238
MD AVG
42
Rank
#5 / 685 | No |
61
Facility
61
MD AVG
43
Rank
#301 / 985 | - | - | - | - | - | - | - | - | - | - | - | - |
| Sterling Care Hillhaven Assisted Living and Memory Care | SC AL HOS MC NH SNF | Adelphi (Knollwood) | 66
Facility
66
MD AVG
42
Rank
#188 / 685 | No |
25
Facility
25
MD AVG
43
Rank
#684 / 985 | Studio / 1 Bed | - | - | - | - | - | - | - | - | - | - | - |
Rows per page:

View all Nearby Homes
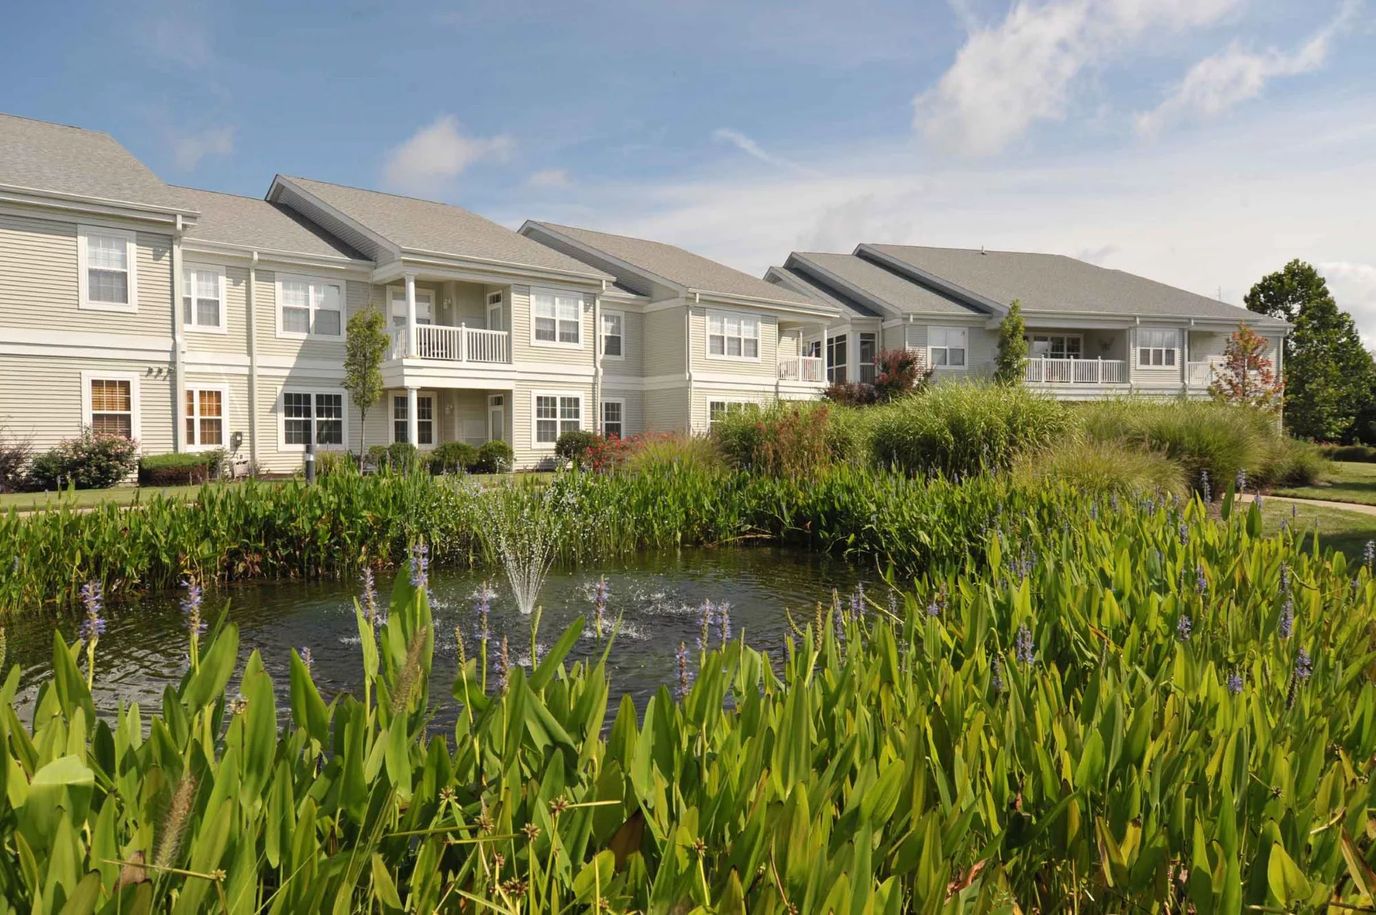
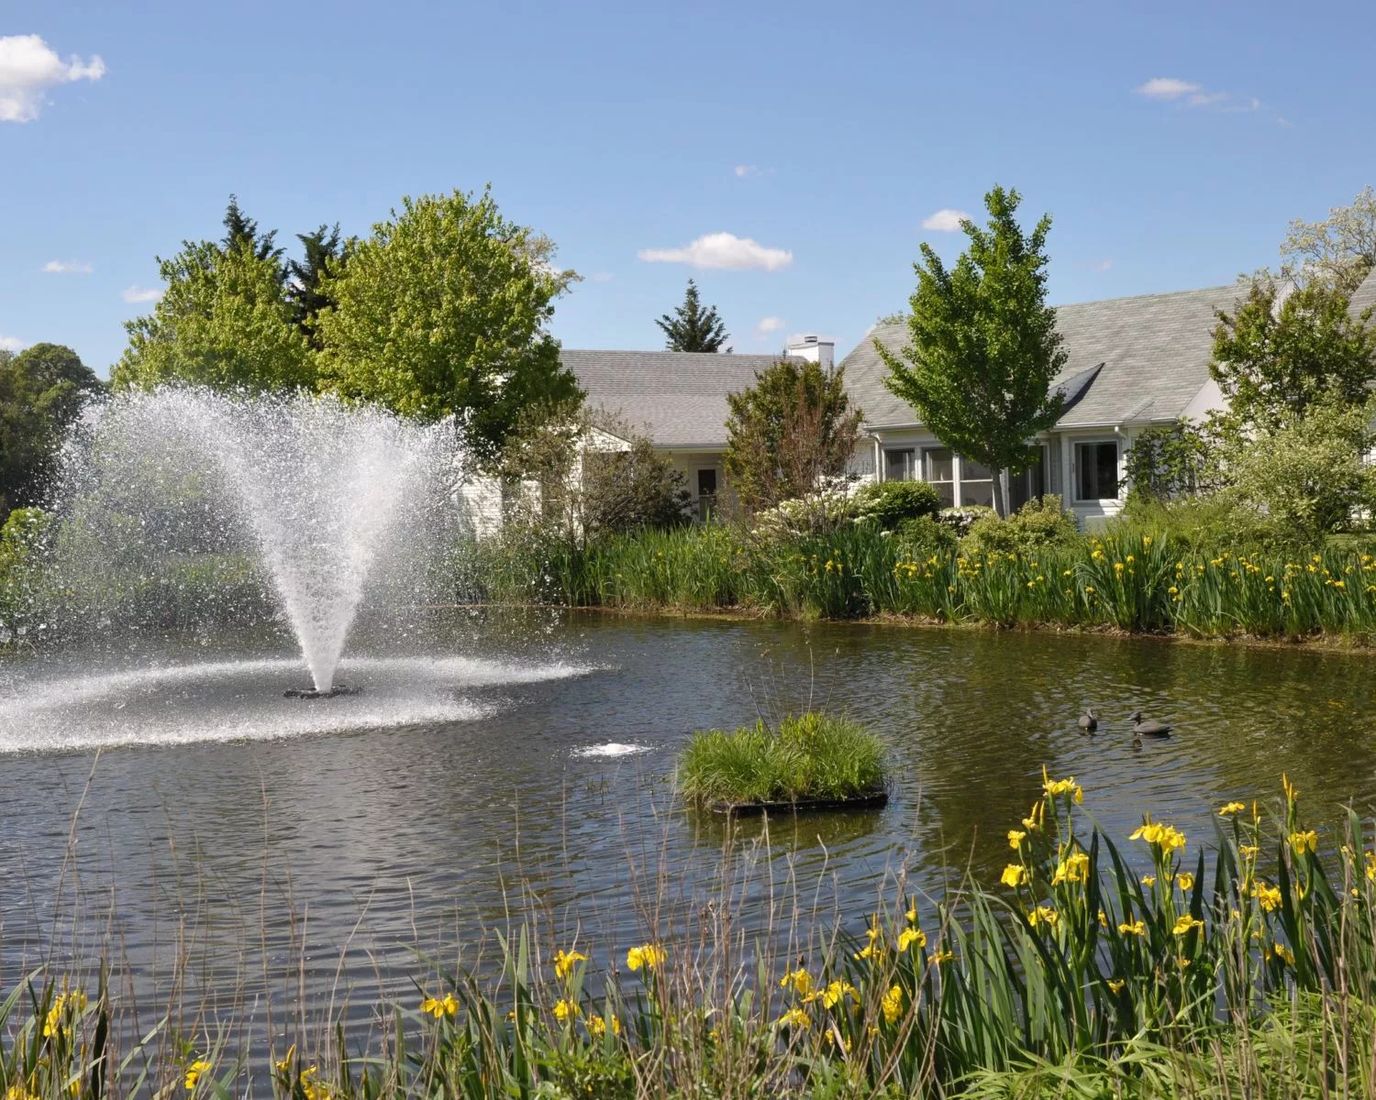
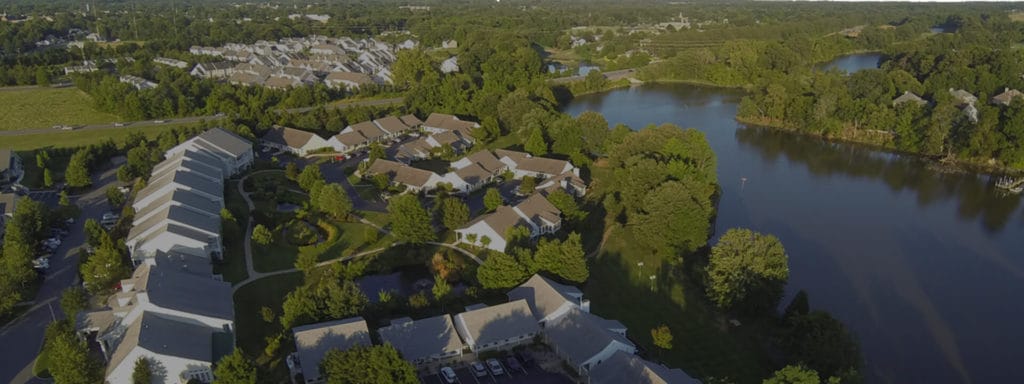
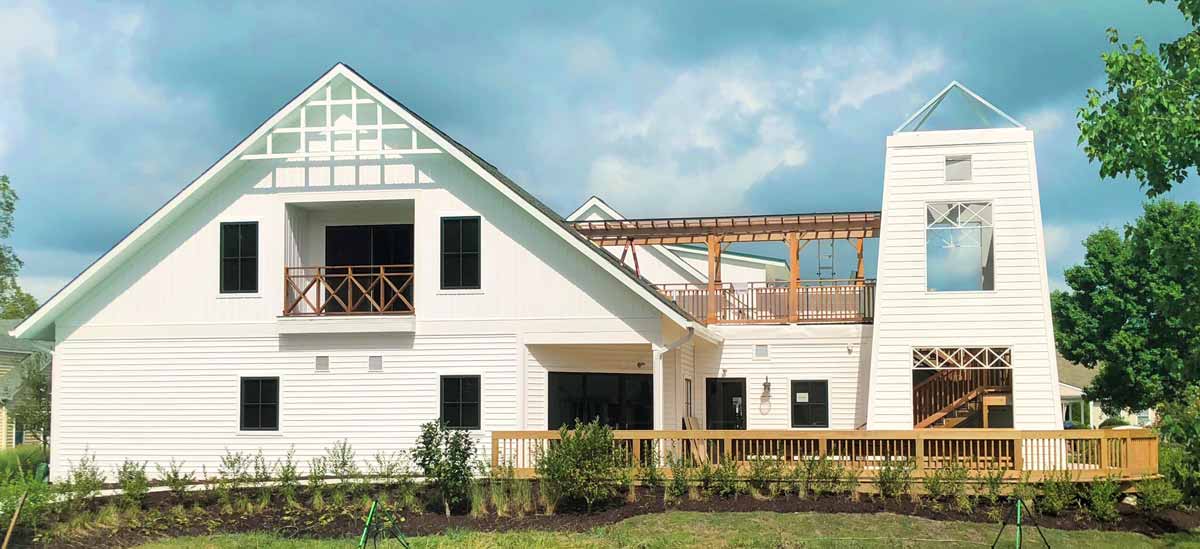
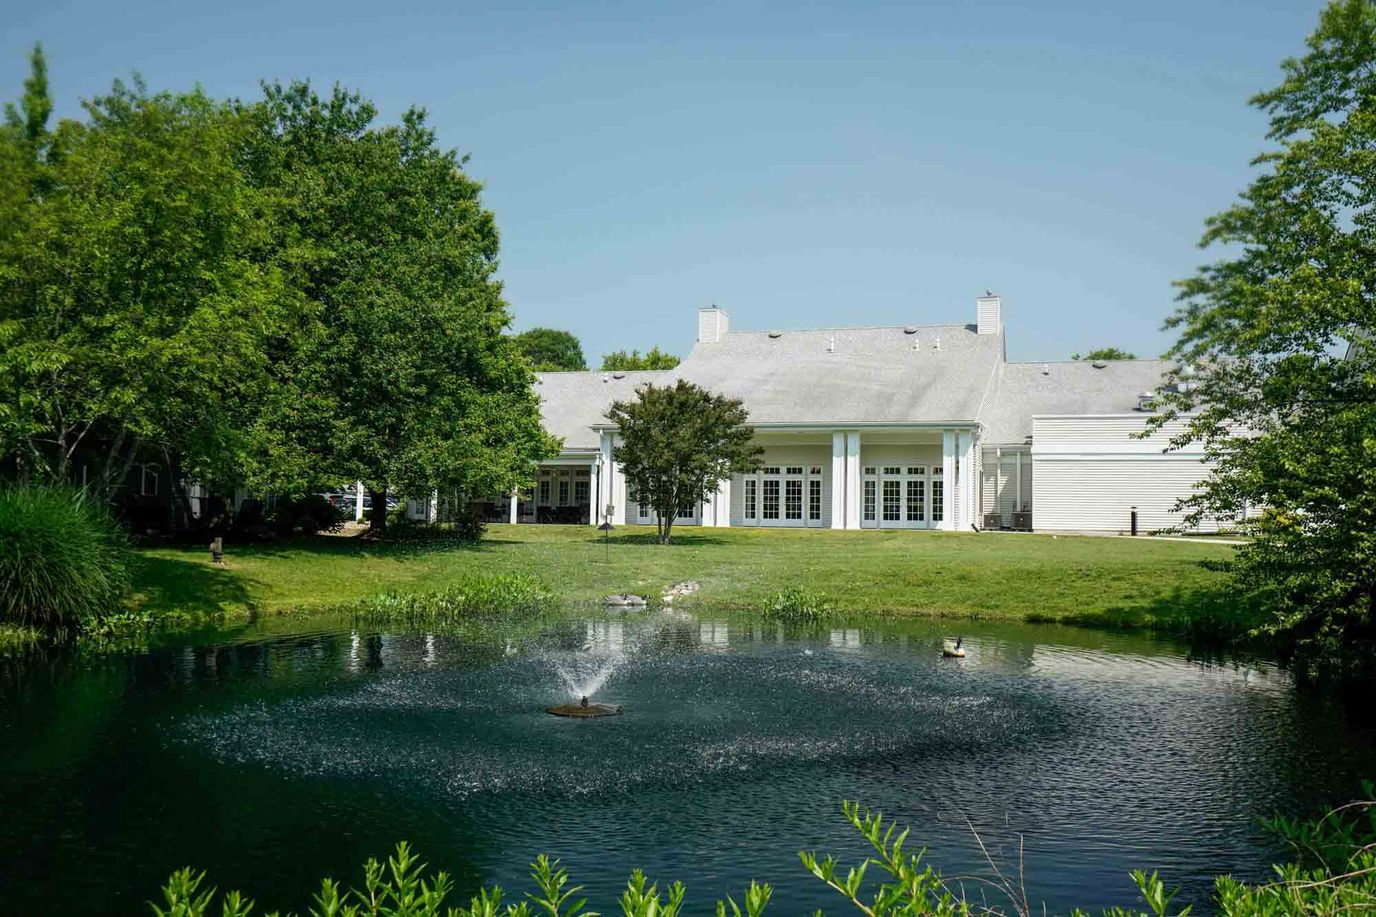
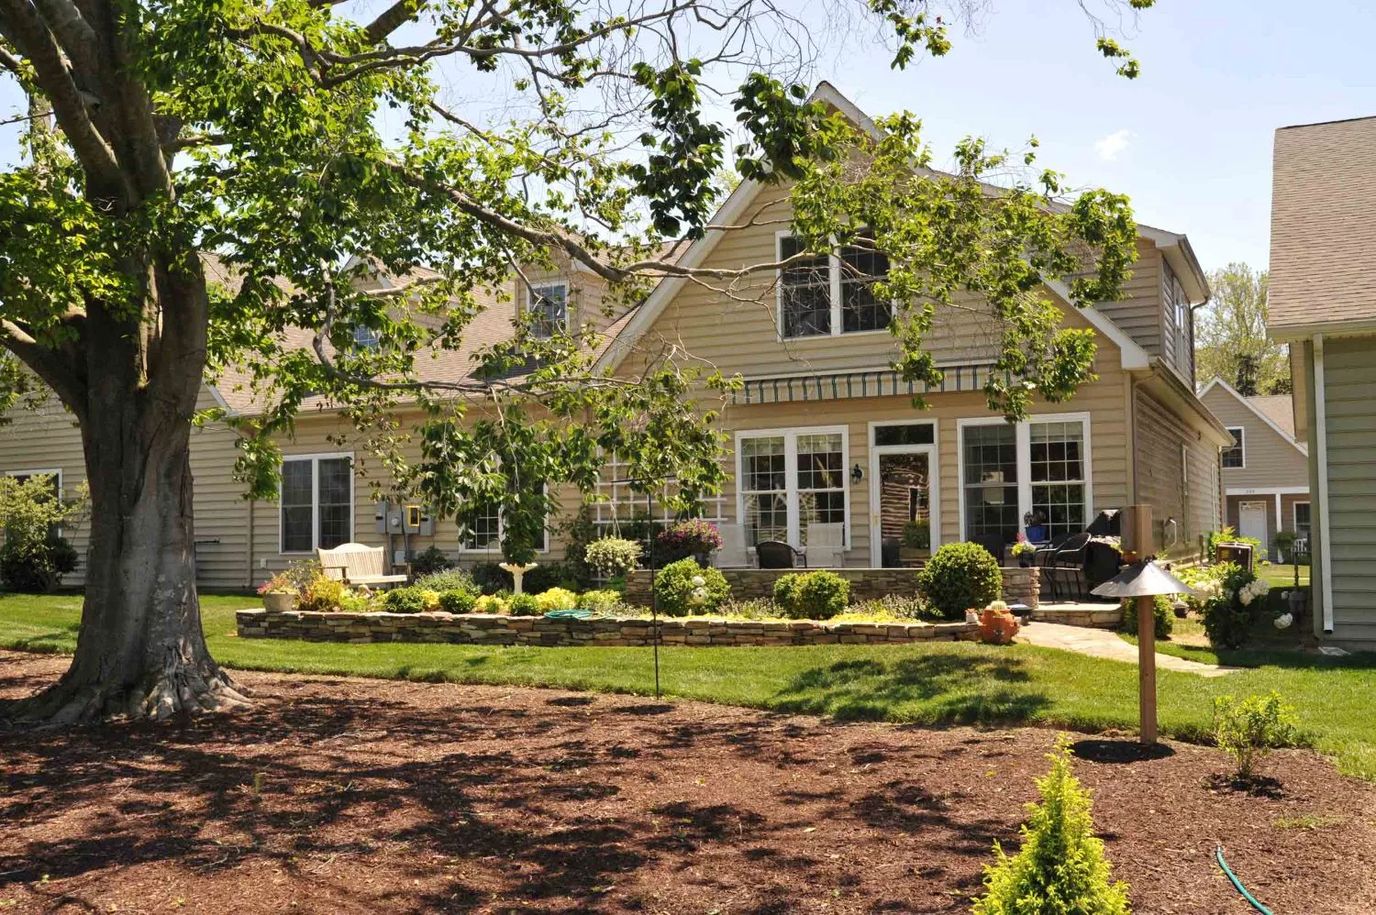
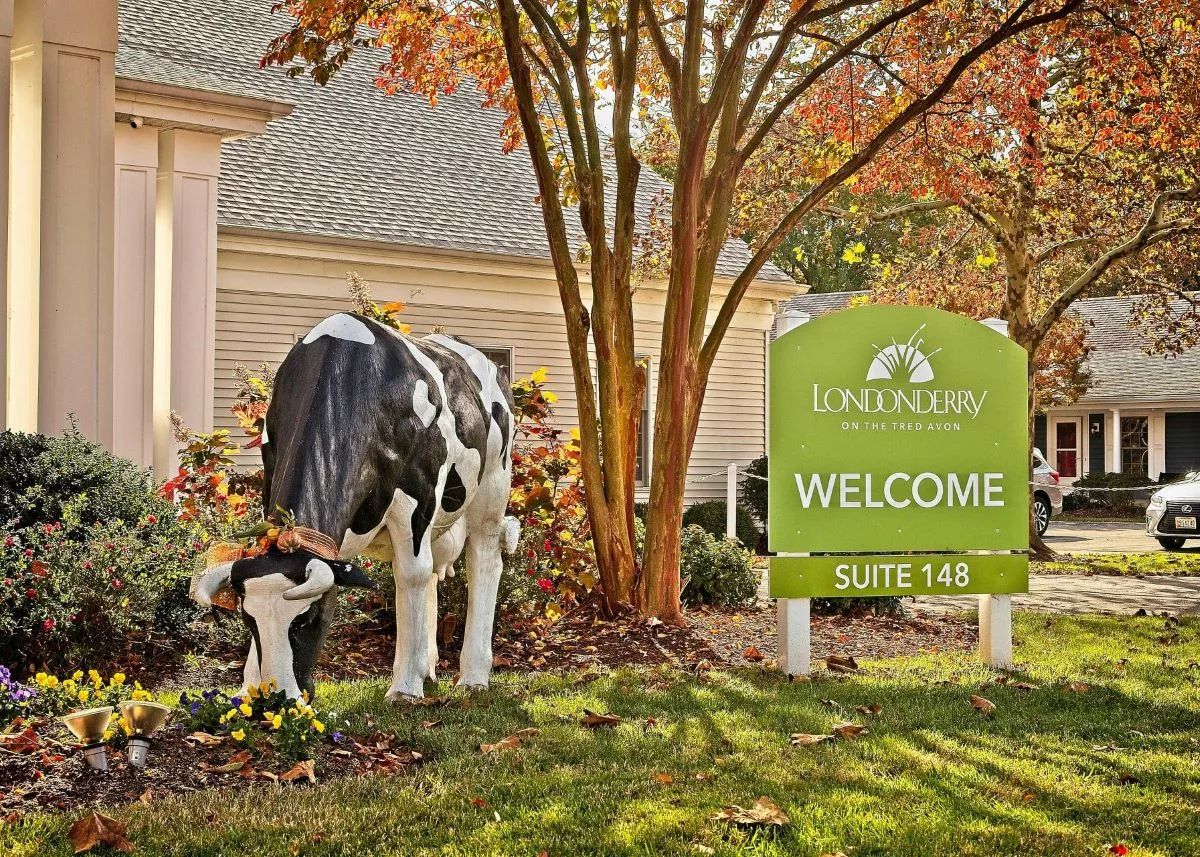
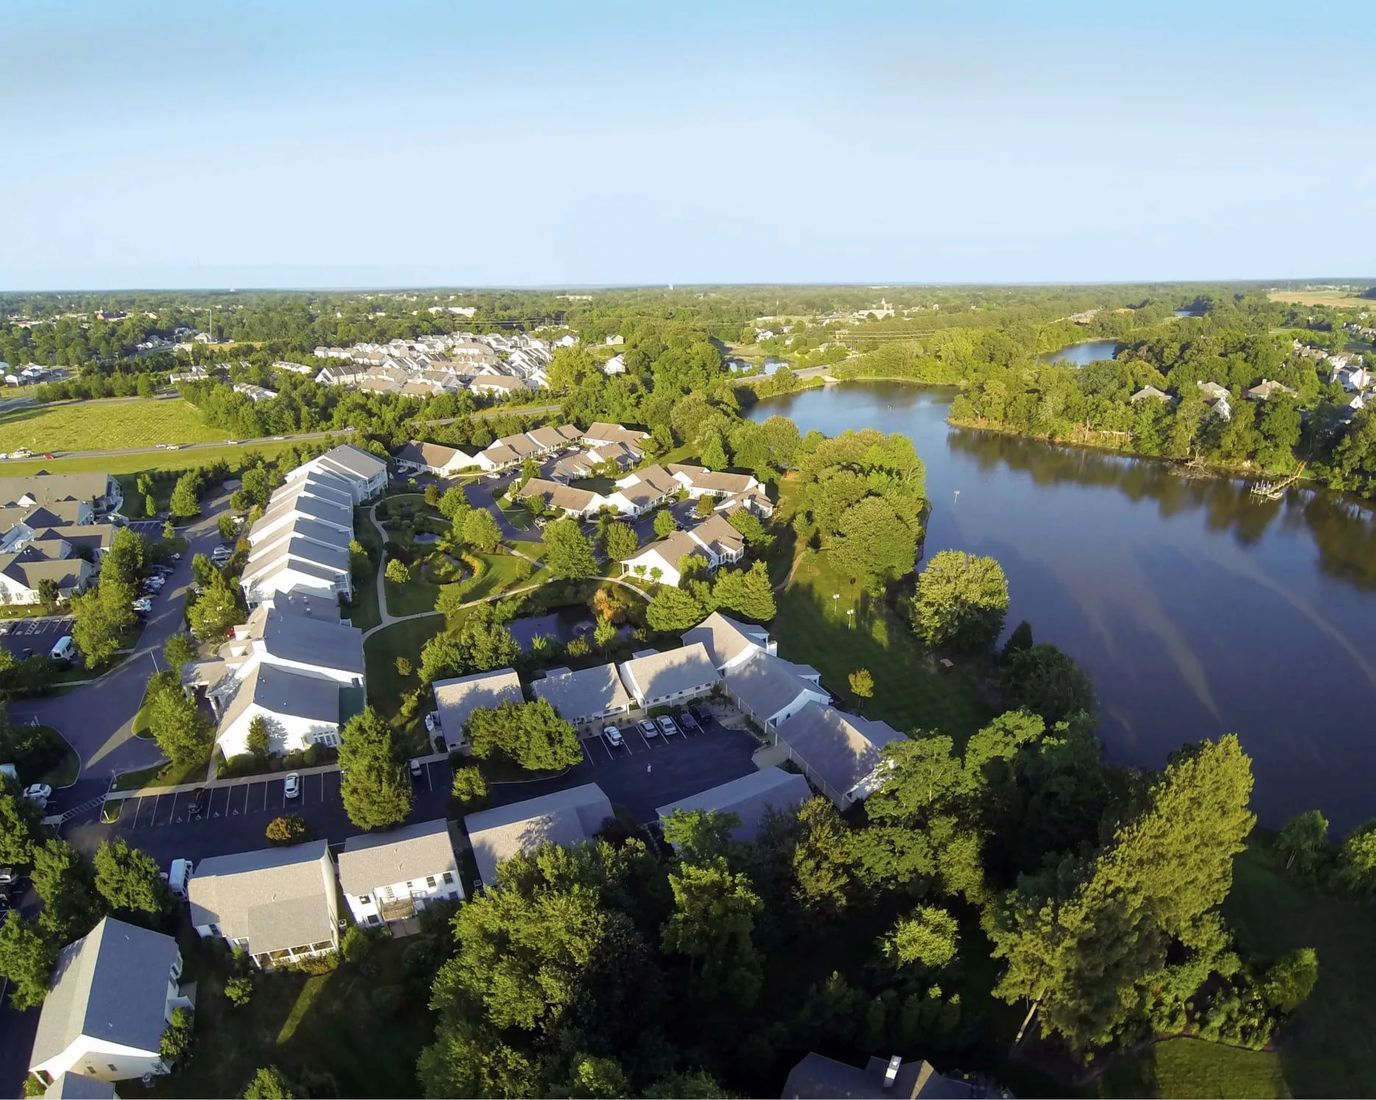
Overview of Londonderry on the Tred Avon

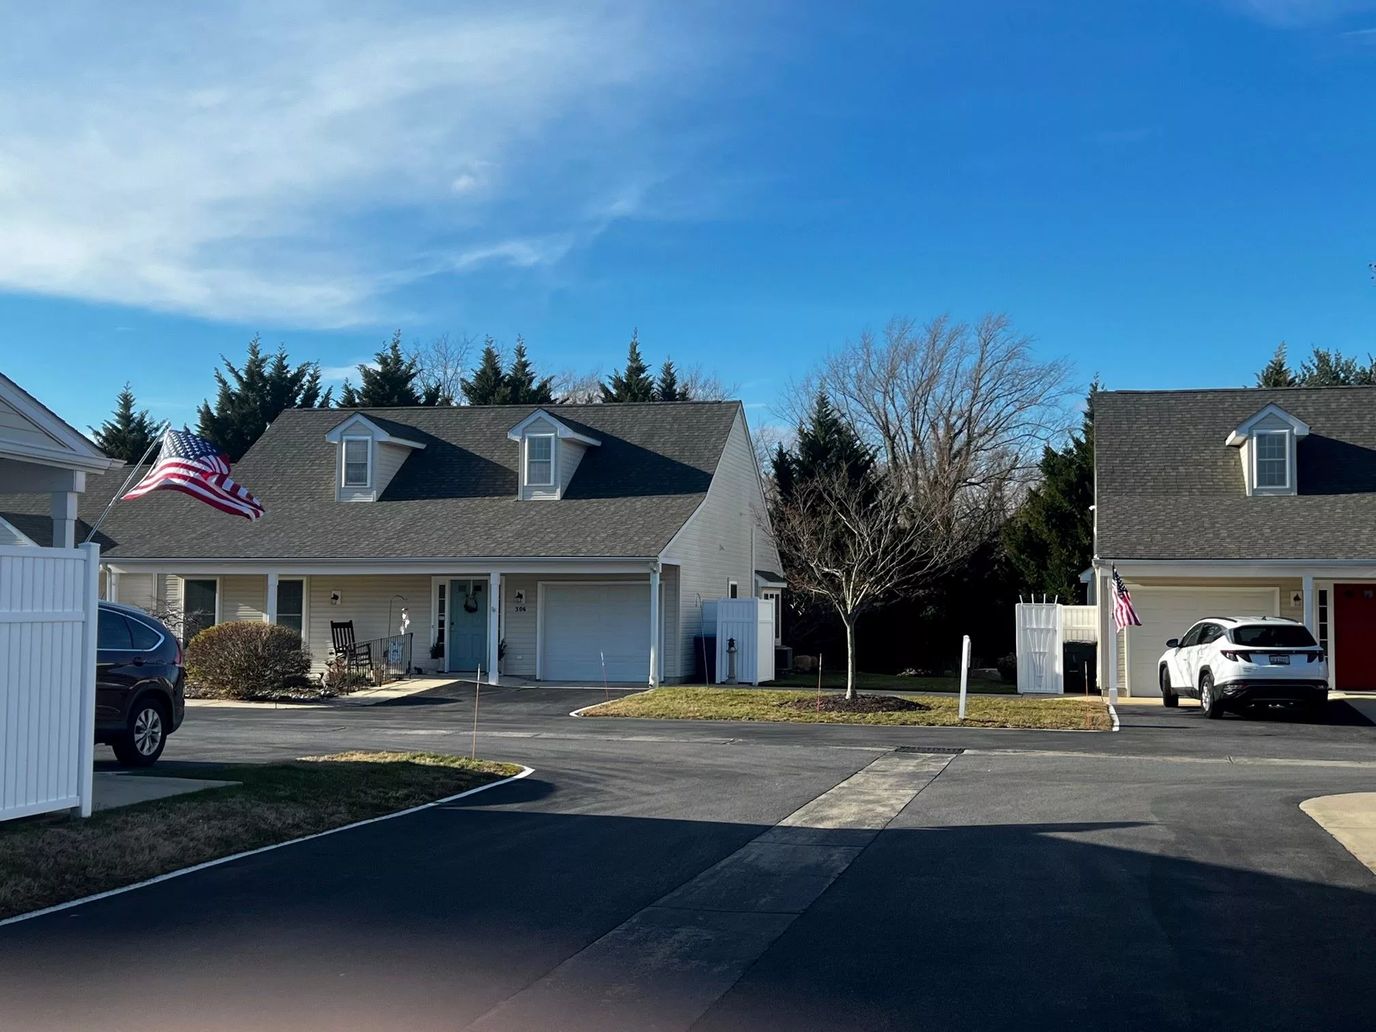
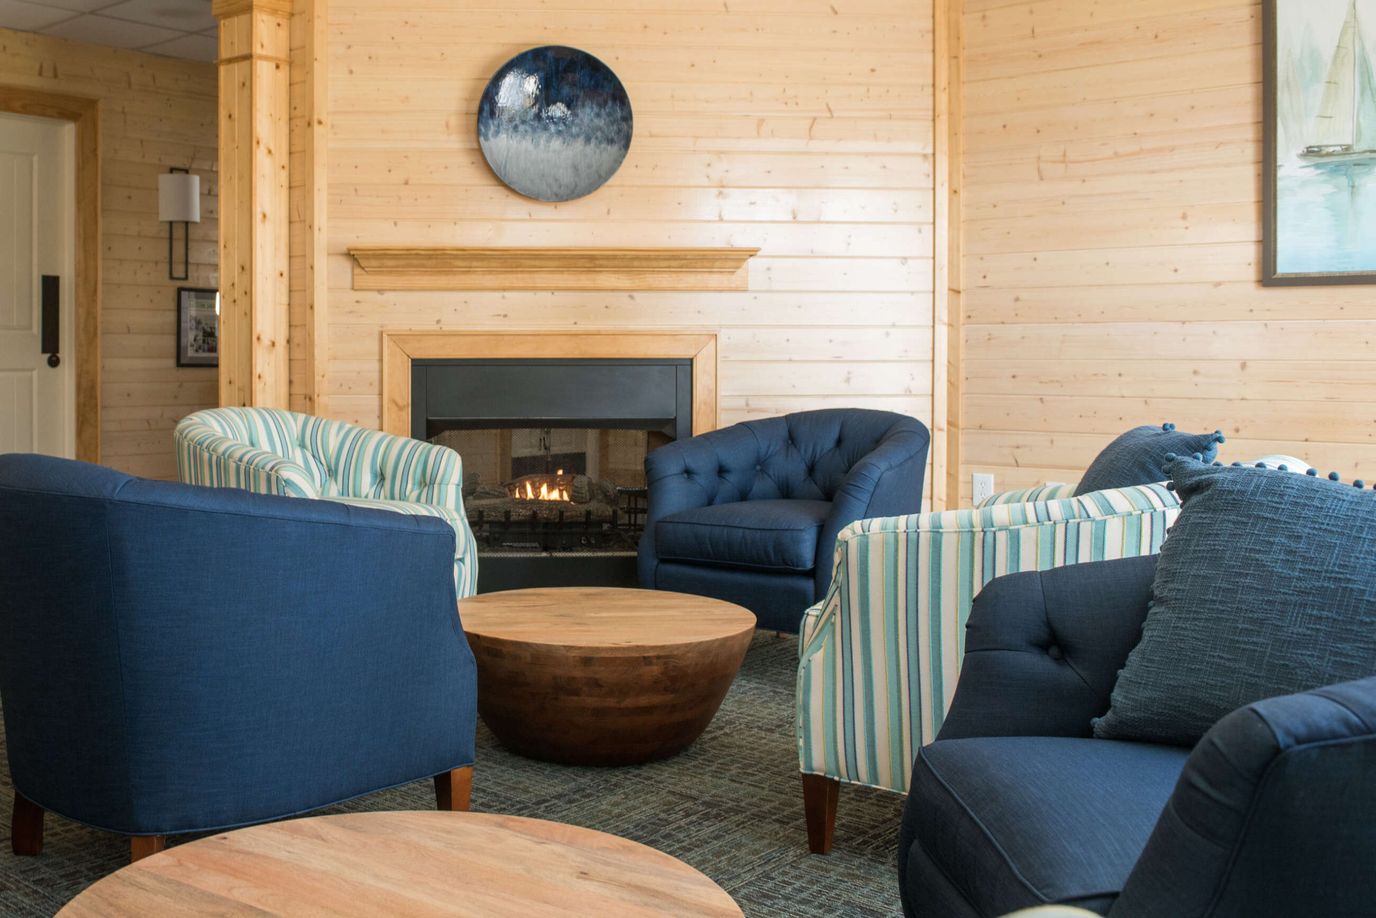
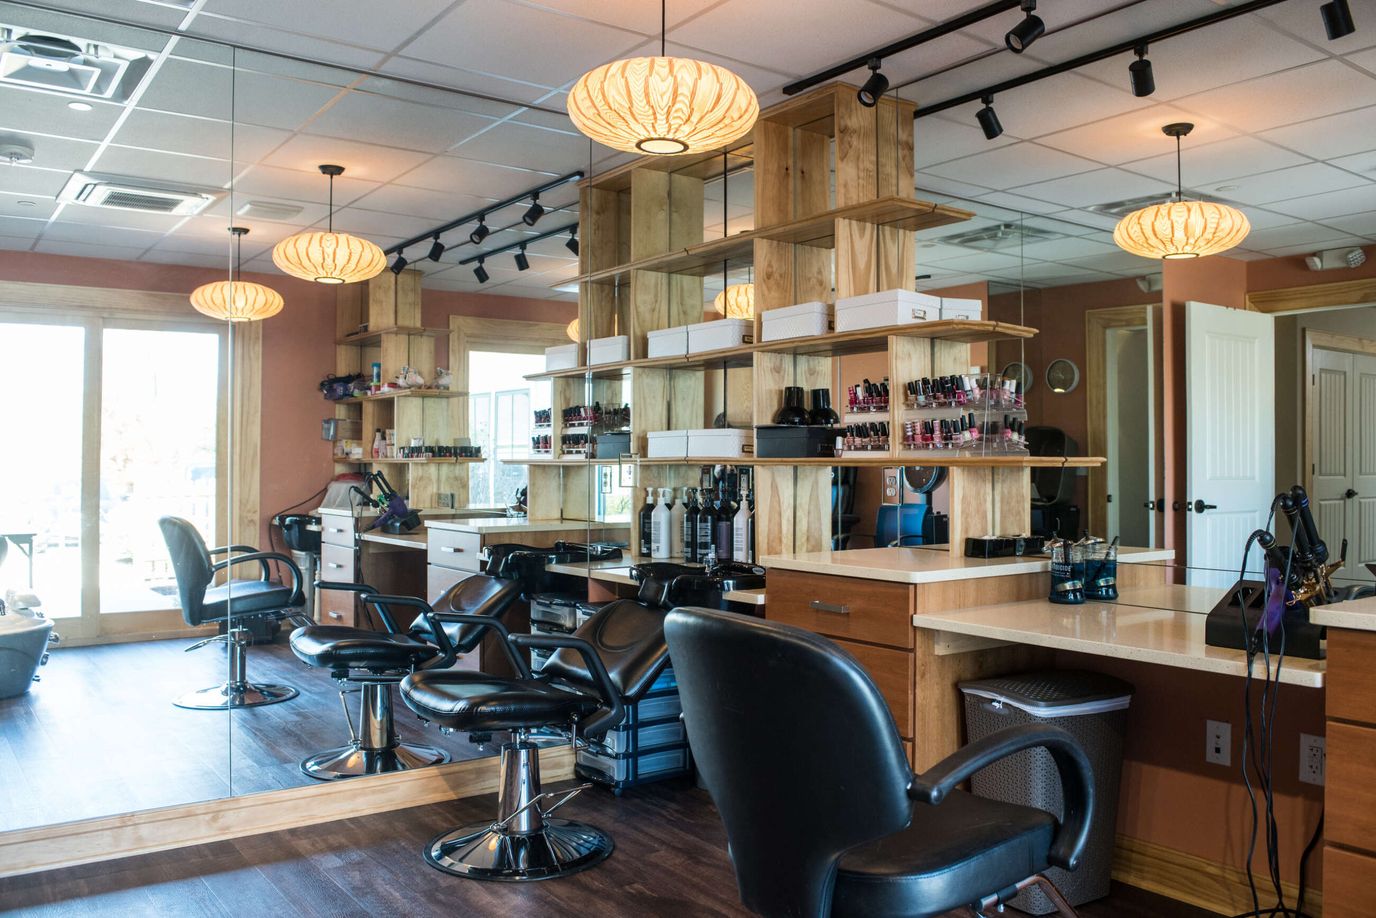
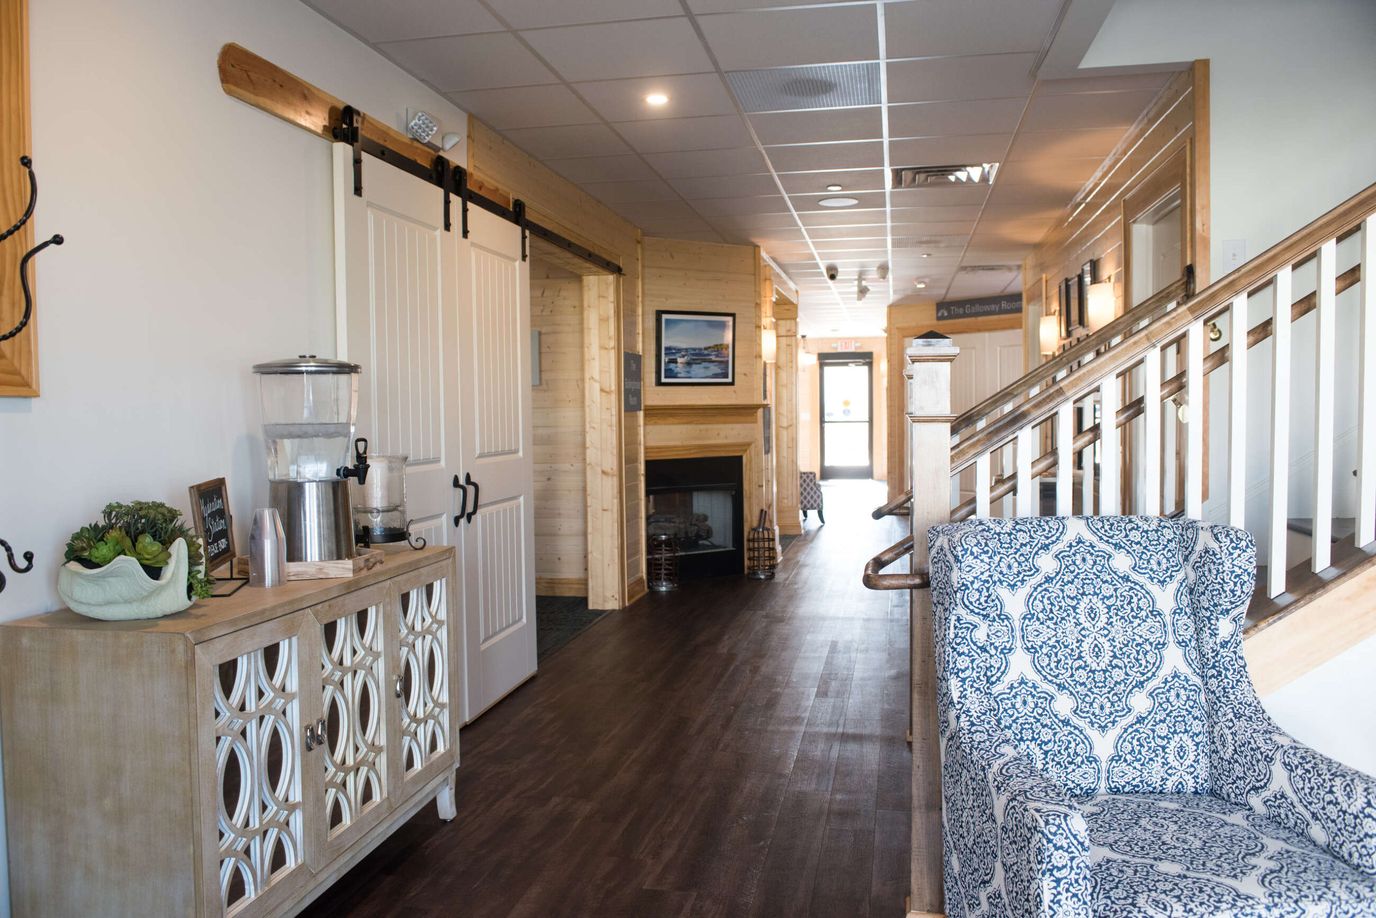
Londonderry on the Tred Avon is an upscale, active 62+ senior living community that provides cottages and apartment housing options. Residents maintain an engaging and active lifestyle throughout. The community’s specially trained staff is committed to helping seniors achieve complete independence while maintaining a purposeful life. Management ensures that residents are given compassionate care and commitment to provide a home-like environment.
For over 30 years, Londonderry has been considered the hub for active senior living. Community accommodations include life-enriching programs and engaging activities that encourage residents to maintain independence. These include The Tred Avon Tavern, a restaurant dining experience, a coffee bar, a library, and an activities center– to name a few.
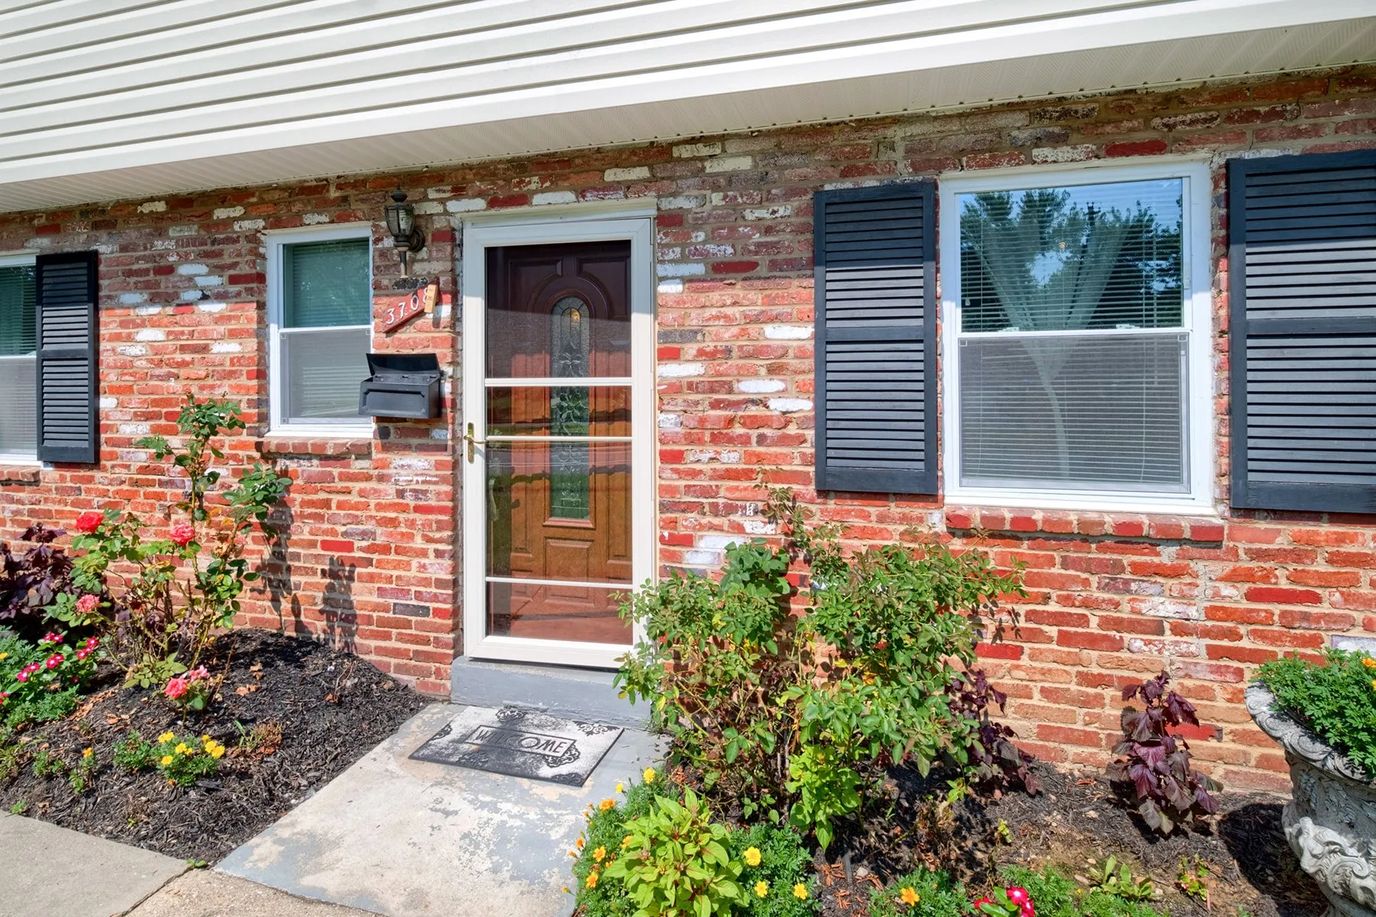
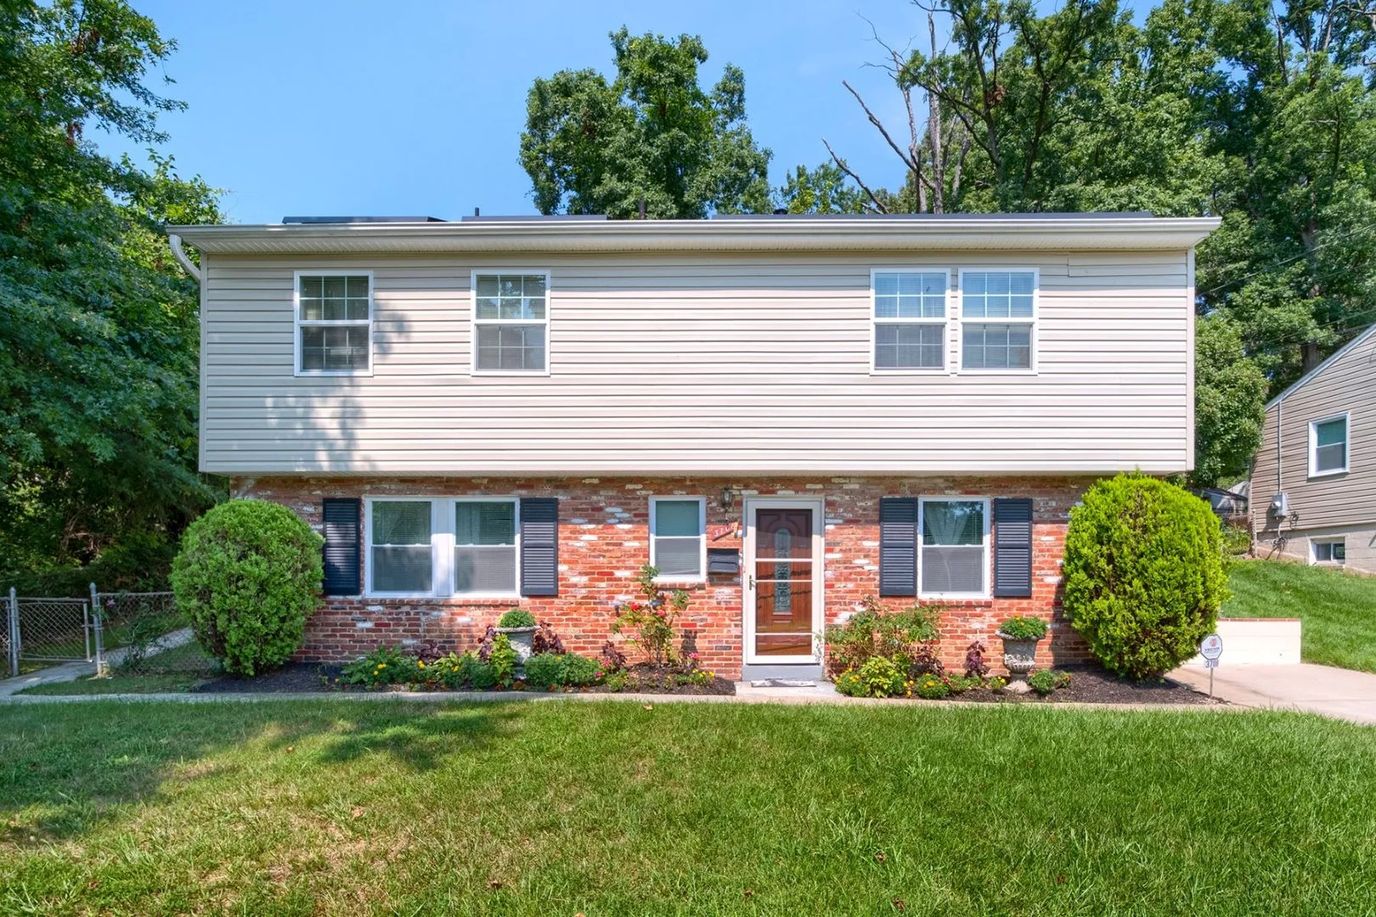
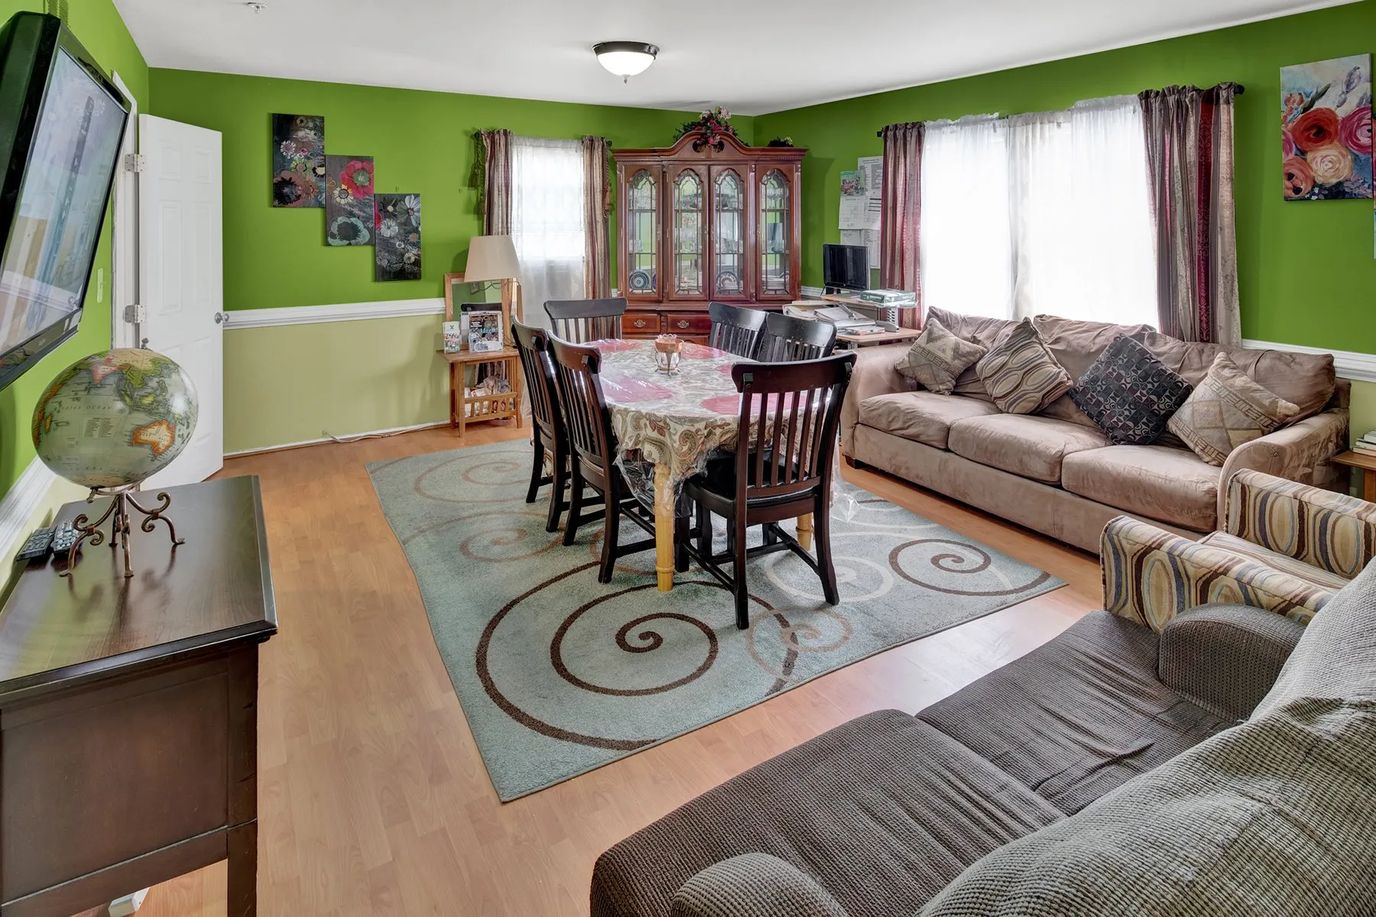
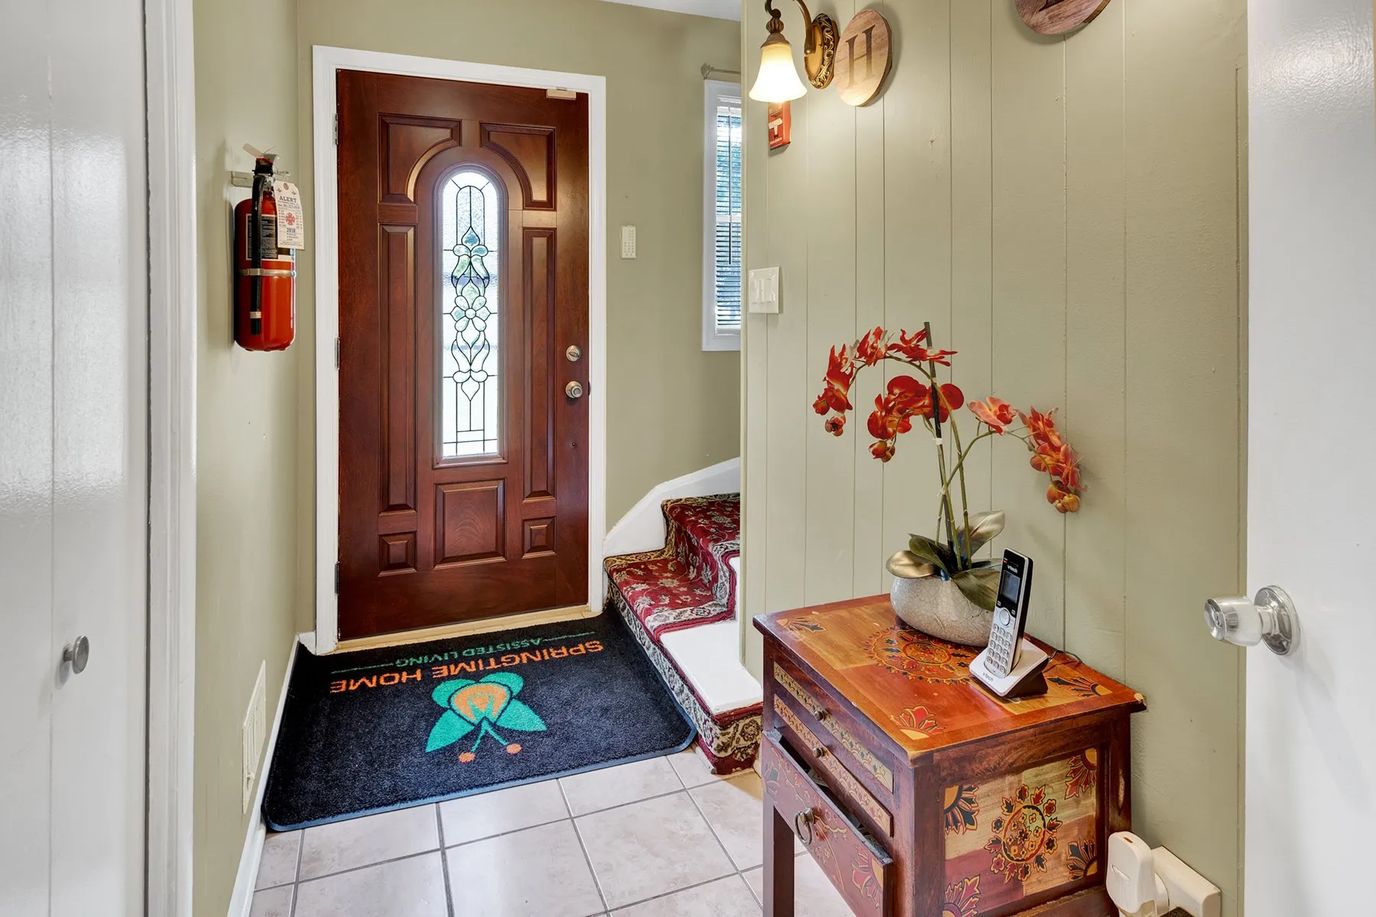
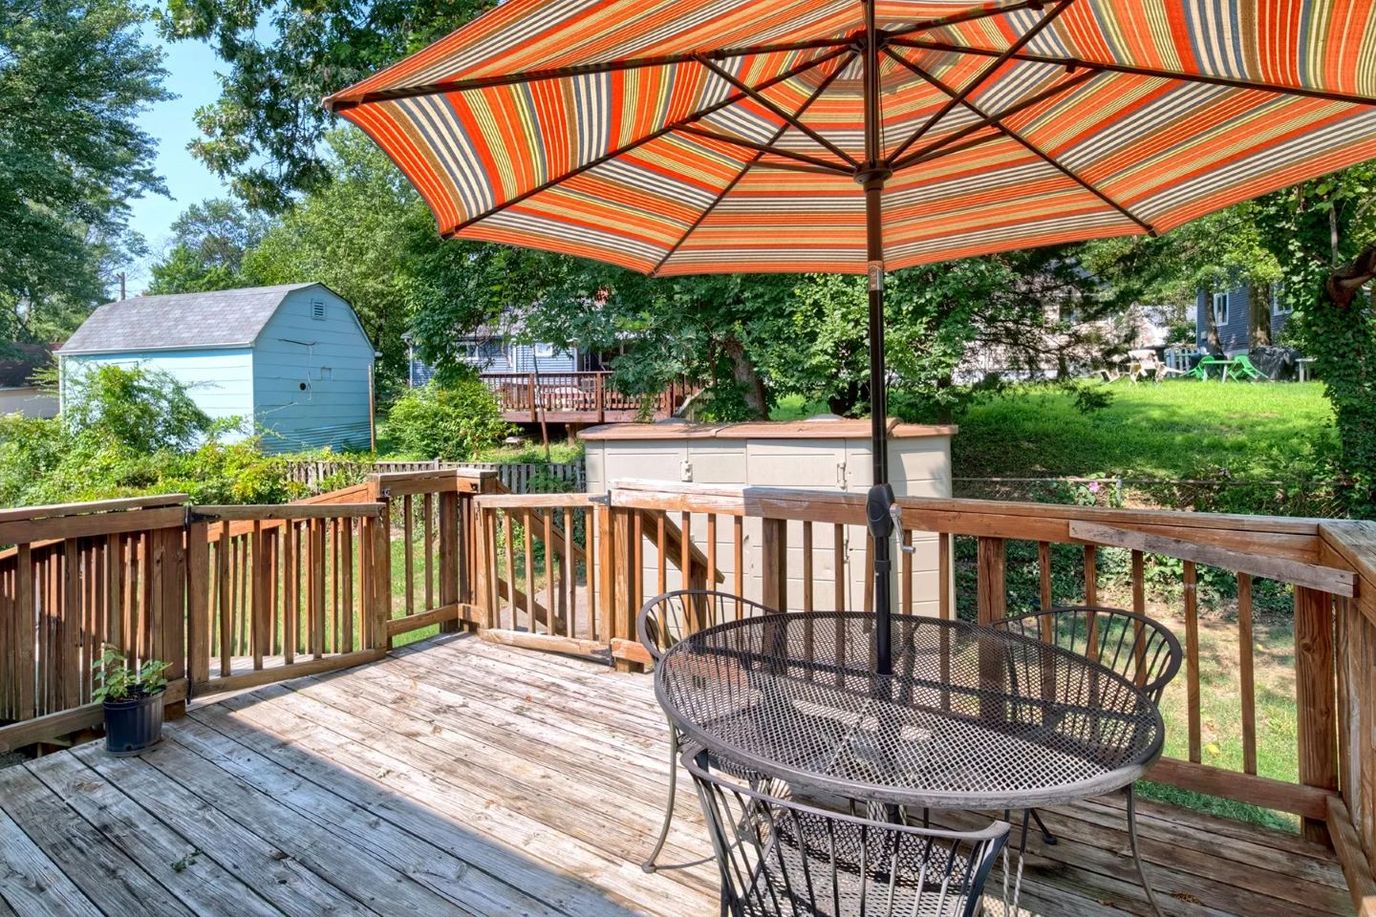
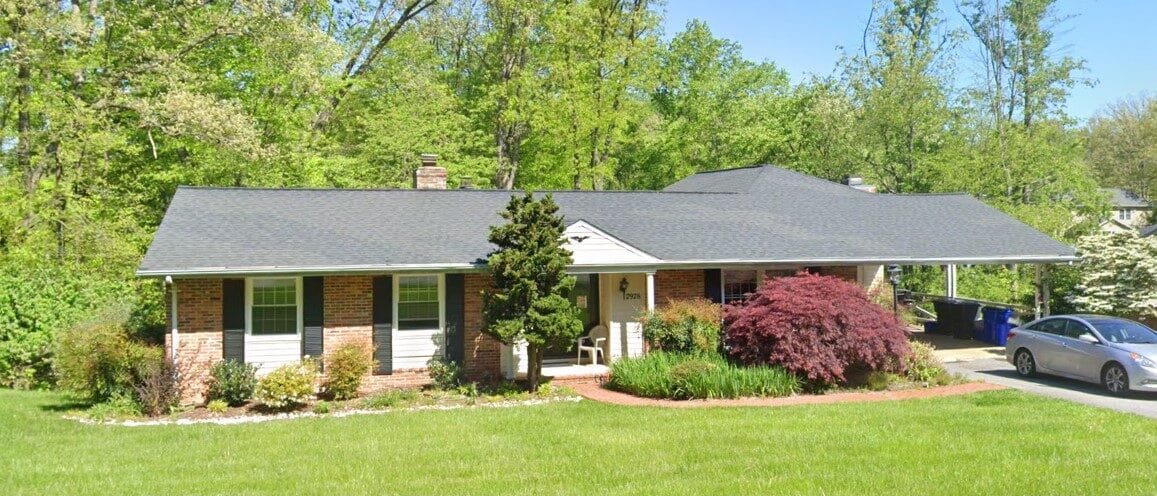
Overview of Springtime Home I

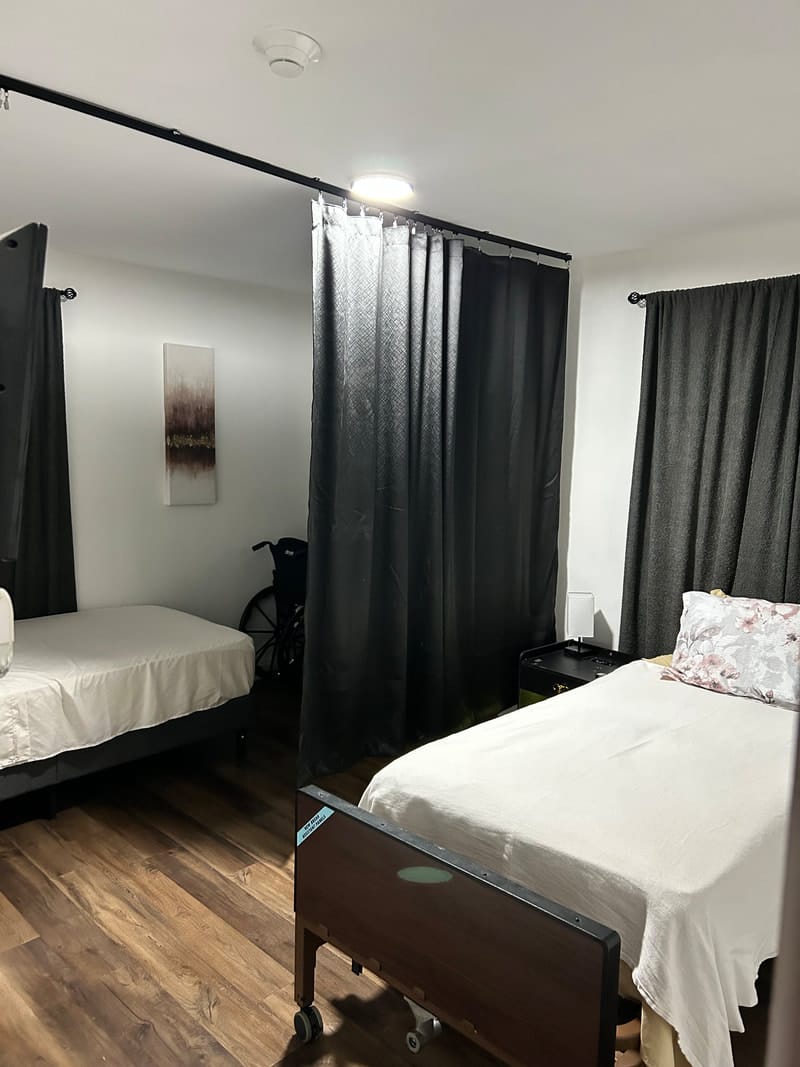
Springtime Home I, located at 3708 Warner Avenue, Hyattsville MD 20784, is an esteemed senior living community offering exceptional assisted living services. Here, individuality and independence are celebrated, while a dedicated team takes care of the details. The community features a warm and secure environment, making senior living transition easy and smooth. Moreover, residents are assured to receiving a loving care from a helping hand throughout their stay.
With its top-of-the-line amenities and services, residents can enjoy socializing, staying fit and healthy, and monitoring of meals in this community. Services such as medication reminders or administration bathing and shower assistance as needed, and laundry assistance are also available for Level 1 residents. Meet new companions and create lasting memories by engaging in a lively calendar of social, recreational, and religious activities and programs. At Springtime Home I, seniors are assured of a wondrous retirement.
Beautifully situated near Chinquapin Run in Baltimore, MD, The Millennium Assisted Living is an idyllic haven that offers assisted living. Here, residents receive top-tier support for their daily living activities from a respectful and highly qualified team available around the clock. Cleaning, laundry, and other household chores are also taken care of, ensuring residents experience a hassle-free living.
Dedicated to residents’ leisure and wellness, a variety of engaging activities and exciting events are conducted. Mealtimes also promote social interactions while satisfying dietary needs with well-balanced dining options. Medication management and transportation services are also provided for convenience and safety. The community is a good option for those seeking comfort in retirement, especially with its supportive and friendly setting.
Overview of White Oak Villages at Normandy

Conveniently located in the harmonious neighborhood of Normandy Drive, Ellicott City, MD, White Oak Villages at Normandy is a distinct community that offers assisted living, memory care, respite care, and hospice care. Dedicated to improving residents’ welfare, the community provides top-tier care and assistance tailored to their unique needs 24/7. Here, residents enjoy a maintenance-free lifestyle, with the community handling their day-to-day activities and personal needs.
Fun activities and stimulating programs are also conducted for residents to remain active and socially connected. Nutritious meals are necessary to keep residents healthy, so the community serves delightful and healthy meals that cater to their dietary needs and preferences. Here, residents do not have to worry about their unique needs with the community’s comprehensive care and nurturing environment.
Overview of Cona

Maintain your independence in retirement at Cona LLC, a distinguished community in Bowie, MD, offering assisted living. Focusing on residents’ mental health and psychiatric needs, the community provides top-notch assistance to help with their daily living activities around the clock. Residents are guaranteed the utmost comfort and safety purposely built and secure accommodations.
To improve residents’ moods and well-being, a jam-packed calendar of engaging activities and stimulating programs is conducted. Mealtimes also foster comfort and satisfy dietary needs with delicious and healthy dining options. The community’s nurturing and welcoming environment creates the ideal setting for residents to make the most of their best years.
Experience a vibrant lifestyle at Loving Hands & Heart Assisted Living LLC, a distinguished community in Baltimore, MD, that offers assisted living. The community also features carefully designed and cozy accommodations, ensuring residents’ comfort and familiarity. With a respectful and well-trained team available around the clock, residents receive top-notch assistance for their daily living activities and household tasks around the clock.
Prioritizing residents’ happiness and wellness, a jam-packed calendar of fun recreational activities and enriching programs is conducted. Residents also delight in delicious and well-balanced dining options that cater to their dietary needs and preferences. The community strives to maintain residents’ dignity and independence, with high-quality services and vast outdoor spaces.
Cozy Cove Home Care LLC is an assisted living community in Baltimore, MD, offering assistance with daily living activities and memory care. The community also promotes a nurturing, welcoming environment to ensure older adults’ comfort and safety. With three nutritious meals daily, housekeeping, laundry, medication management, and transportation services, residents can maintian their independence. Along with comprehensive services, personalized care plans are also provided to improve residents’ quality of life.
Cultural programs, social activities, and light exercises help residents maintain holistic wellness and live actively. Prioritizing accessibility and comfort, the community also features thoughtfully curated amenities and spacious gathering areas. With the Village Medical Center, a grocery, parks, and public transportation in the area, residents are guaranteed easy access to necessities and leisure. As one of the trusted choices for senior living in Maryland, this assisted living community ensures older adults receive the utmost care they need.
Overview of Residences at Creekside (village at Robinwood)
Residences at Creekside is a 90-bed senior living community at 19800 Tranquility Circle in Hagerstown, Maryland, serving Washington County. Situated within the Village at Robinwood campus, the for-profit community offers a full continuum of care, including independent living, assisted living, skilled nursing, and rehabilitation services.
The Maryland Department of Health, Office of Health Care Quality, oversees regulatory compliance for the facility. While the current source data does not list a specific deficiency history, the community maintains a citations-per-inspection rate of zero. Furthermore, federal records indicate that no civil money penalties or payment denials have been imposed by CMS within the past three years. This lack of reported enforcement actions suggests a stable regulatory standing, though families should verify the full inspection history directly with state authorities.
Nursing and professional care staff are available to support residents across the care continuum, with a particular focus on on-site rehabilitation for those requiring post-acute clinical support. Because specific data points such as staffing ratios, licensed nurse hours, and quality measures, like fall rates or pressure ulcer prevalence, are not currently reported, these represent significant information gaps. Clinical services are integrated into the larger village campus to facilitate transitions between residential and skilled nursing environments.
The community features a residential model designed for long-term stability, allowing residents to age in place as their medical needs evolve. Specific details regarding dining programs, all-inclusive utility packages, and daily social activities are not publicly listed in the current data set.
Shared community spaces and campus-wide security are standard for this level of care, but families must inquire about specific apartment square footage and safety features. Scheduled transportation and housekeeping services are common in such multi-level campuses, yet these should be confirmed during an on-site visit.
The availability of multiple care levels on a single campus provides a predictable path for long-term residency. Individuals evaluating Residences at Creekside should confirm the current license status, Medicaid acceptance, and the facility’s most recent comprehensive survey results directly with the Maryland Department of Health before making a placement decision.
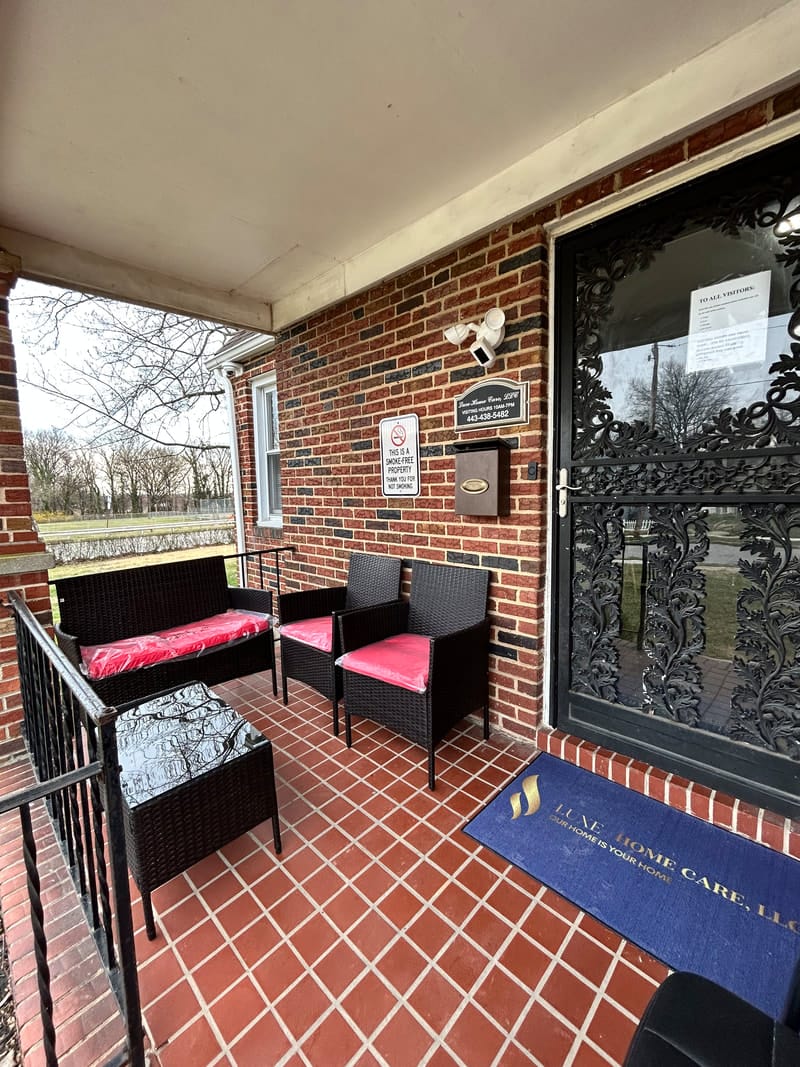
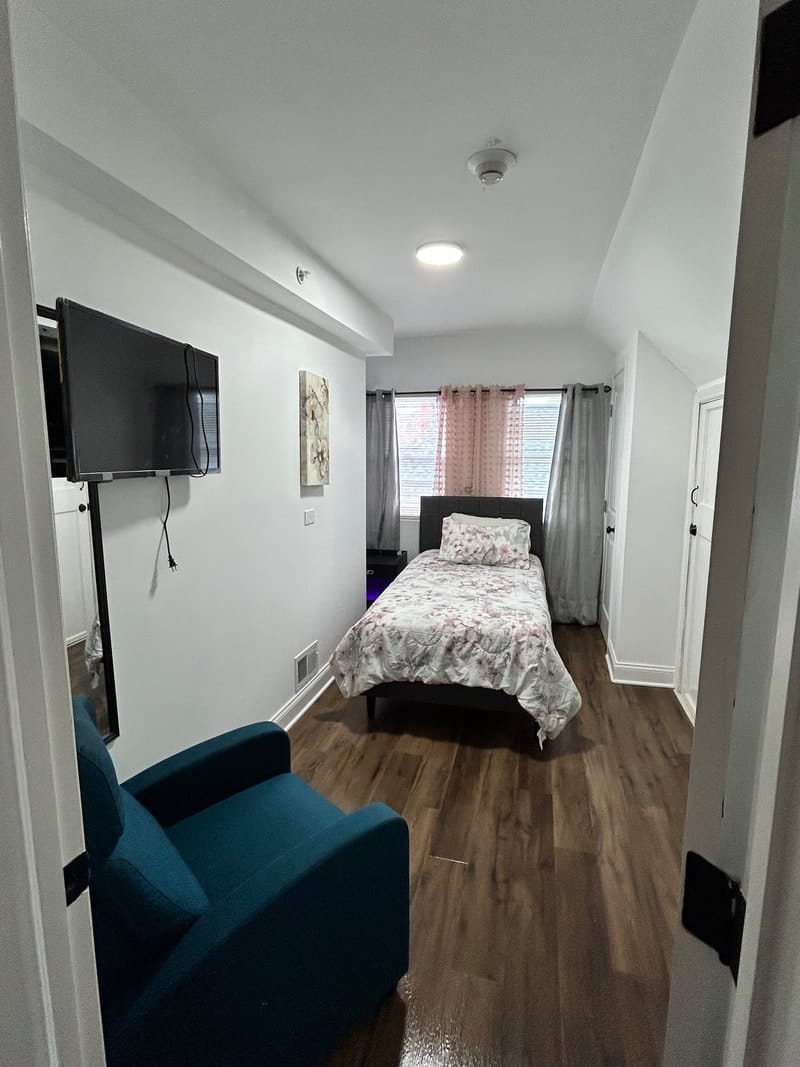
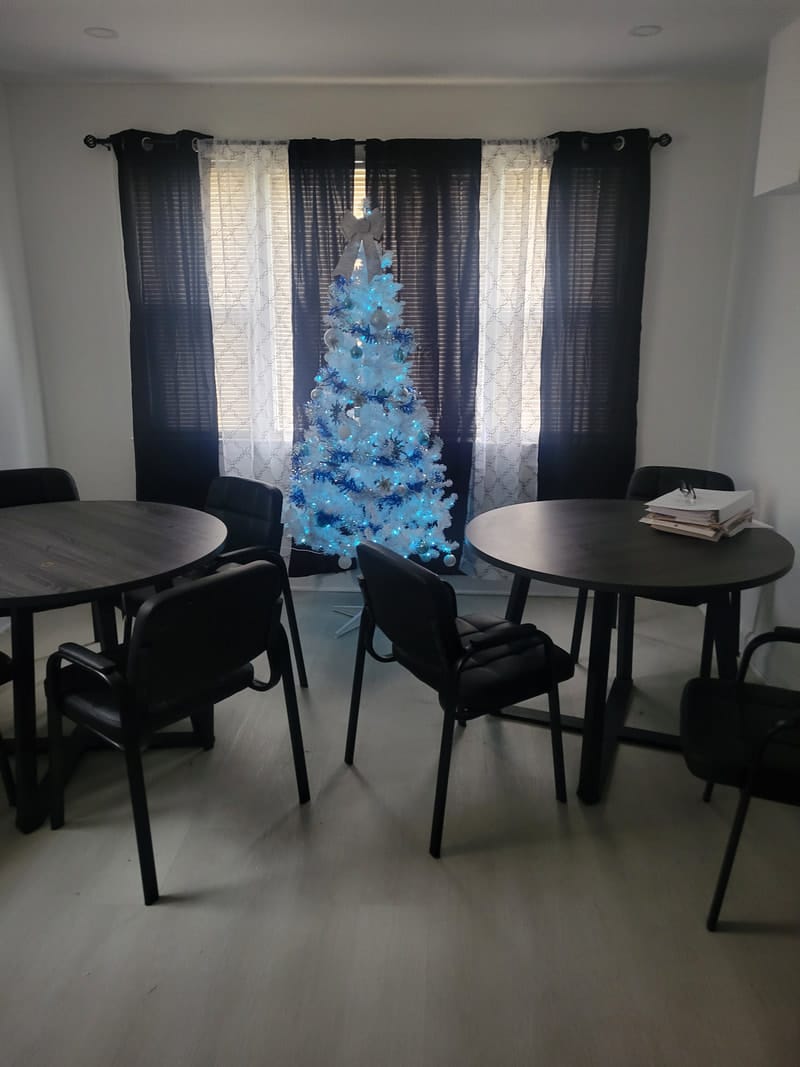
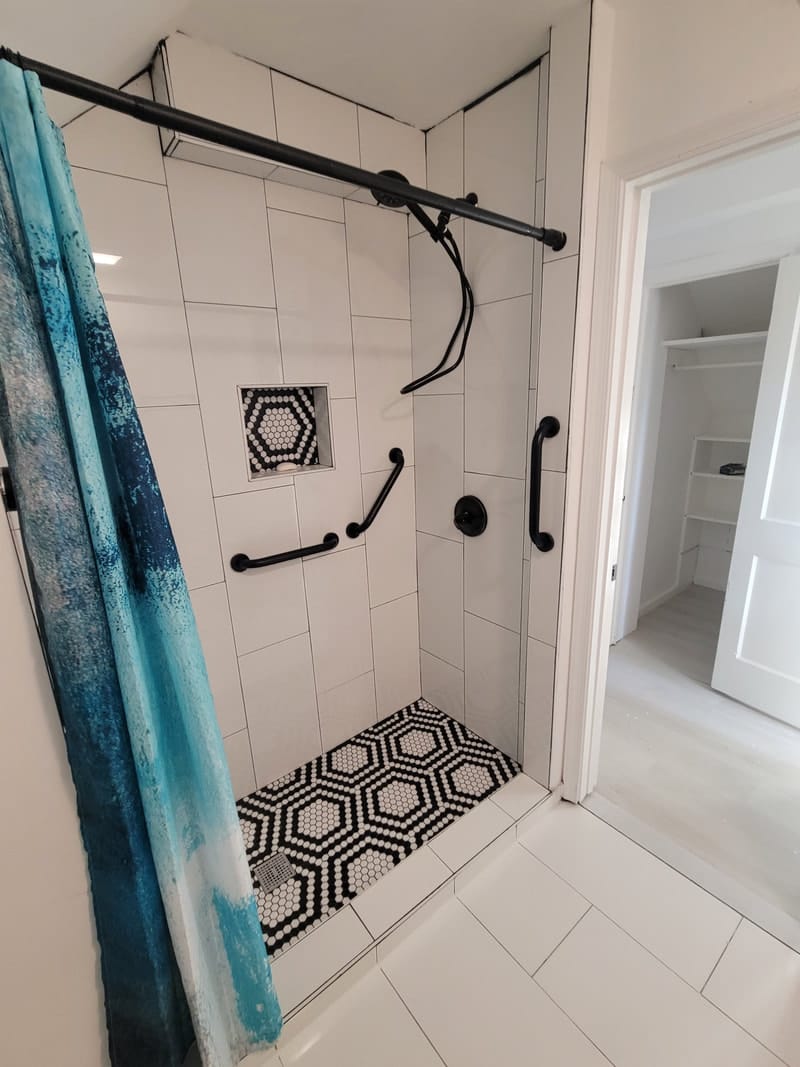
Luxe Home Care, LLC is an assisted living community in Parkville, MD, offering personal care. Providing a comfortable and home-like environment, the community ensures older adults are treated well throughout their stay. 24-hour care, medication administration, meal preparation are also provided to enrich residents’ living experiences. The community also provides personalized care plans to meet residents’ unique needs and preferences.
Game nights, outings, and social activities are thoughtfully curated to promote socialization and encourage residents to live actively. Television, cable services, and internet access. Situated in the tree-lined neighborhood of Parkville, the community ensures residents have a laid-back lifestyle. With its commitment to older adults’ well-being, this assisted living community is an ideal option for senior living in Maryland.
Conveniently located in the thriving neighborhood of Baltimore, MD, My House Assisted Living Facilities is a distinguished community that offers assisted living. Residents can keep their peace of mind with a respectful and well-trained team that assists with their daily activities and personal needs around the clock. With accessible and beautifully furnished accommodations, residents can feel a sense of belonging during their stay.
Residents meet new friends and live an active lifestyle with fun activities and engaging wellness programs. A variety of dining options are served to meet residents’ dietary needs and preferences. The community creates an ideal setting for residents’ recreation and wellness with its state-of-the-art amenities and welcoming setting.
Ranking Methodology
How we rank these communities
Every community above is evaluated across six weighted categories using public data including state inspection records, review platforms, BBB profiles, and operator-published materials.
Weighting overview
- 35%Resident Experience
- 25%Regulatory
- 15%Visual Media
- 10%Website
- 10%Stability
- 5%Environment
01
Resident & Family Experience 35%
The single largest share of every ranking. Aggregated review sentiment and volume from major platforms — the closest signal to real resident experience.
- Includes
- Review Sentiment
- Review Volume
02
Regulatory & Safety Record 25%
State inspection records, citations, and complaint visits. We weight per-inspection rates more heavily than raw counts.
- Includes
- State Inspections
- Citations/Inspection
- % Inspections w/ Citations
- Complaint Visits
- Accreditations
- BBB Rating
03
Visual Media & Transparency 15%
Communities that publish high-quality visuals give families a real preview. No photos or tours = a negative transparency signal.
- Includes
- Video Tours
- Virtual Walkthroughs
- Photo Quantity
- Photo Quality
04
Website & Operator Transparency 10%
Site quality and whether the operator publishes basic accountability information — staff names, contact details, ownership.
- Includes
- Website Content
- Mobile Usability
- Staff Info Available
- Owner Info Available
05
Community Stability 10%
Operational signals indicating whether a community is well-run and meeting demand.
- Includes
- Occupancy Rate
- Bed Options
06
Environment & Pricing 5%
Walkability and pricing transparency. Walk Score is weighted higher for Independent Living than for Memory Care, where most residents do not leave unaccompanied.
- Includes
- Walk Score
- Pricing Transparency
Nearby Cities
Who we are
Your Senior Care Partner, Every Step of the Way
We help families find affordable senior communities and unlock same day discounts, Medicaid, and Medicare options tailored to your needs.
Contact us Today
Updated on
