


Compare Senior Care around Maryland
Info below is compiled from the MD Dept. of Health (OHCQ), senior community websites & trusted data sources such as Walk Score & BBB.
Communities are listed from highest to lowest based on our ranking methodology.
| Bedford Court, a CCRC | SC AL HOS IL MC NH RC SNF | Silver Spring (International Drive) | 76
Facility
76
MD AVG
42
Rank
#174 / 685 | Yes |
64
Facility
64
MD AVG
43
Rank
#261 / 985 | Studio / 1 Bed | 34
Facility
34
MD AVG
21
Rank
#22 / 210 | - |
15% Male Residents — State Benchmarked 15% of residents are male, compared to the Maryland average of 31%. This facility caters to a majority female resident pool (85% female), consistent with the broader assisted living trend where women significantly outnumber men. |
85% Female Residents — State Benchmarked 85% of residents are female, compared to the Maryland average of 69%. Women comprise the large majority, consistent with national assisted living demographics where women live longer and enter care facilities at higher rates. |
95% White Residents — State Benchmarked 95% of residents are reported as White, compared to the Maryland average of 81%. A higher White share than is typical for assisted living in Maryland in this dataset — compare with peer facilities for local context. |
3% African American Residents — State Benchmarked 3% of residents are reported as African American or Black, compared to the Maryland average of 13%. A lower African American share than is typical in Maryland; local markets still vary widely. |
2% Other Ethnicity Residents — State Benchmarked 2% of residents fall into categories other than White or African American (combined), compared to the Maryland average of 6%. This column aggregates Hispanic, Asian, multiracial, and any other labeled groups that are not classified as White or African American. Reported subgroups in this total: Asian (2%). |
2% Residents Age 65–74 — State Benchmarked 2% of residents are 65–74, compared to the Maryland average of 13%. Fewer younger seniors suggests the resident population skews older, likely requiring higher acuity care and more hands-on support. |
8% Residents Age 75–84 — State Benchmarked 8% of residents are 75–84, compared to the Maryland average of 31%. Below the state norm — the resident mix may skew either younger or older than this typical middle bracket. |
65% Residents Age 85–94 — State Benchmarked 65% of residents are 85–94, compared to the Maryland average of 44%. A high concentration of very elderly residents signals a higher-acuity facility with experience caring for advanced age-related needs. |
26% Residents Age 95+ — State Benchmarked 26% of residents are 95 or older, compared to the Maryland average of 16%. A high proportion of the oldest-old suggests strong end-of-life care experience and very-high-acuity capabilities. |
| Edenwald Senior Living | SC AL IL MC NH SNF | Towson (Southerly Road) | 94
Facility
94
MD AVG
42
Rank
#139 / 685 | No |
83
Facility
83
MD AVG
43
Rank
#70 / 985 | 1 Bed / 2 Bed | - | A+ |
18% Male Residents — State Benchmarked 18% of residents are male, compared to the Maryland average of 31%. This facility caters to a majority female resident pool (82% female), consistent with the broader assisted living trend where women significantly outnumber men. |
82% Female Residents — State Benchmarked 82% of residents are female, compared to the Maryland average of 69%. Women comprise the large majority, consistent with national assisted living demographics where women live longer and enter care facilities at higher rates. |
100% White Residents — State Benchmarked 100% of residents are reported as White, compared to the Maryland average of 81%. A higher White share than is typical for assisted living in Maryland in this dataset — compare with peer facilities for local context. |
0% African American Residents — State Benchmarked 0% of residents are reported as African American or Black, compared to the Maryland average of 13%. A lower African American share than is typical in Maryland; local markets still vary widely. |
0% Other Ethnicity Residents — State Benchmarked 0% of residents fall into categories other than White or African American (combined), compared to the Maryland average of 6%. This column aggregates Hispanic, Asian, multiracial, and any other labeled groups that are not classified as White or African American. | - |
13% Residents Age 75–84 — State Benchmarked 13% of residents are 75–84, compared to the Maryland average of 31%. Below the state norm — the resident mix may skew either younger or older than this typical middle bracket. |
53% Residents Age 85–94 — State Benchmarked 53% of residents are 85–94, compared to the Maryland average of 44%. A high concentration of very elderly residents signals a higher-acuity facility with experience caring for advanced age-related needs. |
35% Residents Age 95+ — State Benchmarked 35% of residents are 95 or older, compared to the Maryland average of 16%. A high proportion of the oldest-old suggests strong end-of-life care experience and very-high-acuity capabilities. |
| Lutheran Village at Miller’s Grant | SC AL IL NH SNF | Ellicott City (Lutheran Village At Miller’s Grant) | 36
Facility
36
MD AVG
42
Rank
#230 / 685 | Yes |
19
Facility
19
MD AVG
43
Rank
#746 / 985 | 1 Bed / 2 Bed | 21
Facility
21
MD AVG
21
Rank
#108 / 210 | - |
17% Male Residents — State Benchmarked 17% of residents are male, compared to the Maryland average of 31%. This facility caters to a majority female resident pool (83% female), consistent with the broader assisted living trend where women significantly outnumber men. |
83% Female Residents — State Benchmarked 83% of residents are female, compared to the Maryland average of 69%. Women comprise the large majority, consistent with national assisted living demographics where women live longer and enter care facilities at higher rates. |
83% White Residents — State Benchmarked 83% of residents are reported as White, compared to the Maryland average of 81%. Close to the average for this category among assisted living facilities in Maryland with reported race/ethnicity data. |
11% African American Residents — State Benchmarked 11% of residents are reported as African American or Black, compared to the Maryland average of 13%. In line with the Maryland average for African American residents among facilities reporting this breakdown. |
6% Other Ethnicity Residents — State Benchmarked 6% of residents fall into categories other than White or African American (combined), compared to the Maryland average of 6%. This column aggregates Hispanic, Asian, multiracial, and any other labeled groups that are not classified as White or African American. Reported subgroups in this total: Asian (6%). | - |
33% Residents Age 75–84 — State Benchmarked 33% of residents are 75–84, compared to the Maryland average of 31%. This is the second most common age bracket in assisted living, representing residents with moderate care needs. |
44% Residents Age 85–94 — State Benchmarked 44% of residents are 85–94, compared to the Maryland average of 44%. This is typically the most common age bracket in assisted living — this facility is in line with the statewide norm. |
22% Residents Age 95+ — State Benchmarked 22% of residents are 95 or older, compared to the Maryland average of 16%. A high proportion of the oldest-old suggests strong end-of-life care experience and very-high-acuity capabilities. |
| Friends House Retirement Community | SC AL IL NH SNF | Sandy Spring | 24
Facility
24
MD AVG
42
Rank
#242 / 685 | Yes |
6
Facility
6
MD AVG
43
Rank
#891 / 985 | - | 20
Facility
20
MD AVG
21
Rank
#112 / 210 | - |
6% Male Residents — State Benchmarked 6% of residents are male, compared to the Maryland average of 31%. This facility caters to a majority female resident pool (94% female), consistent with the broader assisted living trend where women significantly outnumber men. |
94% Female Residents — State Benchmarked 94% of residents are female, compared to the Maryland average of 69%. Women comprise the large majority, consistent with national assisted living demographics where women live longer and enter care facilities at higher rates. |
94% White Residents — State Benchmarked 94% of residents are reported as White, compared to the Maryland average of 81%. A higher White share than is typical for assisted living in Maryland in this dataset — compare with peer facilities for local context. |
0% African American Residents — State Benchmarked 0% of residents are reported as African American or Black, compared to the Maryland average of 13%. A lower African American share than is typical in Maryland; local markets still vary widely. |
6% Other Ethnicity Residents — State Benchmarked 6% of residents fall into categories other than White or African American (combined), compared to the Maryland average of 6%. This column aggregates Hispanic, Asian, multiracial, and any other labeled groups that are not classified as White or African American. Reported subgroups in this total: Asian (6%). |
6% Residents Age 65–74 — State Benchmarked 6% of residents are 65–74, compared to the Maryland average of 13%. Fewer younger seniors suggests the resident population skews older, likely requiring higher acuity care and more hands-on support. |
18% Residents Age 75–84 — State Benchmarked 18% of residents are 75–84, compared to the Maryland average of 31%. Below the state norm — the resident mix may skew either younger or older than this typical middle bracket. |
53% Residents Age 85–94 — State Benchmarked 53% of residents are 85–94, compared to the Maryland average of 44%. A high concentration of very elderly residents signals a higher-acuity facility with experience caring for advanced age-related needs. |
24% Residents Age 95+ — State Benchmarked 24% of residents are 95 or older, compared to the Maryland average of 16%. A high proportion of the oldest-old suggests strong end-of-life care experience and very-high-acuity capabilities. |
| Sunrise of Rockville | SC AL HOS MC | Rockville (Baltimore Road) | 89
Facility
89
MD AVG
42
Rank
#150 / 685 | Yes |
89
Facility
89
MD AVG
43
Rank
#32 / 985 | Studio / 1 Bed / 2 Bed | 45
Facility
45
MD AVG
21
Rank
#4 / 210 | A- |
23% Male Residents — State Benchmarked 23% of residents are male, compared to the Maryland average of 31%. This facility caters to a majority female resident pool (77% female), consistent with the broader assisted living trend where women significantly outnumber men. |
77% Female Residents — State Benchmarked 77% of residents are female, compared to the Maryland average of 69%. Women comprise the large majority, consistent with national assisted living demographics where women live longer and enter care facilities at higher rates. |
87% White Residents — State Benchmarked 87% of residents are reported as White, compared to the Maryland average of 81%. Close to the average for this category among assisted living facilities in Maryland with reported race/ethnicity data. |
2% African American Residents — State Benchmarked 2% of residents are reported as African American or Black, compared to the Maryland average of 13%. A lower African American share than is typical in Maryland; local markets still vary widely. |
11% Other Ethnicity Residents — State Benchmarked 11% of residents fall into categories other than White or African American (combined), compared to the Maryland average of 6%. This column aggregates Hispanic, Asian, multiracial, and any other labeled groups that are not classified as White or African American. Reported subgroups in this total: Mixed Race (6%), Hispanic (3%), Asian (2%). |
3% Residents Age 65–74 — State Benchmarked 3% of residents are 65–74, compared to the Maryland average of 13%. Fewer younger seniors suggests the resident population skews older, likely requiring higher acuity care and more hands-on support. |
31% Residents Age 75–84 — State Benchmarked 31% of residents are 75–84, compared to the Maryland average of 31%. This is the second most common age bracket in assisted living, representing residents with moderate care needs. |
56% Residents Age 85–94 — State Benchmarked 56% of residents are 85–94, compared to the Maryland average of 44%. A high concentration of very elderly residents signals a higher-acuity facility with experience caring for advanced age-related needs. |
10% Residents Age 95+ — State Benchmarked 10% of residents are 95 or older, compared to the Maryland average of 16%. Most residents here have not yet reached the oldest-old bracket, suggesting a younger overall community. |
| Maplewood Park Place | SC AL IL MC NH SNF | Bethesda (Pooks Hill) | 29
Facility
29
MD AVG
42
Rank
#240 / 685 | Yes |
38
Facility
38
MD AVG
43
Rank
#542 / 985 | 1 Bed / 2 Bed | 30
Facility
30
MD AVG
21
Rank
#44 / 210 | - |
18% Male Residents — State Benchmarked 18% of residents are male, compared to the Maryland average of 31%. This facility caters to a majority female resident pool (82% female), consistent with the broader assisted living trend where women significantly outnumber men. |
82% Female Residents — State Benchmarked 82% of residents are female, compared to the Maryland average of 69%. Women comprise the large majority, consistent with national assisted living demographics where women live longer and enter care facilities at higher rates. |
100% White Residents — State Benchmarked 100% of residents are reported as White, compared to the Maryland average of 81%. A higher White share than is typical for assisted living in Maryland in this dataset — compare with peer facilities for local context. |
0% African American Residents — State Benchmarked 0% of residents are reported as African American or Black, compared to the Maryland average of 13%. A lower African American share than is typical in Maryland; local markets still vary widely. |
0% Other Ethnicity Residents — State Benchmarked 0% of residents fall into categories other than White or African American (combined), compared to the Maryland average of 6%. This column aggregates Hispanic, Asian, multiracial, and any other labeled groups that are not classified as White or African American. | - |
6% Residents Age 75–84 — State Benchmarked 6% of residents are 75–84, compared to the Maryland average of 31%. Below the state norm — the resident mix may skew either younger or older than this typical middle bracket. |
24% Residents Age 85–94 — State Benchmarked 24% of residents are 85–94, compared to the Maryland average of 44%. The population here skews younger than the statewide norm, which may indicate a more active, lower-acuity community. |
71% Residents Age 95+ — State Benchmarked 71% of residents are 95 or older, compared to the Maryland average of 16%. A high proportion of the oldest-old suggests strong end-of-life care experience and very-high-acuity capabilities. |
| Ingleside at King Farm | SC AL IL MC NH SNF | Rockville (King Farm) | 45
Facility
45
MD AVG
42
Rank
#219 / 685 | Yes |
73
Facility
73
MD AVG
43
Rank
#152 / 985 | 1 Bed / 2 Bed | - | - | - | - | - | - | - | - | - | - | - |
| Homewood Living Frederick | SC AL IL MC NH SNF | Frederick | 120
Facility
120
MD AVG
42
Rank
#73 / 685 | Yes |
14
Facility
14
MD AVG
43
Rank
#788 / 985 | 1 Bed / 2 Bed | - | - | - | - | - | - | - | - | - | - | - |
| Residences at Vantage Point | SC AL HC IL MC NH SNF | Columbia (Town Center) | 44
Facility
44
MD AVG
42
Rank
#222 / 685 | Yes |
52
Facility
52
MD AVG
43
Rank
#402 / 985 | Studio / 1 Bed / 2 Bed | 36
Facility
36
MD AVG
21
Rank
#16 / 210 | - | - | - | - | - | - | - | - | - | - |
| Buckingham‘s Choice | SC AL MC NH RC SNF | Adamstown (Baker Circle) | 42
Facility
42
MD AVG
42
Rank
#223 / 685 | No |
3
Facility
3
MD AVG
43
Rank
#930 / 985 | Private Rooms | 31
Facility
31
MD AVG
21
Rank
#39 / 210 | - | - | - | - | - | - | - | - | - | - |
| Sunrise of Pikesville | SC NH AL HOS MC | Pikesville (Old Court Road) | 96
Facility
96
MD AVG
42
Rank
#131 / 685 | Yes |
75
Facility
75
MD AVG
43
Rank
#131 / 985 | Studio / 1 Bed / 2 Bed | 45
Facility
45
MD AVG
21
Rank
#4 / 210 | A- |
30% Male Residents — State Benchmarked 30% of residents are male, compared to the Maryland average of 31%. This facility caters to a majority female resident pool (70% female), consistent with the broader assisted living trend where women significantly outnumber men. |
70% Female Residents — State Benchmarked 70% of residents are female, compared to the Maryland average of 69%. Women comprise the large majority, consistent with national assisted living demographics where women live longer and enter care facilities at higher rates. |
63% White Residents — State Benchmarked 63% of residents are reported as White, compared to the Maryland average of 81%. A lower White share than the Maryland average — the community may draw a more diverse resident mix relative to other facilities in Maryland. |
37% African American Residents — State Benchmarked 37% of residents are reported as African American or Black, compared to the Maryland average of 13%. A higher African American share than the typical Maryland average — useful context when comparing cultural fit and community composition. |
0% Other Ethnicity Residents — State Benchmarked 0% of residents fall into categories other than White or African American (combined), compared to the Maryland average of 6%. This column aggregates Hispanic, Asian, multiracial, and any other labeled groups that are not classified as White or African American. |
15% Residents Age 65–74 — State Benchmarked 15% of residents are 65–74, compared to the Maryland average of 13%. In line with the statewide profile for this youngest senior bracket in assisted living. |
27% Residents Age 75–84 — State Benchmarked 27% of residents are 75–84, compared to the Maryland average of 31%. This is the second most common age bracket in assisted living, representing residents with moderate care needs. |
41% Residents Age 85–94 — State Benchmarked 41% of residents are 85–94, compared to the Maryland average of 44%. This is typically the most common age bracket in assisted living — this facility is in line with the statewide norm. |
15% Residents Age 95+ — State Benchmarked 15% of residents are 95 or older, compared to the Maryland average of 16%. In line with the statewide profile for the oldest resident bracket. |
| Brighton Gardens of Friendship Heights | SC AL HOS MC | Chevy Chase (Friendship Boulevard) | 154
Facility
154
MD AVG
42
Rank
#39 / 685 | Yes |
86
Facility
86
MD AVG
43
Rank
#47 / 985 | Studio / 1 Bed / 2 Bed | 29
Facility
29
MD AVG
21
Rank
#48 / 210 | - |
20% Male Residents — State Benchmarked 20% of residents are male, compared to the Maryland average of 31%. This facility caters to a majority female resident pool (80% female), consistent with the broader assisted living trend where women significantly outnumber men. |
80% Female Residents — State Benchmarked 80% of residents are female, compared to the Maryland average of 69%. Women comprise the large majority, consistent with national assisted living demographics where women live longer and enter care facilities at higher rates. |
96% White Residents — State Benchmarked 96% of residents are reported as White, compared to the Maryland average of 81%. A higher White share than is typical for assisted living in Maryland in this dataset — compare with peer facilities for local context. |
1% African American Residents — State Benchmarked 1% of residents are reported as African American or Black, compared to the Maryland average of 13%. A lower African American share than is typical in Maryland; local markets still vary widely. |
3% Other Ethnicity Residents — State Benchmarked 3% of residents fall into categories other than White or African American (combined), compared to the Maryland average of 6%. This column aggregates Hispanic, Asian, multiracial, and any other labeled groups that are not classified as White or African American. Reported subgroups in this total: Asian (2%), Hispanic (1%). |
3% Residents Age 65–74 — State Benchmarked 3% of residents are 65–74, compared to the Maryland average of 13%. Fewer younger seniors suggests the resident population skews older, likely requiring higher acuity care and more hands-on support. |
31% Residents Age 75–84 — State Benchmarked 31% of residents are 75–84, compared to the Maryland average of 31%. This is the second most common age bracket in assisted living, representing residents with moderate care needs. |
49% Residents Age 85–94 — State Benchmarked 49% of residents are 85–94, compared to the Maryland average of 44%. A high concentration of very elderly residents signals a higher-acuity facility with experience caring for advanced age-related needs. |
15% Residents Age 95+ — State Benchmarked 15% of residents are 95 or older, compared to the Maryland average of 16%. In line with the statewide profile for the oldest resident bracket. |
| Sunrise of Frederick | SC AL MC | Frederick (Waterford) | 88
Facility
88
MD AVG
42
Rank
#152 / 685 | Yes |
62
Facility
62
MD AVG
43
Rank
#286 / 985 | Studio / Suite / 2 Bed | 45
Facility
45
MD AVG
21
Rank
#4 / 210 | A- |
31% Male Residents — State Benchmarked 31% of residents are male, compared to the Maryland average of 31%. This facility caters to a majority female resident pool (69% female), consistent with the broader assisted living trend where women significantly outnumber men. |
69% Female Residents — State Benchmarked 69% of residents are female, compared to the Maryland average of 69%. Women comprise the large majority, consistent with national assisted living demographics where women live longer and enter care facilities at higher rates. |
97% White Residents — State Benchmarked 97% of residents are reported as White, compared to the Maryland average of 81%. A higher White share than is typical for assisted living in Maryland in this dataset — compare with peer facilities for local context. |
2% African American Residents — State Benchmarked 2% of residents are reported as African American or Black, compared to the Maryland average of 13%. A lower African American share than is typical in Maryland; local markets still vary widely. |
2% Other Ethnicity Residents — State Benchmarked 2% of residents fall into categories other than White or African American (combined), compared to the Maryland average of 6%. This column aggregates Hispanic, Asian, multiracial, and any other labeled groups that are not classified as White or African American. Reported subgroups in this total: Hispanic (2%). |
10% Residents Age 65–74 — State Benchmarked 10% of residents are 65–74, compared to the Maryland average of 13%. Fewer younger seniors suggests the resident population skews older, likely requiring higher acuity care and more hands-on support. |
34% Residents Age 75–84 — State Benchmarked 34% of residents are 75–84, compared to the Maryland average of 31%. This is the second most common age bracket in assisted living, representing residents with moderate care needs. |
48% Residents Age 85–94 — State Benchmarked 48% of residents are 85–94, compared to the Maryland average of 44%. This is typically the most common age bracket in assisted living — this facility is in line with the statewide norm. |
6% Residents Age 95+ — State Benchmarked 6% of residents are 95 or older, compared to the Maryland average of 16%. Most residents here have not yet reached the oldest-old bracket, suggesting a younger overall community. |
| Autumn Lake Healthcare at Riverview | SC HOS NH PC RC SNF | Essex | 238
Facility
238
MD AVG
42
Rank
#5 / 685 | No |
61
Facility
61
MD AVG
43
Rank
#301 / 985 | - | - | - | - | - | - | - | - | - | - | - | - |
| Sterling Care Hillhaven Assisted Living and Memory Care | SC AL HOS MC NH SNF | Adelphi (Knollwood) | 66
Facility
66
MD AVG
42
Rank
#188 / 685 | No |
25
Facility
25
MD AVG
43
Rank
#684 / 985 | Studio / 1 Bed | - | - | - | - | - | - | - | - | - | - | - |
Rows per page:

View all Nearby Homes
Overview of Spring Arbor of Severna Park


Spring Arbor of Severna Park is an assisted living and memory care community that offers an inviting atmosphere so that residents can be comfortable and feel a sense of belonging in their new home; management ensures that everyone is treated with respect and compassion. Life in the assisted living community means a life of convenience and flexibility. Spring Arbor is an excellent community that has proven to be an exemplary resident-centered community where seniors can thrive while living a lovely life.
A senior living community that aims to let its residents live a worry-free lifestyle. They ensure that they are able to do many daily activities, such as medication management, bathing, dressing, and housekeeping. The goal of the professional care staff is to ensure that residents are receiving holistic wellness.
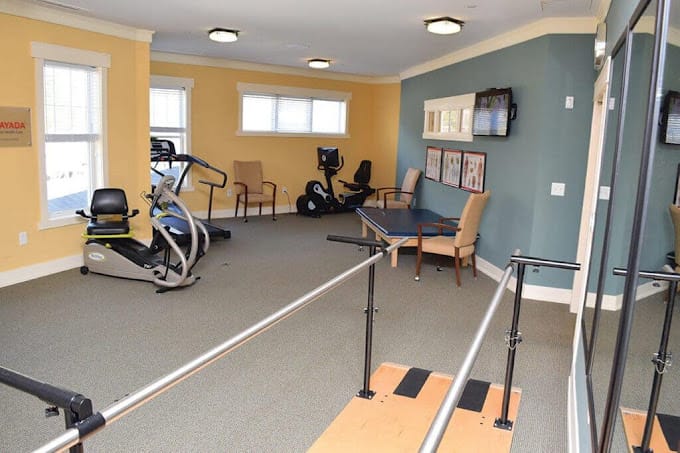
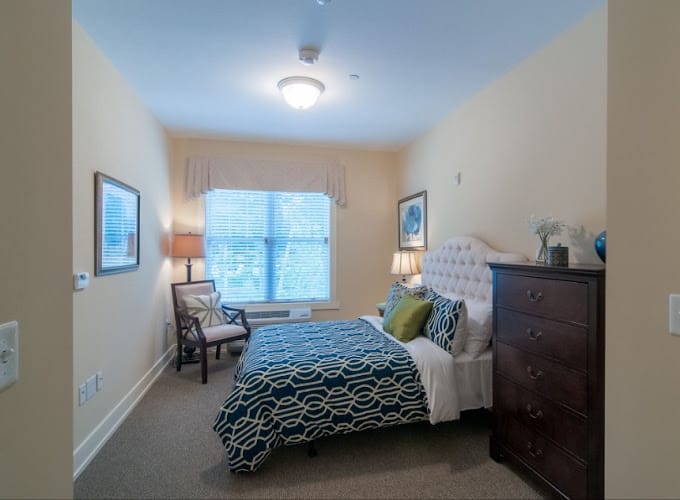
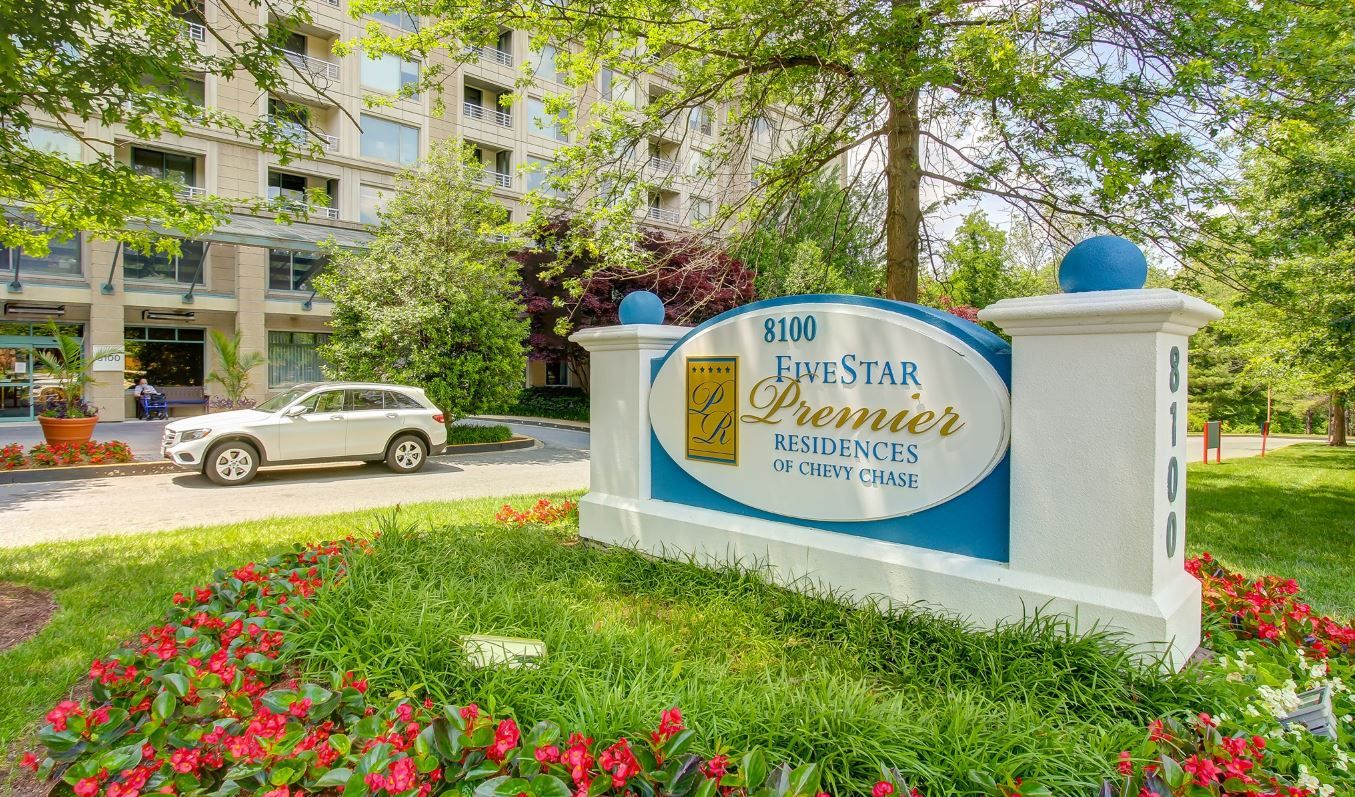
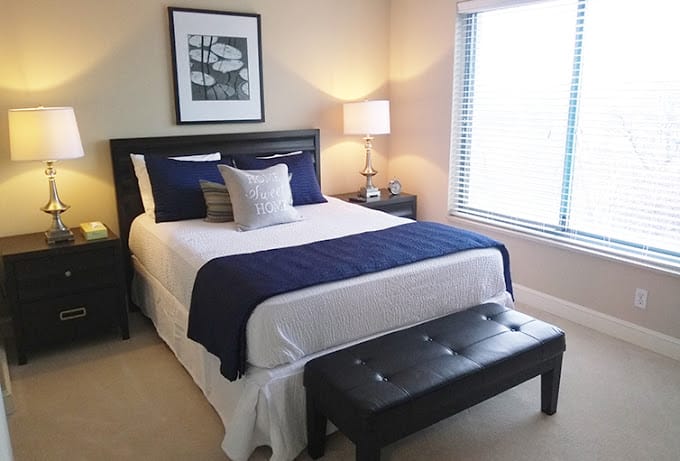
Experience high-rise living combined with hotel-style hospitality at Five Star Premier Residences of Chevy Chase. Within minutes of downtown Washington, D.C. This 17-story senior living community offers luxurious amenities, exquisite dining options, and comfortable apartments, all complemented by breathtaking views of the neighboring golf course.
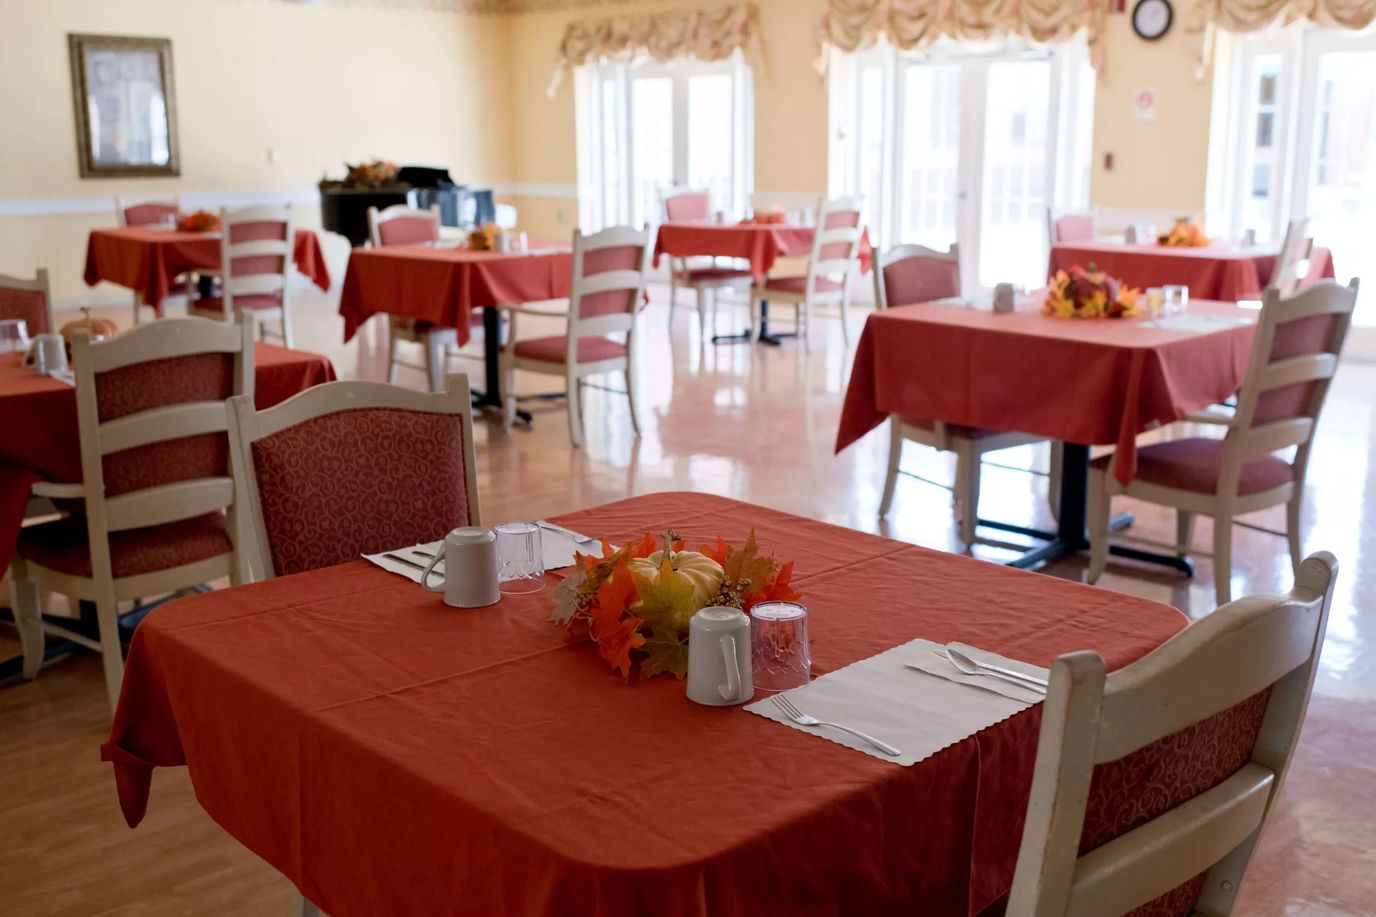
Their dedicated staff members are available around the clock to provide personalized care tailored to the needs of your loved one. In the elegant dining room, residents can indulge in chef-inspired meals in a restaurant-style ambiance. With individualized dining choices, their team effortlessly addresses senior appetite loss and accommodates specific dietary needs. Additionally, the attentive staff takes care of housekeeping and laundry tasks, enabling your loved one to embrace newfound freedom during their retirement.
For seniors, Malta House is the perfect place to stay active and engaged without the hassle of owning a home. Instead, they can focus on how to spend their days in the best way possible, doing what they love most. Plus, the affordability factor makes it ideal for low to moderate-income seniors and families. What sets Malta House apart from other assisted living communities is that it’s grounded in Catholic teachings and affiliated with Saint Mark, the Evangelist Church, and Saint John Baptist de la Salle. This adds a sense of belonging and comfort to the place, making it feel like a true home away from home. The healthcare services are impressive with rehabilitation, wound care, lab and imaging services, hospice care, podiatrist visits, and more.
Malta House also offers top-notch amenities such as a cozy living room with a fireplace, a well-stocked library, a media room, a garden with walking paths and fish ponds, Wi-Fi-enabled common areas, a beauty salon, and barber services. Living quarters at Malta House are spacious and allow residents to personalize their space with their personal touches like lifelong treasures and personal photos. This creates a true sense of home and belonging.
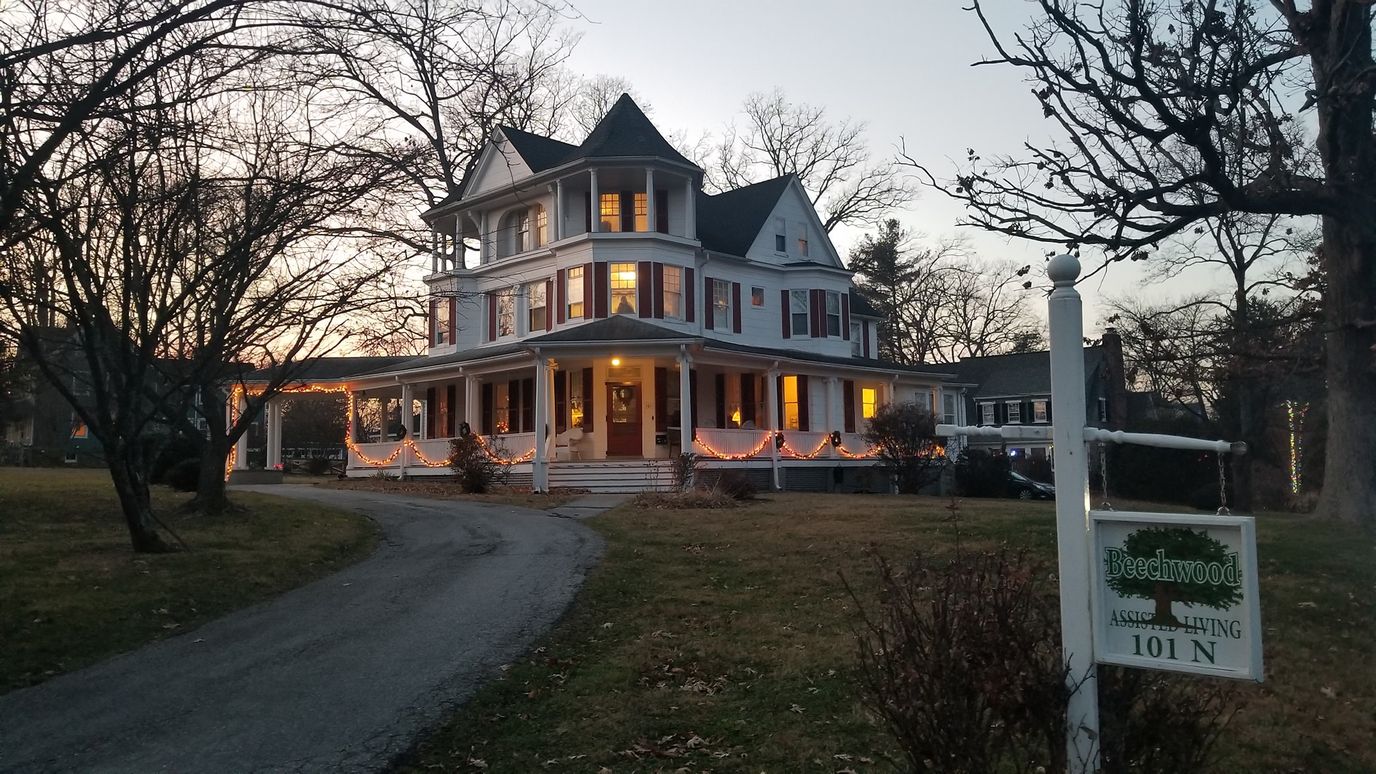
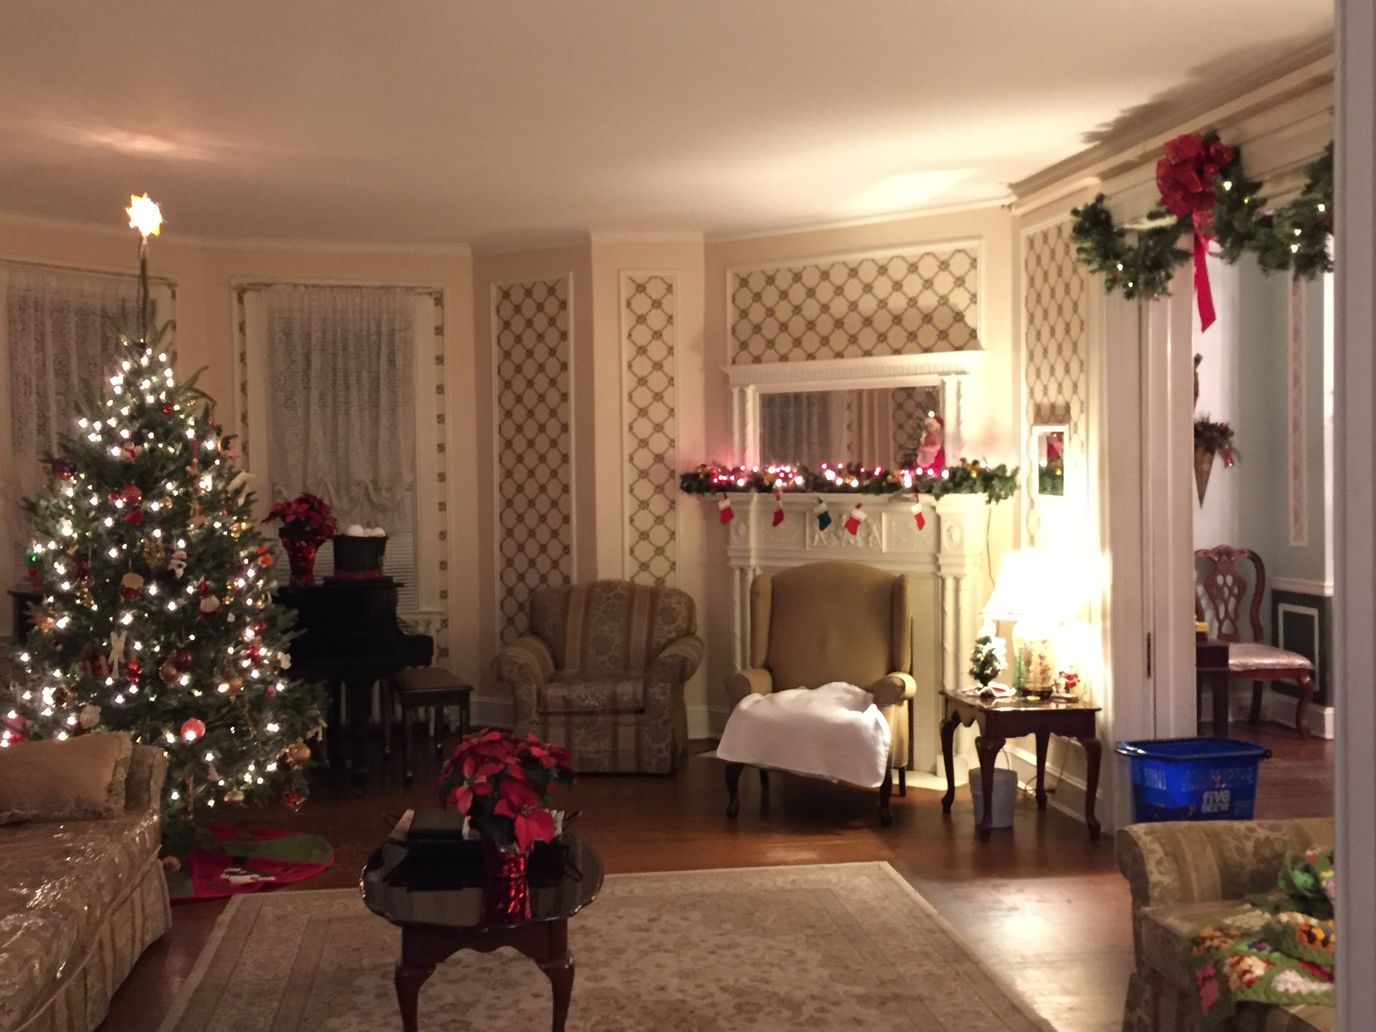
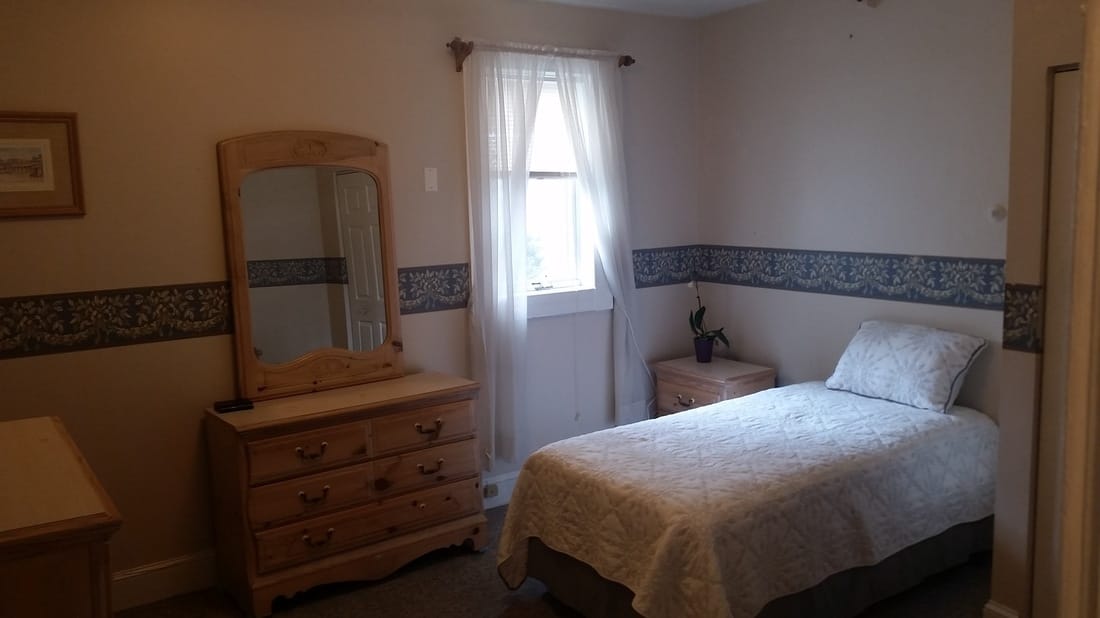
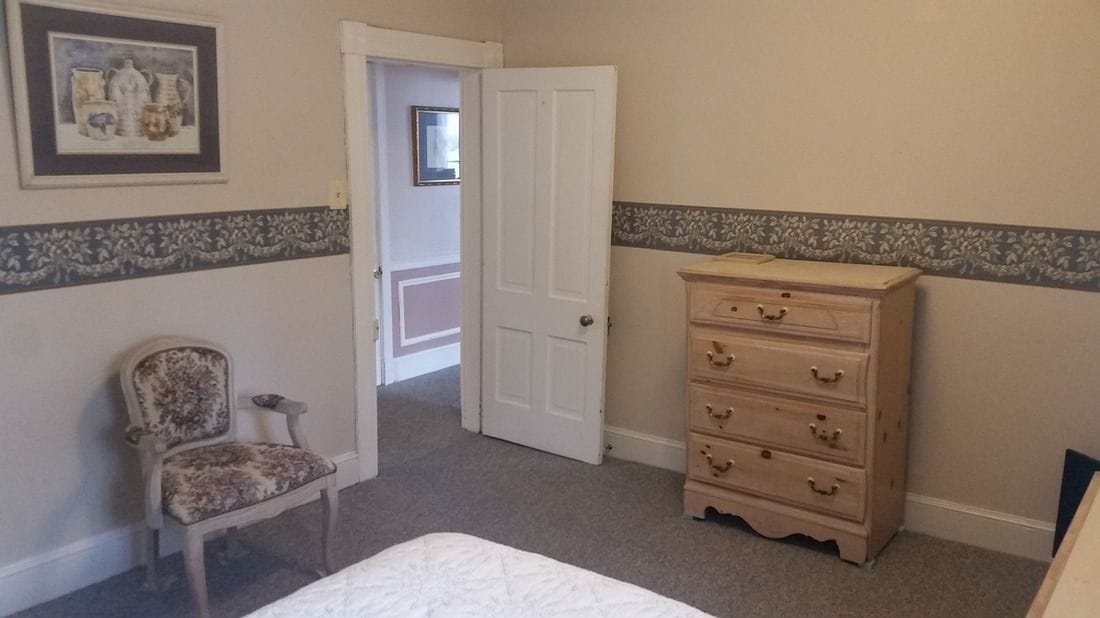
Overview of Beechwood Assisted Living
Beechwood Assisted Living is a cozy, comfortable, and elegant home with quality services in Catonsville. By offering senior assisted living services, residents maintain individuality and enrich their lifestyles through resort-style settings. Management strives to improve the lives of its residents by elevating their daily living in a quiet, charming location. The upscale senior living home ensures that quality caregiving is the top priority on their list, enabling a level of trust that many families have praised over the years.
Beechwood’s accommodations for hassle-free, accessible, and stable senior living. Premium services and amenities include fitness activities, recreational programs, scheduled outings, entertainment programs, specialized programs, home-cooked meals, housekeeping, transportation, and ADLs.
Overview of Seaton Silver Spring
Nestled in a serene location just outside Washington, D.C. and Baltimore, Aspenwood Senior Living Community in Silver Spring, MD, offers a stress-free retreat where seniors can truly relax and unwind. In the company of friends who have become like family, residents at Aspenwood Senior Living experience a genuine sense of belonging. The community comes alive with laughter and shared memories as residents gather for delightful cookouts, engaging in heartfelt conversations, while the convenient shuttle service allows residents to embark on enriching outings, such as exploring the Smithsonian Museum.
At Aspenwood Senior Living, the community understands the significance of pets in residents’ lives. The charmingly designed living spaces are thoughtfully pet-friendly, ensuring that cherished companions are always welcome. The all-inclusive pricing simplifies the financial aspect by bundling various expenses into one convenient monthly payment. With personalized care and exceptional services at the forefront, seniors can fully embrace a fulfilling lifestyle, unburdened by the complexities of managing multiple bills. Aspenwood Senior Living is committed to providing a warm and engaging environment where seniors can create cherished moments and make the most of their golden years.
Brookdale Hagerstown offers a welcoming community for seniors seeking assisted living or memory care. The community provides spacious, private apartments and charming common areas for residents to engage with friends and neighbors. With a full calendar of activities, classes, and outings, residents can stay as busy as they like. Brookdale Hagerstown offers a continuum of care, ensuring a smooth transition if further care is needed, and staff are available 24/7 for emergencies.
Each resident receives a personalized care assessment to meet their unique needs, and chef-inspired meals are served in the spacious, elegant dining room. For those requiring assisted living, Brookdale Hagerstown provides help with daily tasks like medication management, dressing, and bathing, allowing residents to focus on what matters most. The community’s industry-leading Clare Bridge memory care program offers a personalized path of engagement to help residents with Alzheimer’s or dementia flourish, even with advanced expressions of the disease. With a range of activities and a nurturing environment, Brookdale Hagerstown supports seniors in living their best lives.
Situated in Edgewater, Maryland, Brightview South River is a premier destination for assisted living, serving Anne Arundel County, Annapolis, Davidsonville, Crofton, and Crownsville. This assisted living community presents a range of living options tailored to seniors’ unique needs. With a dedication to enhancing every aspect of senior living, Brightview South River empowers residents to embrace life to the fullest.
With 64 Assisted Living apartments and an exclusive 26-apartment enclave called Wellspring Village®, devoted to cutting-edge Dementia Care, this senior living community prioritizes comprehensive well-being. Here, seniors find the perfect blend of assistance and a vibrant lifestyle. Offering a nurturing environment, they ensure that residents receive the support they require while enjoying their life.
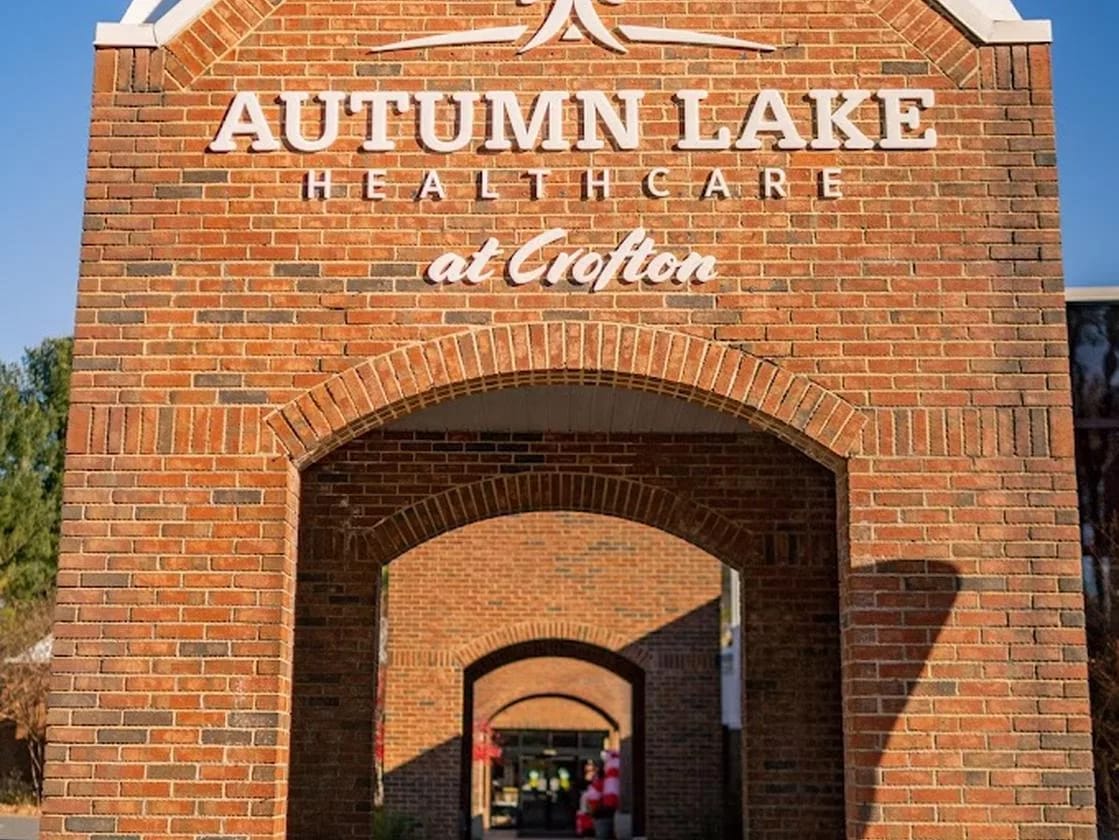
Nestled within the serene suburban enclave of Crofton, Autumn Lake Crofton offers continuous, skilled nursing support for a diverse range of complex medical conditions, ensuring residents receive attentive care 24/7. Senior individuals seek refuge in Autumn Lake Crofton to find solace, regain their strength, and experience revitalization under the expert and compassionate care of the dedicated rehabilitative team.
In addition to its sub-acute rehabilitation services, this facility is celebrated for its unwavering commitment to long-term care. For more than three decades, this cherished care provider has played an essential role in the community. Autumn Lake offers advanced care programs for complex medical conditions, with a dedicated staff ready to assist senior residents every step of the way.
Autumn Lake Healthcare at Crofton is an independently owned and operated healthcare center that is licensed to use the Autumn Lake Healthcare name and receive non-healthcare related services. All healthcare-related services are provided solely by Autumn Lake Healthcare at Crofton.
Autumn Lake Healthcare at Long View is Manchester’s trusted skilled nursing home, where residents thrive with the support of quality services for long-term nursing and sub-acute rehabilitation. Adding to the small-town charm of the atmosphere, residents and staff are encouraged to create friendships and build a mutual level of trust for a vibrant sense of community. At the Autumn Lake branch in Long View, the results-driven approach to senior recovery ensures that residents have a successful, relaxing, and rejuvenating recovery.
As an Autumn Lake home, expect the staff to deliver comprehensive long-term care, short-term rehabilitation, and skilled nursing services, seniors receive professional care in therapy (speech, occupational, physical), orthopedic care, wound care, colostomy care, pain management, stroke recovery, diabetes management, bariatric care, and cardio-pulmonary care– among many others.
Autumn Lake Healthcare at Long View is an independently owned and operated healthcare center that is licensed to use the Autumn Lake Healthcare name and receive non-healthcare related services. All healthcare-related services are provided solely by Autumn Lake Healthcare at Long View.
Arden Courts of Pikesville, located in Pikesville, Maryland, exhibits expertise in handling individuals with Alzheimer’s disease and dementia is reflected in their exceptional services. The community is meticulously designed, featuring common spaces, kitchen and family rooms, secure walking paths, and a serene courtyard, all tailored for the comfort of their residents.
Families can trust Arden Courts for their loved ones’ memory care needs, knowing they are in the hands of professionals. With a focus on memory care senior living, Arden Courts of Pikesville offers a secure and nurturing environment, providing peace of mind to families seeking expert care for their loved ones in the field of memory-related challenges.
Ranking Methodology
How we rank these communities
Every community above is evaluated across six weighted categories using public data including state inspection records, review platforms, BBB profiles, and operator-published materials.
Weighting overview
- 35%Resident Experience
- 25%Regulatory
- 15%Visual Media
- 10%Website
- 10%Stability
- 5%Environment
01
Resident & Family Experience 35%
The single largest share of every ranking. Aggregated review sentiment and volume from major platforms — the closest signal to real resident experience.
- Includes
- Review Sentiment
- Review Volume
02
Regulatory & Safety Record 25%
State inspection records, citations, and complaint visits. We weight per-inspection rates more heavily than raw counts.
- Includes
- State Inspections
- Citations/Inspection
- % Inspections w/ Citations
- Complaint Visits
- Accreditations
- BBB Rating
03
Visual Media & Transparency 15%
Communities that publish high-quality visuals give families a real preview. No photos or tours = a negative transparency signal.
- Includes
- Video Tours
- Virtual Walkthroughs
- Photo Quantity
- Photo Quality
04
Website & Operator Transparency 10%
Site quality and whether the operator publishes basic accountability information — staff names, contact details, ownership.
- Includes
- Website Content
- Mobile Usability
- Staff Info Available
- Owner Info Available
05
Community Stability 10%
Operational signals indicating whether a community is well-run and meeting demand.
- Includes
- Occupancy Rate
- Bed Options
06
Environment & Pricing 5%
Walkability and pricing transparency. Walk Score is weighted higher for Independent Living than for Memory Care, where most residents do not leave unaccompanied.
- Includes
- Walk Score
- Pricing Transparency
Nearby Cities
Who we are
Your Senior Care Partner, Every Step of the Way
We help families find affordable senior communities and unlock same day discounts, Medicaid, and Medicare options tailored to your needs.
Contact us Today
Updated on
